Lack of evidence for increased transcriptional noise in aged tissues
Curation statements for this article:-
Curated by eLife

Evaluation Summary:
The authors aim to tackle a fundamental question with their study: whether there is a direct age-associated increase of transcriptional noise. To investigate this question, they develop tools to analyze single-cell sequencing data from mouse and human aging datasets. Ultimately, application of their novel tool (Scallop) suggests that transcriptional noise does not change with age, changes in transcriptional noise can be attributed to other sources such as subtle shifts in cell identity. This study is in principle of broad interest, but it currently lacks a definitive demonstration of the robustness of Scallop. Systematic testing of this new package would ultimately strengthen the key conclusion of the work and give additional users more confidence when using the tool to estimate expression noise.
(This preprint has been reviewed by eLife. We include the public reviews from the reviewers here; the authors also receive private feedback with suggested changes to the manuscript. The reviewers remained anonymous to the authors.)
This article has been Reviewed by the following groups
Discuss this preprint
Start a discussion What are Sciety discussions?Listed in
- Evaluated articles (eLife)
Abstract
Aging is often associated with a loss of cell type identity that results in an increase in transcriptional noise in aged tissues. If this phenomenon reflects a fundamental property of aging remains an open question. Transcriptional changes at the cellular level are best detected by single-cell RNA sequencing (scRNAseq). However, the diverse computational methods used for the quantification of age-related loss of cellular identity have prevented reaching meaningful conclusions by direct comparison of existing scRNAseq datasets. To address these issues we created Decibel , a Python toolkit that implements side-to-side four commonly used methods for the quantification of age-related transcriptional noise in scRNAseq data. Additionally, we developed Scallop , a novel computational method for the quantification of membership of single cells to their assigned cell type cluster. Cells with a greater Scallop membership score are transcriptionally more stable. Application of these computational tools to seven aging datasets showed large variability between tissues and datasets, suggesting that increased transcriptional noise is not a universal hallmark of aging. To understand the source of apparent loss of cell type identity associated with aging, we analyzed cell type-specific changes in transcriptional noise and the changes in cell type composition of the mammalian lung. No robust pattern of cell type-specific transcriptional noise alteration was found across aging lung datasets. In contrast, age-associated changes in cell type composition of the lung were consistently found, particularly of immune cells. These results suggest that claims of increased transcriptional noise of aged tissues should be reformulated.
Article activity feed
-

-

Author Response
Public Evaluation Summary
The authors aim to tackle a fundamental question with their study: whether there is a direct age-associated increase of transcriptional noise. To investigate this question, they develop tools to analyze single-cell sequencing data from mouse and human aging datasets. Ultimately, application of their novel tool (Scallop) suggests that transcriptional noise does not change with age, changes in transcriptional noise can be attributed to other sources such as subtle shifts in cell identity. This study is in principle of broad interest, but it currently lacks a definitive demonstration of the robustness of Scallop. Systematic testing of this new package would ultimately strengthen the key conclusion of the work and give additional users more confidence when using the tool to estimate expression …
Author Response
Public Evaluation Summary
The authors aim to tackle a fundamental question with their study: whether there is a direct age-associated increase of transcriptional noise. To investigate this question, they develop tools to analyze single-cell sequencing data from mouse and human aging datasets. Ultimately, application of their novel tool (Scallop) suggests that transcriptional noise does not change with age, changes in transcriptional noise can be attributed to other sources such as subtle shifts in cell identity. This study is in principle of broad interest, but it currently lacks a definitive demonstration of the robustness of Scallop. Systematic testing of this new package would ultimately strengthen the key conclusion of the work and give additional users more confidence when using the tool to estimate expression noise.
We have now attempted to further demonstrate the robustness of Scallop by performing a more systematic analysis and a side-by-side comparison to other existing methods using a set of artificially generated datasets. These analyses have resulted in the inclusion of six supplementary figures that are presented in the subsections Scallop membership score accurately identifies transcriptionally noisy cells, Ability to detect noisy cells within cell types, Effect of cellular composition, Effect of dataset size, Effect of feature expression and Effect of cell type marker expression within the Results section of the revised manuscript.
We have also included a supplementary figure showing an in-depth analysis of a dataset where ageassociated increase in transcriptional noise was detected using alternative methods, but whose closer dissection has revealed that the difference in noise is due to a single donor and to the choice of methods. We discuss this is in the subsection Distance-to-centroid methods detect transcriptionally stable cell subtypes as transcriptional noise within the Results section.
Finally, we have revised the manuscript to clarify the main points raised by the reviewers: the definition of transcriptional noise, the reasoning behind the choice of the single-cell aging datasets and Leiden’s rationale. Also, we have expanded the description of the method to make the definition of membership score more clear to the readers, and discussed the implications of our main findings (a lack of evidence for age-related transcriptional noise) in the broader context of theories of aging.
Reviewer #1 (Public Review):
In the present study, Ibanez-Sole et al evaluate transcriptional noise across aging and tissues in several publicly available mouse and human datasets. Initially, the authors compare 4 generalized approaches to quantify transcriptional noise across cell types and later implement a new approach which uses iterative clustering to assess cellular noise. Based on implementation of this approach (scallop), the authors survey noise across seven sc-seq datasets relevant for aging. Here, the authors conclude that enhanced transcriptional noise is not a hallmark of aging, rather changes in cell identity and abundances, namely immune and endothelial cells. The development of new tools to quantify transcriptional noise from sc-seq data presents appeal, as these datasets are increasing exponentially. Further, the conclusion that increased transcriptional noise is not a defined aspect of aging is clearly an important contribution; however, given the provocative nature of this claim, more comprehensive and systematic analyses should be performed. In particular, the robustness and appeal of scallop is still not sufficiently demonstrated and given the complexity (multiple tissues, species and diverse relative age ranges) of datasets analyzed, a more thorough comparison should be performed. I list a few thoughts below:
Initially, the authors develop Decibel, which centralizes noise quantification methods. The authors provide schematics shown in Fig 1, and compare noise estimates with aging in Fig 2 - Supplement 2. Since the authors emphasize the necessary use of scallop as a ”better” pipeline, more systematic comparisons to the other methods should be made side-by-side.
We thank the reviewer for their positive assessment of the manuscript and their suggestions. We agree that side-by-side benchmarking of Scallop with the methods implemented in Decibel, as well as a more thorough analysis on the effect of different features such as dataset size, cellular composition, etc. might have on the output of Scallop will reinforce the main points of the manuscript. To experimentally respond to these requests, we took advantage of a set of four artificial datasets previously generated by us with the R package splatter (v1.10.1; as described in Ascensión et al. [1]). In the present work, we first run a side-by-side comparison between Scallop and two distance-to-centroid (DTC) methods on the four artificial datasets with increasing degrees of transcriptional noise present in them (the novel data are included as Figure 1 – Figure supplement 1 in the revised manuscript). Then, we compared Scallop to one DTC method regarding their ability to detect noisy cells in different cell types (Figure 1 – Figure supplement 2). Finally, we implemented four simulations to test the effect of the following features on the performance of Scallop: cellular composition (Figure 1 – Figure supplement 3), dataset size (Figure 1 – Figure supplement 4), number of genes (Figure 1 – Figure supplement 5) and marker gene expression (Figure 1 – Figure supplement 6). A summary of these results follows.
Side-by-side comparison of Scallop vs DTC methods
Each of the four artificial datasets used consists of 10K cells, from 9 populations, named Group1 to Group9, with the following relative abundances: 25, 20, 15, 10, 10, 7, 5.5, 4, and 3.5%, respectively. The four datasets only differ in the de.prob parameter used in their generation. The de.prob parameter determines the probability that a gene is differentially expressed between subpopulations within the dataset. The greater the de.prob value, the more differentially expressed genes there will be between clusters, meaning that the different cell types present in the dataset will cluster in a more robust way. Decreasing the value of de.prob results in datasets with noisy cells, with populations that do not have such a strong transcriptional signature. In order to study how Scallop can capture the degree of robustness with which cells of the same cell type cluster together, we selected four de.prob values (0.05, 0.016, 0.01 and 0.005) and measured transcriptional noise using Scallop and two DTC methods, the whole transcriptome-based Euclidean distance to cell type mean and the invariant gene-based Euclidean distance to tissue mean expression. These two methods were selected because GCL does not yield a transcriptional noise measure per cell, so no comparisons can be made with respect to the amount of noisy cells the method is able to detect within a cluster. Similarly, comparing Scallop to the ERCC spike in-based method was not possible for artificial datasets. Importantly, these analyses showed that Scallop, unlike DTC methods, was able to discern between the core transcriptionally stable cells within each cell type cluster from the more noisy cells that lie in between clusters (provided in the Figure 1 - Supplement 1 of revised manuscript).
Effect of dataset features on the performance of Scallop
We simulated five artificial datasets with the same nine cell type populations but whose relative abundances were different between datasets. We used the imbalance degree (ID) to measure class imbalance in each of them and to make sure that the selected cell compositions represented a wide range of imbalance degrees (to this end, we explored ID values between 1.2 and 5.3). The ID provides a normalized summary of the extent of class imbalance in a dataset in so-called ”multiclass” settings, that is to say, where more than two classes are present. It was specifically developed to improve the commonly used imbalance ratio (IR) measurement, whose calculation only considers the abundance of the most and the least popular classes and which gives the same summary for datasets with different numbers of minority classes. The presence of multiple minority classes is not uncommon in single-cell RNAseq datasets, as tissues might contain several rare cell types. We observed that the transcriptional noise measurements provided by Scallop were very robust to changes in imbalance degree (see Figure 1 - Supplement 3), both in qualitative and in quantitative terms. For instance, Group2 and Group8 were always detected as the most stable and noisiest cell types, respectively, regardless of their relative abundance in the dataset, and their average percentage of noise had little variation between different ID values: it ranged between 0-0.14% (Group2) and 16-18% (Group8).
The effect of dataset size (number of cells) and the number of genes was evaluated by generating versions of an artificial dataset where cells/genes had been subsampled from an original artificial dataset (the one generated with de.prob=0.001). We tested datasets sized 1,000-10,000 cells and with a number of genes between 5,000 and 14,000. Dataset size had nearly no impact on the transcriptional noise measurements provided by Scallop (Figure 1 - Supplement 4 of the revised manuscript). The average percentage of transcriptional noise per cell type remained within a narrow range as we implemented a ten-fold increase in dataset size. Perhaps more strikingly, removing the expression of most genes did not substantially impact transcriptional noise measurements per cell type (Figure 1 - Supplement 5). The variation when removing half of the genes (7,000 genes) was minimal, and we did not see important changes in transcriptional noise measurements unless over 60% of the genes from the original dataset were removed. For example, Figure 1 - Supplement 5C shows that noise measurements suffer important variations when removing 8,000 and 9,000 genes (and therefore keeping 6,000 and 5,000 genes, respectively), but only some cell types (Groups 4, 7, 8 and 9) were affected by these variations.
In order to measure the effect marker gene expression has on the membership with which cells are assigned to their cell type cluster, we ran a simulation where the top 10 markers for a cell type were removed from the dataset one by one, so that the first simulation lacked the expression of the Top1 marker, the second simulation had the effect of the first 2 markers removed (Top1 and Top2), and so on. Then, we ran Scallop on each of the resulting datasets and observed a steady increase in transcriptional noise associated with that cell type. This provided evidence that the strength of cell type marker expression in a cluster is directly related to its transcriptional stability (or lack of transcriptional noise). We included the result of this experiment in the revised version of the manuscript (Figure 1 - Supplement 6).
In conclusion, by using artificially generated datasets where the ground truth (cell type labels, degree of noise, etc) was known, the newly provided systematic analyses showed that Scallop had a remarkably robust response to said changes in dataset features, further reinforcing the manuscript conclusions.
For example, scallop noise estimates (Fig 2) compared to other euclidean distance-based measures (Fig 2 supplement 2) looks fairly similar.
It is true that some datasets show similar trends regardless of the transcriptional noise quantification method. For instance, the murine brain dataset by Ximerakis et al. shows no overall change in noise between the age groups across different methods. However, we do observe important differences in other examples. This is the case of the human pancreas dataset by Enge et al. and the human skin dataset by Solé-Boldo et al., where not only the magnitude but also the directionality of the trend are different depending on the method used to measure noise. In the former, three methods (Scallop, invariant gene-based Euclidean distance to average tissue expression and GCL) show an age-related increase in noise, whereas one method (whole transcriptome-based Euclidean distance to the cell type mean) shows a decrease in noise. In the latter, two methods (Scallop and GCL) yield a decrease in noise and the two DTC methods measure a mild increase in noise. These inconsistencies can now be reconciled with our proposed explanation that said ”noise” may actually be referring to substantially different biology in the diverse experimental settings.
Are downstream observations (ex lung immune composition changes more than noise) supported from these methods as well? If so, this would strengthen the overall conclusion on noise with age, but if not, it would be relevant to understand why.
Studying changes in cell type composition in the lung and other aged tissues would be highly pertinent. Nevertheless, we have measured changes in cell type composition using only one method that is based on Generalized Linear Models, covered in the subsection Age-related cell type enrichment of the Methods. The methods that we have compared in our study (DTC methods, ERCC-based methods, GCL, etc.) were all designed to measure transcriptional noise, but not changes in cell type composition.
Whether the effects of cell type composition changes are bigger than changes in noise for the rest of the methods used to measure noise was probably not clear enough in the original manuscript. We found no evidence for an increase in noise associated with aging, regardless of the method used. Although not included in the manuscript, we did generate heatmaps similar to the one shown in Figure 3B for each of the noise quantification methods. However, as the heatmap on the right side (the one showing cell type enrichment) was identical in each figure, we considered them to be redundant and decided not to include them, since they did not provide any additional insight besides giving more examples of lack of evidence for transcriptional noise, this time at the cell type level. We consider that the lack of evidence was already well demonstrated in the previous analyses (Figure 2 and Figure 2 - Supplement 2.
Similarly, the ’validation of scallop seems mostly based on the ability to localize noisy vs stable cells in Fig 1 supplement 1 and relative robustness within dataset to input parameters (Fig 1 supplement 2). A more systematic analysis should be performed to robustly establish this method. For example, noise cell clustering comparisons across the 7 datasets used. In addition, the Levy et all 2020 implemented a pathway-based approach to validate. Specifically, surrogate genes were derived from GCL value where KEGG preservation was used as an output. Similar additional types of analyses should be performed in scallop.
We believe that this legitimate concern is now solved with the newly included data. In particular, with the systematic comparison between Scallop and DTC methods on three artificially generated datasets with different degrees of transcriptional noise provided in Figure 1 - Supplement 2. The ability of Scallop to detect cells that are particularly noisy within a cell type, or cells that lie between cell types, may represent its biggest advantage with respect to other methods. DTC methods fail to discern between stable and noisy cells within cell types. Also, in our analysis, DTC methods were unable to distinguish between cell types that have a marked transcriptional program (which systematically cluster together) and those that have a less clear transcriptomic identity (which have at least part of their cells be assigned to other cell types across bootstrap iterations). However, comparing the performance of Scallop on the same datasets showed that our method was able distinguish between the two cases.
The conclusion that immune and endothelial cell transcriptional shifts associate more with age than noise are quite compelling, but seem entirely restricted to the mouse and human lung datasets. It would be interesting to know if pan-tissues these same cell types enrich age-related effects or whether this phenomenon is localized.
We agree with the reviewer that it would be very interesting to see whether a change in cell type composition (and particularly, an increase in abundance of immune cell types) is observed in aged tissues other than the lung. Qualitative cell type composition changes in the aging lung have been described in the literature [5]. Specifically, the higher abundance of immune cell types was observed in a single-nucleus RNAseq dataset of cardiopulmonary cells in Macaca fascicularis [6]. However, we believe that trying to answer the question whether this phenomenon holds in other tissues would require a systematic analysis of several datasets for each tissue with a sufficient number of donors/individuals in each of them. This is because our approach to measure age-associated cell type enrichment using generalized linear models relies heavily on having multiple biological replicates for each age group. Unfortunately, this is not the case for most published single-cell RNAseq datasets of aging. In any case, we have toned down the last sentence in the subsection Changes in the abundance of the immune and endothelial cell repertoires characterize the human aging lung by making it more clear that our claim regarding changes in the cellular composition of aged tissues is based on lung datasets (the text in italics represents what was added in the revised version of the manuscript):
"Even though the evidence for changes in tissue composition are based on a single tissue, we hypothesize that these facts may have influenced previous analyses of transcriptional noise associated with aging."
As discussed in the original manuscript, there is evidence published by other groups pointing out to pantissue changes in cellular composition with age, which undoubtedly will influence those analyses that did not pay attention to cellular composition changes in the datasets that they compared. Cellular composition is in fact a very important aspect that has been greatly overlooked. In fact, only one [7] out of the seven articles that had measured transcriptional noise in aging (the datasets used in Figure 2) had attempted to remove its effect by subsampling cells to balance compositions between age groups prior to their noise analysis. In any case, we do not believe this is the only phenomenon underlying the purported increase in transcriptional noise associated with age. Each dataset will most probably have different issues that the authors originally misread as an increase in noise or loss of cellular identity of a particular organ or tissue. As an additional example of such phenomena, we have now included a re-analysis of the data by Enge et al. [3] on ”noisy” β-cells in the aged human pancreas (Figure 5–Figure supplement 2 of the revised manuscript). In this case, rather than observing an age-dependent pattern, the 21-year-old donor presents much lower transcriptional noise values than the rest of the donors. However, there is no significant difference between the 22-year-old donor and the rest of the donors. We conclude that the statistically significant differences between the ”young” and ”old” age categories can be attributed to the abnormal noise values obtained for the 21-year-old donor, of uncertain origin. Finding out all causes of apparent transcriptional noise in other organs and tissues would be too lengthy, and certainly out of scope for the present manuscript.
Related to these, there does not seem to be a specific rationale for why these datasets (the seven used in total or the lung for deep-dive), were selected. Clearly, many mouse and human sc-RNA-seq datasets exist with large variations in age so expanding the datasets analyzed and/or providing sufficient rationale as to why these ones are appearing for noise analyses would be helpful. For example, querying ”aging” across sc-seq datasets in Single cell portal yields 79 available datasets: https://singlecell.broadinstitute. org/single_cell?type=study&page=1&terms=aging&facets=organism_age%3A0%7C103%7Cyears.
We now realize that the reasoning behind our selection of aging datasets was not sufficiently clear in the original manuscript. We thank the reviewer for pointing out this omission. We have made a more explicit reference to Appendices 2, 3, 4 and 6 in the revised manuscript. The seven selected scRNAseq datasets are those where transcriptional noise had originally been measured by the authors, using the computational methods that we later implemented in Decibel. Our aim was to first recapitulate previous reports of transcriptional noise using our novel method (Scallop). Thus, we downloaded all publicly available scRNAseq datasets of aged tissues where transcriptional noise had explicitly been measured. Some of them had reported an increase in transcriptional noise only in some cell types (for instance, the human aged pancreas dataset by Enge et al. [3]), whereas others found an increase in most cell types [7]. Appendix 2 summarizes the main features of those seven datasets (tissue, organism and number of cells) and provides information on whether an increase in transcriptional noise was observed in the original article where they were published. Additionally, the ”scope” column indicates where that increase was found (in which cell types), and the ”Method” column briefly describes the computational method used to measure transcriptional noise in that article. Appendix 3 provides information on the final datasets that were used in our analysis (Figure 2). Not every sample from the original dataset was included, so the inclusion criteria are specified there, as well as the number of cells, individuals and age of each of the cohorts. Appendix 4 shows the abnormal count distribution of two samples that were discarded from the Kimmel lung dataset. As for the selection of lung for the deep dive, the reason was that this was the organ with most datasets available, both for mouse and human. Appendix 6 provides information on the number of cells and donors per age cohort in the human lung datasets included in this study.
We have included the following sentence in the Increased transcriptional noise is not a universal hallmark of aging subsection in the Results:
"We provide a summary of the main characteristics of each dataset, as well as the findings regarding transcriptional noise obtained in each of the original studies, whether changes in transcriptional noise were restricted to particular cell types, and the computational method used to measure noise (see Appendix 2)."
The analysis that noise is indistinguishable from cell fate shifts is compelling, but again relies on one specific example where alternative surfactant genes are used as markers. The same question arises if this observation holds up to other cell types within other organs. For example the human cell atlas contains over dozens of tissue with large variations in age (https://www.science.org/doi/10.1126/science. abl4290).
We sympathize with this comment but hope that the reviewer will agree with us that providing an additional example of different phenomena originally reported as ”transcriptional noise” (in this case in aged human pancreas; see Figure 5 – Figure supplement 2), but actually reflecting something else, may be sufficient to prevent interested readers. In our opinion, it is likely that diverse phenomena will underlie the purported increases in transcriptional noise, and a re-analysis should be made case-by-case. We can only hope that researchers in the field re-analyze the available aging datasets in this new light.
Reviewer #2 (Public Review):
In this manuscript, Ibanez-Sole et al. focus on an important open question in ageing research; ”how does transcriptional noise increase at the cellular level?”. They developed two python toolkits, one for comparison of previously described methods to measure transcriptional noise, Decibel, and another one implementing a new method of variability measure based on cluster memberships, Scallop. Using published datasets and comparing multiple methods, they suggest that increased transcriptional noise is not a fundamental property of ageing, but instead, previous reports might have been driven by age-related changes in cell type compositions.
I would like to congratulate the authors on openly providing all code and data associated with the manuscript. The authors did not restrict their paper to one dataset or one approach but instead provided a comprehensive analysis of diverse biology across murine and human tissues.
While the results support their main conclusions, the lack of robustness/sensitivity measures for the methods used makes it difficult to judge the biology.The authors use real data to compare between methods but using synthetic data with known artificial ’variability’ across cell clusters can first establish the methods, which would make the results more convincing and easier to interpret. Despite the comprehensive analysis of biological data, a detailed prior description of how the methods behave against e.g. the number of cells in each cell type cluster, the number of cell types in the dataset, and % feature expression, would make the paper more convincing. Once the details of the method is provided, the python toolkit can be widely used, not limited to the ageing research community. I am also concerned that a definition of ’transcriptional noise’ (e.g. genome-wide noise, transcriptional dysregulation in cell-type-specific genes, noise in certain pathways) and its interpretation with regard to the biology of ageing is missing. Differences in different methods could be explained by the different biology they capture. Moreover, the interpretation of a lack of different types of variability may not be the same for the biology of ageing.
Increased transcriptional noise is compatible with genomic instability, loss of proteostasis and epigenetic regulation. Showing a lack of consistent transcriptional noise can challenge the widespread assumptions about how these hallmarks affect the organism. Overall, I found the paper very interesting and central to the field of ageing biology. However, I believe it requires a more detailed description of the methods and interpretations in the context of biology and theories of ageing.
We thank the reviewer for their positive assessment of the manuscript and their suggestions. We respond to each of the specific comments below.
Major comments
- The concept of transcriptional noise is central to the manuscript; however, what the authors consider as transcriptional noise and why is not clear. Genome-wide vs. function or cell-type specific noise could have different implications for the biology of ageing. In line with this, a discussion of the findings in the context of theories of ageing is necessary to understand its implications.
We thank the reviewer for pointing out the lack of clarity in this key point. The use of the ”transcriptional noise” term in the literature is quite heterogeneous, and we agree that the lack of a consensus definition may be confusing to the reader. For this reason, we adopted in the introduction the definition by Raser and O’Shea [8] as ”the measured level of variation in gene expression among cells supposed to be identical”, i.e. the sum of both intrinsic and extrinsic noise as previously defined by Swain and colleagues [9, 10]. In our opinion, this is generally what the literature of age-associated transcriptional noise is referring to.
With Scallop, we aimed to translate this concept to the context of single-cell RNAseq datasets, where clusters obtained using a community detection algorithm are typically annotated as distinct cell types.
Therefore, we aimed to measure transcriptional noise here defined as ”lack of membership to cell type clusters”. When running a clustering algorithm iteratively, if a cell is not unambiguously assigned to the same cluster, we consider it to be noisy. Conversely, when a cell consistently clusters with the same group of cells, we consider it to be stable. The membership score we use as a measure of stability is the frequency with which any given cell was assigned to the same cluster across all iterations.
We have included in the Results section an explicit reference to the Methods subsection that explains how Scallop works in detail, so that the readers can easily find that information:
"A detailed description of the three steps of the method (bootstrapping, cluster relabeling and computation of the membership score) is provided in the Scallop subsection in the Methods."
Additionally, we have now realized that the formula to compute the membership score might be more easily understood if we renamed the freq_score as freq_score(c), to make it clear that each cell is assigned a score. Also, we have used n and m instead of i and j in this notation, to avoid confusing the readers with the notation used in the previous section, where i and j represented the i-th and j-th bootstrap iterations. Finally, we have included a small paragraph to clarify what each component of the formula refers to. Below we show the formula and text included in the Methods section of the revised manuscript:

"Where |cn| is the number of times cell c was assigned to the n-th cluster, and Pm∈clusters |cm| is the sum of all assignments made on cell c, which is the same as the number of times cell c was clustered across bootstrap iterations."
Thus, and in order to accommodate this reviewer’s concerns, we have now included this exact definition of how we measure noise plus a statement making clear that we refer to the sum of both intrinsic and extrinsic noise aspects, with no distinction among them.
Similarly, we had discussed our findings in the framework of different theories of aging, such as their potential relationship to some of the established hallmarks of aging (genomic instability, epigenetic deregulation and loss of proteostasis), as well as with more recent theories of aging such as cell type imbalance in aged organs [11] and inter-tissue convergence [12]. However, it is now clear to us that this was not enough so we have now expanded these paragraphs to make our understanding of the work implications better understood. More specifically:
"Our results suggest that transcriptional noise is not a bona fide hallmark of aging. Instead, we posit that previous analyses of noise in aging scRNAseq datasets have been confounded by a number of factors, including both computational methods used for analysis as well as other biology-driven sources of variability."
- While I found the suggested method, Scallop, quite exciting and valuable, I would suggest including a number of performance/robustness measures (primarily based on simulations) on how sensitive the method is to the number of cells in each cell type (cellular composition), misannotations, % feature expression (number of 0s) etc.:
We have analyzed the effect of cellular composition and the percentage of feature expression by using artificially generated datasets (see Figure 1 - Supplements 3 and 5, respectively; and section Effect of dataset features on the performance of Scallop in the response to reviewer #1). Although studying the effect of misannotations on downstream analysis is important, we believe that Scallop was already designed so that its effects could be avoided, since the membership is measured for each cluster (and not for each cell type label). That is to say, a reference clustering is obtained at the beginning of the pipeline and memberships are computed using that output as a reference, which means Scallop noise values attributed to each cell are not affected by the original labeling of the dataset.
The output of these analyses reinforced our original conclusions, and it is now included in the Results section:
"In order to characterize and validate our method for transcriptional noise quantification, we conducted three types of analyses. First, we used artificially generated datasets containing various degrees of transcriptional noise to compare the performance of Scallop and DTC methods side-by-side, regarding their ability to measure transcriptional noise and detect noisy cells within cell types. Next, we ran simulations using artificial datasets in order to study the effect of a number of dataset features on the performance of Scallop: cellular composition, dataset size, number of genes and marker expression. Finally, we graphically evaluated the output of Scallop on a dataset of human T cells, we analyzed its robustness to its input parameters, and we studied the relationship between membership and robust marker expression, using a PBMC dataset."
2.1) Most importantly, knowing that cell-type composition changes with age, it is important to know how sensitive community detection is to the number of cells in each cell type. While the average can be robust, I wonder if the size of the cell-type cluster affects membership (voting).
We have included an analysis on a set of artificial datasets with different cellular compositions to evaluate the performance of Scallop in the presence of different degrees of class imbalance (see Figure 1 - Supplement 3). We explain the output of this analysis, which reinforces the algorithm’s robustness, in the Results section:
"Next, we ran a series of simulations on artificially generated datasets to evaluate the performance of Scallop in the presence of different levels of class imbalance, dataset size, number of genes, and different degrees of expression of cell type markers. Our analysis showed that Scallop was remarkably robust to changes in cellular composition (see Figure 1 - Supplement 3). Both the average percentage of noise and the distribution remained unchanged for a wide range of class imbalance degrees. Similarly, altering the dataset size (number of cells) and the number of genes of an artificial dataset did not cause any major changes on the transcriptional noise values attributed to each cell type (see Figure 1 - Supplements 4 and 5). Additionally, we conducted an analysis where we identified the 10 most differentially expressed gene markers for a cell type and measured the transcriptional noise associated with that cell type as we removed the expression of those genes from the dataset (Figure 1 - Supplement 5). Transcriptional noise steadily increased as we removed the effect of the top marker genes that defined the cell type under study (see Figure 1 - Supplement 5B). This experiment provides further evidence on how strong marker expression is related to robust cell type identity and how the lack of it results in transcriptional noise."
- Although the Leiden algorithm is widely used by many single-cell clustering methods, since the proposed methodology is heavily dependent on clustering, I suggest including a description of the Leiden algorithm.
We agree that understanding how community detection algorithms in general –and Leiden in particular– work is crucial to understand the core of the paper, so we have included a brief introduction to these methods in the Methods section, at the beginning of the Scallop subsection:
Leiden is a graph-based community detection algorithm that was designed to improve the popular Louvain method [13]. Graph-community detection methods take a graph representation of a dataset. In the context of single-cell RNAseq data, shared nearest neighbor (SNN) graphs are commonly used. These are graphs whose nodes represent individual cells and edges connect pairs of cells that are part of the K-nearest neighbors of each other by some distance metric. The aim of community detection algorithms like Leiden is to find groups of nodes that are densely connected between them, by optimizing modularity. For a graph with C communities, the modularity (Q) is computed by taking, for each community (group of cells), the difference between the actual number of edges in that community (ei) and the number of expected edges in that community ( K2/1/2m).
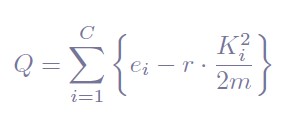
Where r is a resolution parameter (r > 0) that controls for the amount of communities: a greater resolution parameter gives more communities whereas a low resolution parameter fewer clusters. Since maximizing the modularity of a graph is an NP-hard problem, different heuristics are used, and Leiden has shown to outperform Louvain in this task both in terms of quality and speed [14]. However, users can choose to run the Louvain method instead by setting the parameter clustering="louvain" in the initialization of the Bootstrap object.
3.1) Most importantly, the authors comment that they found stronger expression of cell-type specific markers in the cells with high membership values - is it already a product of the Leiden algorithm that it weighs highly variable (thus cell-type specific) features higher - resulting in better prediction of cell-types for cells with strong cell-marker expression? It is important to make a description of transcriptional noise at this stage as it could be genome-wide or more specific to cell-type markers. Can authors provide any support that their method can capture both?
We agree with the reviewer that finding a stronger expression of cell-type markers in cells with high membership values is indeed something we expected. The graph representation of the dataset taken as input by Leiden is built after running highly variable gene detection and PCA. The neighbors of each cell are detected based on the expression of genes that are highly variable, as the reviewer pointed out, so genes that are differentially expressed between cells are more likely to contribute to the clusters found by Leiden.
Whether Scallop measures genome-wide or cell type-specific noise (or a mixture of both) is a very interesting question. Clusters in single-cell RNA sequencing datasets are often mainly driven by the presence/absence of a few cell type markers, rather than changes in expression levels of broader sets of genes. Moreover, it has been shown that single-cell RNAseq datasets generally preserve the same population structure even after data binarization [15]. This is a consequence of the sparsity of single-cell RNAseq datasets. In our case, any difference in expression between one cluster vs the rest of the cells in the dataset –be it the expression of a gene that was not detected in the rest of the cells or a higher expression of a gene whose presence is weaker in other clusters– will certainly have an impact on the output of every downstream analysis, from clustering to dimensionality reduction. The influence of the expression of cell type-specific markers on Scallop membership has been demonstrated in several analyses. First, the simulation where we measured the impact of removing the 10 most defining markers for a particular cell type on transcriptional noise measurements (included in the Figure 1 - Supplement 6 of the revised manuscript). Also, Figure 5 provides evidence that the differential expression of a handful of genes (in this case, genes coding for surfactant proteins) can have an impact on the clustering solutions obtained for a set of human alveolar macrophages, and this in turn influences the membership scores obtained with Scallop. In essence, Scallop merely provides a measure of the robustness of clustering at the single-cell level, so any type of transcriptional noise might have an impact on Scallop memberships, provided it is sufficiently strong to influence the output of the clustering algorithm used. In other words, the fact Scallop membership captures a mixture of both types of noise (genome-wide and that associated with cell type-specific markers) is a consequence of the influence both types of noise have on clustering.
- The authors conclude that Scallop outperforms other methods through the analysis of biological data, where there is no positive and negative control. I suggest creating synthetic datasets (which could be based on real data), introducing different levels of noise artificially (considering biological constraints like max/min expression levels) and then testing the performance where the truth about each dataset is known. Otherwise, the definitions of noisy and stable cells, regardless of the method, are arbitrary.
Our initial focus was on biological datasets, were no positive and negative controls regarding transcriptional noise could be used, but we agree in the need of including an analysis using simulations on artificial datasets. We analyzed artificially generated datasets with known degrees of transcriptional noise in order to evaluate the performance of Scallop on a setting where the ground truth is known beforehand. The way we modeled transcriptional noise was by tuning the de.prob parameter, which determines the probability that a gene will be differentially expressed between clusters. The creation of these datasets is explained in detail in the Methods section of the revised manuscript, and specifically in the subsections Performance of Scallop and two DTC methods on four artificial datasets with increasing transcriptional noise. and Ability to detect noisy cells within cell types.
We have now included the following section in the Results:
"We compared the output of Scallop and two DTC methods (the whole transcriptome-based Euclidean distance to average cell type expression and the invariant gene-based Euclidean distance to average tissue expression) on four artificially generated datasets containing various levels of transcriptional noise. The analysis showed that Scallop, unlike DTC methods, was able to discern between the core transcriptionally stable cells within each cell type cluster from the more noisy cells that lie in between clusters (see Figure 1 - Supplement 1). We then compared one of the DTC methods to Scallop regarding their ability to detect noisy cells within each of the cell types, by plotting the top 10% noisiest and top 10% most stable cells and (see Figure 1 - Supplement 2A). Analyzing the distribution of noise values for each cell type separately revealed that Scallop can distinguish between clusters that mainly consist of transcriptionally stable cells from noisier clusters that do not have such a distinct transcriptional signature (Figure 1 - Supplement 2B."
Reviewer #3 (Public Review):
In this manuscript, Ibáñez-Solé et al aim to clarify the answer to a very basic and important question that has gained a lot of attention in the past ∼5 years due to fast-increasing pace of research in the aging field and development/optimization of single-cell gene expression quantification techniques: how does noise in gene expression change during the course of cellular/tissue aging? As the authors clearly describe, there have been multiple datasets available in the literature but one could not say the same for the number of available analysis pipelines, especially a pipeline that quantifies membership of single cells to their assigned cell type cluster. To address these needs, Ibáñez-Solé et al developed: 1. a toolkit (named Decibel) to implement the common methods for the quantification of age-related noise in scRNAseq data; and 2. a method (named Scallop) for obtaining membership information for single-cells regarding their assigned celltype cluster. Their analyses showed that previously-published aging datasets had large variability between tissues and datasets, and importantly the author’s results show that noise-increase in aging could not be claimed as a universal phenotype (as previously suggested by various studies).
We thank the reviewer for their positive assessment of the manuscript and their suggestions.
Comments:
- In two relevant papers (doi.org/10.1038/s41467-017-00752-9anddoi.org/10.1016/j.isci. 2018.08.011), previous work had already shown what haploid/diploid genetic backgrounds could show in terms of intercellular/intracellular noise. Due to the direct nature of age/noise quantification in these papers, one cannot blame any computational pipeline-related issues for the ”unconventional” results. The authors should cite and sufficiently discuss the noise-related results of these papers in their Discussion section. These two papers collectively show how the specific gene, its protein half-life and ploidy can lead to similar/different noise outcomes.
We agree that we have failed to mention and sufficiently discuss the effects of measuring transcriptional noise from data generated via destructive experimentation, where no longitudinal analyses are possible. As aforementioned in the response to other reviewers, the body of literature on transcriptional noise is quite wide and based on heterogeneous assumptions. We have focused our efforts in measuring actual noise in scRNAseq aging datasets, which by definition imply sampling of different cells and thus make assumptions at the population level. We believe our results provide a different and interesting perspective into transcriptional noise and aging, but we agree with this reviewer in the need to discuss our findings in the context of other attempts to measure transcriptional noise in a more direct way. We have now included a brief discussion of the work by Sarnoski et al. and Liu et al.. This point is explained in more detail later in the letter.
- While the authors correctly put a lot of emphasis on studying the same cell type or tissue for a faithful interpretation of noise-related results, they ignore another important factor: tracking the same cell over time instead of calculating noise from single-cell populations at supposedly-different age points. Obviously, scRNAseq cannot analyze the same cell twice, but inability to assess noise-in-aging in the same cell over time is still an important concern. Noise could/does affect the generation durations and therefore neighboring cells in the same cluster may not have experienced the same amount of mitotic aging, for example. Also, perhaps a cell has already entered senescence at early age in the same tissue. This caveat should be properly discussed.
The distinction between intrinsic and extrinsic noise and the impossibility to discern between the two in destructive experiments is a relevant point that we have now included in the Discussion (the newly added text is shown in italics):
"Transcriptional noise could be related to genomic instability [18], epigenetic deregulation [19, 20] or loss of proteostasis [21], all established hallmarks of aging. Some authors consider transcriptional noise to be a hallmark of aging in and of itself [22]. In any case, the origin of transcriptional noise is unclear, as it could arise from many different sources. Most importantly, it not possible to distinguish between intrinsic and extrinsic noise from a snapshot of cellular states, i.e., one cannot tell whether the observed differences between cells in a single-cell RNA experiment reflect time-dependent variations in gene expression or differences between cells across a population [23]. Interestingly, recent work by Liu et al. measuring intrinsic noise in S. cerevisiae showed that aging is associated with a steady decrease in noise, with a sudden increase in soon-to-die cells. Another longitudinal study found an increase extrinsic noise and a lack of change in intrinsic noise in diploid yeast [16]."
Regarding the caveat of cells of individuals in the Young groups showing signs of aging, we can only agree that this is correct: there will be cells sampled that already show signs of cellular damage in the absence of chronological aging. However this applies to every study of aging that samples cells in a destructive manner and it is generally assumed by the field that this is a discrete phenomenon that does not affect the overall results in a meaningful way.
- Another weakness of this study is that the authors did not show the source/cause of decreasing/stable/increasing noise during aging. Understanding the source of loss of cell type identity is also important but this manuscript was about noise in aging, so it would have been nice if there could be some attempts to explain why noise is having this/that trend in differentially aged cell types in specific tissues.
The reviewer raises here a very important point that we would like to discuss in detail. The papers that we have re-analyzed generally assume that an increase in transcriptional noise and a loss in cell type identity are equivalent terms. However, as this reviewer points out, you could theoretically have cells that lose their cell type identity without a concomitant increase in transcriptional noise, for instance by a sharp decrease in a limited number of marker genes that collectively define that cell within a given cell type/cluster. Thus, transcriptional noise can certainly arise from different sources and several mechanisms have been proposed to explain its presence in the context of cellular aging. We agree with the reviewer that discussing how transcriptional noise could be related to aging is of interest to the readers. However, as pointed out in the responses to similar concerns by the other reviewers, our main finding is that we don’t detect meaningful and reliable increases in transcriptional noise associated with cell aging. Instead, what we see is a number of different technical and biological issues/phenomena that have been interpreted as transcriptional noise. We hope this reviewer will agree that the manuscript now presents a full and robust story and that finding the causes of up/down ”noise” trends in the different datasets may be more appropriately tackled by follow up studies.
- In the discussion section, the authors say that ”Most importantly, Scallop measures transcriptional noise by membership to cell type-specific clusters which is a re-definition of the original formulation of noise by Raser and O’Shea.” It is not clear what the authors refer to by ”the original formulation of noise by Raser and O’Shea”. Intrinsic/extrinsic noise formulations?? Please be more specific.
We thank the reviewer for pointing this out, since we agree that the sentence needed to be reformulated for the sake of clarity. What we meant by the definition by Raser and O’Shea was ”the measured level of variation in gene expression among cells supposed to be identical”, which does not make any distinction between intrinsic and extrinsic noise. Since their definition is previous to the development of single-cell technologies, we meant to state our attempt to bring this classic concept to the context of single-cell RNAseq. Nowadays, cell clusters produced by a community detection algorithm are given cell type annotations depending on their expression of known cell type markers. What Scallop aims to measure is the extent of membership each individual cell has for their cluster as evidence of its transcriptional stability. In order to make this point more clear, we have now rewritten the paragraph as follows:
Most importantly, Scallop measures transcriptional noise by membership to cell type-specific clusters which is a re-definition of the original formulation of noise by Raser and O’Shea: measurable variation among cells that should share the same transcriptome. This is in stark contrast to measurements of noise including other phenomena (as demonstrated in Figure 5) by the distance-to-centroid methods prevalent in the literature.
References
[1] M. Alex Ascensión, Olga Ibáñez-Solé, Iñaki Inza, Ander Izeta, and Marcos J Araúzo-Bravo. Triku: A feature selection method based on nearest neighbors for single-cell data. GigaScience, 11, 2022. doi: 10.1093/gigascience/giac017.
[2] M. Ximerakis, S. L. Lipnick, B. T. Innes, S. K. Simmons, X. Adiconis, D. Dionne, B. A. Mayweather, L. Nguyen, Z. Niziolek, C. Ozek, V. L. Butty, R. Isserlin, S. M. Buchanan, S. S. Levine, A. Regev, G. D. Bader, J. Z. Levin, and L. L. Rubin. Single-cell transcriptomic profiling of the aging mouse brain. Nat Neurosci, 22(10), 2019. doi: https://doi:10.1038/s41593-019-0491-3.
[3] M. Enge, H. E. Arda, M. Mignardi, J. Beausang, R. Bottino, S. K. Kim, and S. R. Quake. Single-cell analysis of human pancreas reveals transcriptional signatures of aging and somatic mutation patterns. Cell, 171(2), 2017. doi: https://doi:10.1016/j.cell.2017.09.004.
[4] L. Solé-Boldo, G. Raddatz, and S. et al. Schütz. Single-cell transcriptomes of the human skin reveal age-related loss of fibroblast priming. Commun Biol, 3(188), 2020. doi: https://doi.org/10.1038/ s42003-020-0922-4.
[5] Jaime L. Schneider, Jared H. Rowe, Carolina Garcia-de Alba, Carla F. Kim, Arlene H. Sharpe, and Marcia C. Haigis. The aging lung: Physiology, disease, and immunity. Cell, 184(8):1990–2019, 2021. doi: 10.1016/j.cell.2021.03.005.
[6] Shuai Ma, Shuhui Sun, Jiaming Li, Yanling Fan, Jing Qu, Liang Sun, Si Wang, Yiyuan Zhang, Shanshan Yang, Zunpeng Liu, and et al. Single-cell transcriptomic atlas of primate cardiopulmonary aging. Cell Research, 31(4):415–432, 2020. doi: 10.1038/s41422-020-00412-6.
[7] I. Angelidis, L. M. Simon, and I. E. et al. Fernandez. An atlas of the aging lung mapped by single cell transcriptomics and deep tissue proteomics. Nature Communications, 2019. doi: https://doi.org/10. 1038/s41467-019-08831-9.
[8] Jonathan M. Raser and Erin K. O’Shea. Noise in gene expression: origins, consequences, and control. Science, 309(5743):2010–2013, 2005. doi: 10.1126/science.1105891.
[9] Michael B. Elowitz, Arnold J. Levine, Eric D. Siggia, and Peter S. Swain. Stochastic gene expression in a single cell. Science, 297:1183– 1186, 2002. doi: 10.1126/science.1070919.
[10] Peter S. Swain, Michael B. Elowitz, and Eric D. Siggia. Intrinsic and extrinsic contributions to stochasticity in gene expression. Proc Natl Acad Sci U S A., 99:12795–12800, 2002. doi: 10.1073/pnas.162041399.
[11] Alex Cagan, Adrian Baez-Ortega, Natalia Brzozowska, Federico Abascal, Tim H. H. Coorens, Mathijs A. Sanders, Andrew R. J. Lawson, Luke M. R. Harvey, Shriram Bhosle, David Jones, Raul E. Alcantara, Timothy M. Butler, Yvette Hooks, Kirsty Roberts, Elizabeth Anderson, Sharna Lunn, Edmund Flach, Simon Spiro, Inez Januszczak, Ethan Wrigglesworth, Hannah Jenkins, Tilly Dallas, Nic Masters, Matthew W. Perkins, Robert Deaville, Megan Druce, Ruzhica Bogeska, Michael D. Milsom, Björn Neumann, Frank Gorman, Fernando Constantino-Casas, Laura Peachey, Diana Bochynska, Ewan St. John Smith, Moritz Gerstung, Peter J. Campbell, Elizabeth P. Murchison, Michael R. Stratton, and Iñigo Martincorena. Somatic mutation rates scale with lifespan across mammals. Nature, 604: 517–524, 2022. doi: 10.1038/s41586-022-04618-z.
[12] Hamit Izgi, Dingding Han, Ulas Isildak, Shuyun Huang, Ece Kocabiyik, Philipp Khaitovich, Mehmet Somel, and Handan Melike Dönertas. Inter-tissue convergence of gene expression during ageing suggests age-related loss of tissue and cellular identity. eLife, 11, 2022. doi: 10.7554/eLife.68048.
[13] Vincent D Blondel, Jean-Loup Guillaume, Renaud Lambiotte, and Etienne Lefebvre. Fast unfolding of communities in large networks. Journal of Statistical Mechanics: Theory and Experiment, 2008(10): P10008, oct 2008. doi: 10.1088/1742-5468/2008/10/p10008. URL https://doi.org/10.1088/ 1742-5468/2008/10/p10008.
[14] V. A. Traag, L. Waltman, and N. J. van Eck. From louvain to leiden: guaranteeing well-connected communities. Scientific Reports, 9, 2019. doi: https://doi.org/10.1038/s41598-019-41695-z.
[15] Peng Qiu. Embracing the dropouts in single-cell rna-seq analysis. Nature Communications, 11(1), 2020. doi: 10.1038/s41467-020-14976-9.
[16] Ethan A. Sarnoski, Ruijie Song, Ege Ertekin, Noelle Koonce, and Murat Acar. Fundamental characteristics of single-cell aging in diploid yeast. iScience, 7:96–109, 2018. doi: 10.1016/j.isci.2018.08.011.
[17] Ping Liu, Ruijie Song, Gregory L. Elison, Weilin Peng, and Murat Acar. Noise reduction as an emergent property of single-cell aging. Nature Communications, 8(1), 2017. doi: 10.1038/s41467-017-00752-9.
[18] Jan Vijg. From dna damage to mutations: All roads lead to aging. Ageing Res Rev., 68(101316), 2021. doi: 10.1016/j.arr.2021.101316.
[19] Yuancheng Lu, Benedikt Brommer, Xiao Tian, Anitha Krishnan, Margarita Meer, Chen Wang, Daniel L. Vera, Qiurui Zeng, Doudou Yu, Michael S. Bonkowski, Jae-Hyun Yang, Songlin Zhou, Emma M. Hoffmann, Margarete M. Karg, Michael B. Schultz, Alice E. Kane, Noah Davidsohn, Ekaterina Korobkina, Karolina Chwalek, Luis A. Rajman, George M. Church, Konrad Hochedlinger, Vadim N. Gladyshev, Steve Horvath, Morgan E. Levine, Meredith S. Gregory-Ksander, Bruce R. Ksander, Zhigang He, and David A. Sinclair. Reprogramming to recover youthful epigenetic information and restore vision. Nature, 588(7836):124–129, 2020. doi: 10.1038/s41586-020-2975-4.
[20] Giorgio Oliviero, Sergey Kovalchuk, Adelina Rogowska-Wrzesinska, Veit Schwämmle, and Ole N. Jensen. Distinct and diverse chromatin proteomes of ageing mouse organs reveal protein signatures that correlate with physiological functions. eLife, 11(e73524), 2022. doi: 10.7554/eLife.73524.
[21] Jingyi Li, Yuxuan Zheng, Pengze Yan, Moshi Song, Si Wang, Liang Sun, Zunpeng Liu, Shuai Ma, Juan Carlos Izpisua Belmonte, Piu Chan, Qi Zhou, Weiqi Zhang, Guang-Hui Liu, Fuchou Tang, and Jing Qu. A single-cell transcriptomic atlas of primate pancreatic islet aging. Natl Sci Rev., 8(2): nwaa127, 2020. doi: 10.1093/nsr/nwaa127.
[22] Alexander R. Mendenhall, George M. Martin, Matt Kaeberlein, and Rozalyn M. Anderson. Cellto-cell variation in gene expression and the aging process. Geroscience, 43(1):181–196, 2021. doi: 10.1007/s11357-021-00339-9.
[23] Lucy Ham, Marcel Jackson, and Michael PH Stumpf. Pathway dynamics can delineate the sources of transcriptional noise in gene expression. eLife, 10, 2021. doi: 10.7554/elife.69324.
-
Evaluation Summary:
The authors aim to tackle a fundamental question with their study: whether there is a direct age-associated increase of transcriptional noise. To investigate this question, they develop tools to analyze single-cell sequencing data from mouse and human aging datasets. Ultimately, application of their novel tool (Scallop) suggests that transcriptional noise does not change with age, changes in transcriptional noise can be attributed to other sources such as subtle shifts in cell identity. This study is in principle of broad interest, but it currently lacks a definitive demonstration of the robustness of Scallop. Systematic testing of this new package would ultimately strengthen the key conclusion of the work and give additional users more confidence when using the tool to estimate expression noise.
(This preprint has …
Evaluation Summary:
The authors aim to tackle a fundamental question with their study: whether there is a direct age-associated increase of transcriptional noise. To investigate this question, they develop tools to analyze single-cell sequencing data from mouse and human aging datasets. Ultimately, application of their novel tool (Scallop) suggests that transcriptional noise does not change with age, changes in transcriptional noise can be attributed to other sources such as subtle shifts in cell identity. This study is in principle of broad interest, but it currently lacks a definitive demonstration of the robustness of Scallop. Systematic testing of this new package would ultimately strengthen the key conclusion of the work and give additional users more confidence when using the tool to estimate expression noise.
(This preprint has been reviewed by eLife. We include the public reviews from the reviewers here; the authors also receive private feedback with suggested changes to the manuscript. The reviewers remained anonymous to the authors.)
-
Reviewer #1 (Public Review):
In the present study, Ibáñez-Solé1 et al evaluate transcriptional noise across aging and tissues in several publicly available mouse and human datasets. Initially, the authors compare 4 generalized approaches to quantify transcriptional noise across cell types and later implement a new approach which uses iterative clustering to assess cellular noise. Based on implementation of this approach (scallop), the authors survey noise across seven sc-seq datasets relevant for aging. Here, the authors conclude that enhanced transcriptional noise is not a hallmark of aging, rather changes in cell identity and abundances, namely immune and endothelial cells. The development of new tools to quantify transcriptional noise from sc-seq data presents appeal, as these datasets are increasing exponentially. Further, the …
Reviewer #1 (Public Review):
In the present study, Ibáñez-Solé1 et al evaluate transcriptional noise across aging and tissues in several publicly available mouse and human datasets. Initially, the authors compare 4 generalized approaches to quantify transcriptional noise across cell types and later implement a new approach which uses iterative clustering to assess cellular noise. Based on implementation of this approach (scallop), the authors survey noise across seven sc-seq datasets relevant for aging. Here, the authors conclude that enhanced transcriptional noise is not a hallmark of aging, rather changes in cell identity and abundances, namely immune and endothelial cells. The development of new tools to quantify transcriptional noise from sc-seq data presents appeal, as these datasets are increasing exponentially. Further, the conclusion that increased transcriptional noise is not a defined aspect of aging is clearly an important contribution; however, given the provocative nature of this claim, more comprehensive and systematic analyses should be performed. In particular, the robustness and appeal of scallop is still not sufficiently demonstrated and given the complexity (multiple tissues, species and diverse relative age ranges) of datasets analyzed, a more thorough comparison should be performed. I list a few thoughts below:
Initially, the authors develop Decibel, which centralizes noise quantification methods. The authors provide schematics shown in Fig 1, and compare noise estimates with aging in Fig 2 - Supplement 2. Since the authors emphasize the necessary use of scallop as a "better" pipeline, more systematic comparisons to the other methods should be made side-by-side. For example, scallop noise estimates (Fig 2) compared to other euclidean distance-based measures (Fig 2 supplement 2) looks fairly similar. Are downstream observations (ex lung immune composition changes more than noise) supported from these methods as well? If so, this would strengthen the overall conclusion on noise with age, but if not, it would be relevant to understand why.
Similarly, the 'validation of scallop seems mostly based on the ability to localize noisy vs stable cells in Fig 1 supplement 1 and relative robustness within dataset to input parameters (Fig 1 supplement 2). A more systematic analysis should be performed to robustly establish this method. For example, noise cell clustering comparisons across the 7 datasets used. In addition, the Levy et all 2020 implemented a pathway-based approach to validate. Specifically, surrogate genes were derived from GCL value where KEGG preservation was used as an output. Similar additional types of analyses should be performed in scallop
The conclusion that immune and endothelial cell transcriptional shifts associate more with age than noise are quite compelling, but seem entirely restricted to the mouse and human lung datasets. It would be interesting to know if pan-tissues these same cell types enrich age-related effects or whether this phenomenon is localized
Related to these, there does not seem to be a specific rationale for why these datasets (the seven used in total or the lung for deep-dive), were selected. Clearly, many mouse and human sc-RNA-seq datasets exist with large variations in age so expanding the datasets analyzed and/or providing sufficient rationale as to why these ones are appearing for noise analyses would be helpful. For example, querying "aging" across sc-seq datasets in Single cell portal yields 79 available datasets: https://singlecell.broadinstitute.org/single_cell?type=study&page=1&terms=aging&facets=organism_age%3A0%7C103%7Cyears
The analysis that noise is indistinguishable from cell fate shifts is compelling, but again relies on one specific example where alternative surfactant genes are used as markers. The same question arises if this observation holds up to other cell types within other organs. For example the human cell atlas contains over dozens of tissue with large variations in age (https://www.science.org/doi/10.1126/science.abl4290).
-
Reviewer #2 (Public Review):
In this manuscript, Ibanez-Sole et al. focus on an important open question in ageing research; "how does transcriptional noise increase at the cellular level?". They developed two python toolkits, one for comparison of previously described methods to measure transcriptional noise, Decibel, and another one implementing a new method of variability measure based on cluster memberships, Scallop. Using published datasets and comparing multiple methods, they suggest that increased transcriptional noise is not a fundamental property of ageing, but instead, previous reports might have been driven by age-related changes in cell type compositions.
I would like to congratulate the authors on openly providing all code and data associated with the manuscript. The authors did not restrict their paper to one dataset or one …
Reviewer #2 (Public Review):
In this manuscript, Ibanez-Sole et al. focus on an important open question in ageing research; "how does transcriptional noise increase at the cellular level?". They developed two python toolkits, one for comparison of previously described methods to measure transcriptional noise, Decibel, and another one implementing a new method of variability measure based on cluster memberships, Scallop. Using published datasets and comparing multiple methods, they suggest that increased transcriptional noise is not a fundamental property of ageing, but instead, previous reports might have been driven by age-related changes in cell type compositions.
I would like to congratulate the authors on openly providing all code and data associated with the manuscript. The authors did not restrict their paper to one dataset or one approach but instead provided a comprehensive analysis of diverse biology across murine and human tissues.
While the results support their main conclusions, the lack of robustness/sensitivity measures for the methods used makes it difficult to judge the biology. The authors use real data to compare between methods but using synthetic data with known artificial 'variability' across cell clusters can first establish the methods, which would make the results more convincing and easier to interpret. Despite the comprehensive analysis of biological data, a detailed prior description of how the methods behave against e.g. the number of cells in each cell type cluster, the number of cell types in the dataset, and % feature expression, would make the paper more convincing. Once the details of the method is provided, the python toolkit can be widely used, not limited to the ageing research community. I am also concerned that a definition of 'transcriptional noise' (e.g. genome-wide noise, transcriptional dysregulation in cell-type-specific genes, noise in certain pathways) and its interpretation with regard to the biology of ageing is missing. Differences in different methods could be explained by the different biology they capture. Moreover, the interpretation of a lack of different types of variability may not be the same for the biology of ageing.
Increased transcriptional noise is compatible with genomic instability, loss of proteostasis and epigenetic regulation. Showing a lack of consistent transcriptional noise can challenge the widespread assumptions about how these hallmarks affect the organism. Overall, I found the paper very interesting and central to the field of ageing biology. However, I believe it requires a more detailed description of the methods and interpretations in the context of biology and theories of ageing.
Major comments:
1. The concept of transcriptional noise is central to the manuscript; however, what the authors consider as transcriptional noise and why is not clear. Genome-wide vs. function or cell-type specific noise could have different implications for the biology of ageing. In line with this, a discussion of the findings in the context of theories of ageing is necessary to understand its implications.
2. While I found the suggested method, Scallop, quite exciting and valuable, I would suggest including a number of performance/robustness measures (primarily based on simulations) on how sensitive the method is to the number of cells in each cell type (cellular composition), misannotations, % feature expression (number of 0s) etc.:
2.1. Most importantly, knowing that cell-type composition changes with age, it is important to know how sensitive community detection is to the number of cells in each cell type. While the average can be robust, I wonder if the size of the cell-type cluster affects membership (voting).
3. Although the Leiden algorithm is widely used by many single-cell clustering methods, since the proposed methodology is heavily dependent on clustering, I suggest including a description of the Leiden algorithm.
3.1. Most importantly, the authors comment that they found stronger expression of cell-type specific markers in the cells with high membership values - is it already a product of the Leiden algorithm that it weighs highly variable (thus cell-type specific) features higher - resulting in better prediction of cell-types for cells with strong cell-marker expression? It is important to make a description of transcriptional noise at this stage as it could be genome-wide or more specific to cell-type markers. Can authors provide any support that their method can capture both?
4. The authors conclude that Scallop outperforms other methods through the analysis of biological data, where there is no positive and negative control. I suggest creating synthetic datasets (which could be based on real data), introducing different levels of noise artificially (considering biological constraints like max/min expression levels) and then testing the performance where the truth about each dataset is known. Otherwise, the definitions of noisy and stable cells, regardless of the method, are arbitrary. -
Reviewer #3 (Public Review):
In this manuscript, Ibáñez-Solé et al aim to clarify the answer to a very basic and important question that has gained a lot of attention in the past ~5 years due to fast-increasing pace of research in the aging field and development/optimization of single-cell gene expression quantification techniques: how does noise in gene expression change during the course of cellular/tissue aging? As the authors clearly describe, there have been multiple datasets available in the literature but one could not say the same for the number of available analysis pipelines, especially a pipeline that quantifies membership of single cells to their assigned cell type cluster. To address these needs, Ibáñez-Solé et al developed: 1. a toolkit (named Decibel) to implement the common methods for the quantification of …
Reviewer #3 (Public Review):
In this manuscript, Ibáñez-Solé et al aim to clarify the answer to a very basic and important question that has gained a lot of attention in the past ~5 years due to fast-increasing pace of research in the aging field and development/optimization of single-cell gene expression quantification techniques: how does noise in gene expression change during the course of cellular/tissue aging? As the authors clearly describe, there have been multiple datasets available in the literature but one could not say the same for the number of available analysis pipelines, especially a pipeline that quantifies membership of single cells to their assigned cell type cluster. To address these needs, Ibáñez-Solé et al developed: 1. a toolkit (named Decibel) to implement the common methods for the quantification of age-related noise in scRNAseq data; and 2. a method (named Scallop) for obtaining membership information for single-cells regarding their assigned cell-type cluster. Their analyses showed that previously-published aging datasets had large variability between tissues and datasets, and importantly the author's results show that noise-increase in aging could not be claimed as a universal phenotype (as previously suggested by various studies).
Comments:
1. In two relevant papers (doi.org/10.1038/s41467-017-00752-9 and doi.org/10.1016/j.isci.2018.08.011), previous work had already shown what haploid/diploid genetic backgrounds could show in terms of intercellular/intracellular noise. Due to the direct nature of age/noise quantification in these papers, one cannot blame any computational pipeline-related issues for the "unconventional" results. The authors should cite and sufficiently discuss the noise-related results of these papers in their Discussion section. These two papers collectively show how the specific gene, its protein half-life and ploidy can lead to similar/different noise outcomes.
2. While the authors correctly put a lot of emphasis on studying the same cell type or tissue for a faithful interpretation of noise-related results, they ignore another important factor: tracking the same cell over time instead of calculating noise from single-cell populations at supposedly-different age points. Obviously, scRNAseq cannot analyze the same cell twice, but inability to assess noise-in-aging in the same cell over time is still an important concern. Noise could/does affect the generation durations and therefore neighboring cells in the same cluster may not have experienced the same amount of mitotic aging, for example. Also, perhaps a cell has already entered senescence at early age in the same tissue. This caveat should be properly discussed.
3. Another weakness of this study is that the authors did not show the source/cause of decreasing/stable/increasing noise during aging. Understanding the source of loss of cell type identity is also important but this manuscript was about noise in aging, so it would have been nice if there could be some attempts to explain why noise is having this/that trend in differentially aged cell types in specific tissues.
4. In the discussion section, the authors say that "Most importantly, Scallop measures transcriptional noise by membership to cell type-specific clusters which is a re-definition of the original formulation of noise by Raser and O'Shea." It is not clear what the authors refer to by "the original formulation of noise by Raser and O'Shea". Intrinsic/extrinsic noise formulations?? Please be more specific.
-
