High-resolution quantitative and functional MRI indicate lower myelination of thin and thick stripes in human secondary visual cortex
Curation statements for this article:-
Curated by eLife

eLife assessment
This manuscript will be of interest to a wide range of neuroscientists and clinicians employing imaging methods. Using a combination of cutting edge high resolution magnetic resonance protocols, the authors investigate the structure-function relationship of specialised compartments in the human cortex in vivo. Their results indicate different patterns of myelination across the "stripes" of visual area V2, but will require further independent validation with myelin staining in the human brain.
This article has been Reviewed by the following groups
Discuss this preprint
Start a discussion What are Sciety discussions?Listed in
- Evaluated articles (eLife)
Abstract
The characterization of cortical myelination is essential for the study of structure-function relationships in the human brain. However, knowledge about cortical myelination is largely based on post-mortem histology, which generally renders direct comparison to function impossible. The repeating pattern of pale-thin-pale-thick stripes of cytochrome oxidase (CO) activity in the primate secondary visual cortex (V2) is a prominent columnar system, in which histology also indicates different myelination of thin/thick versus pale stripes. We used quantitative magnetic resonance imaging (qMRI) in conjunction with functional magnetic resonance imaging (fMRI) at ultra-high field strength (7 T) to localize and study myelination of stripes in four human participants at sub-millimeter resolution in vivo. Thin and thick stripes were functionally localized by exploiting their sensitivity to color and binocular disparity, respectively. Resulting functional activation maps showed robust stripe patterns in V2 which enabled further comparison of quantitative relaxation parameters between stripe types. Thereby, we found lower longitudinal relaxation rates ( R 1 ) of thin and thick stripes compared to surrounding gray matter in the order of 1–2%, indicating higher myelination of pale stripes. No consistent differences were found for effective transverse relaxation rates ( R 2 *). The study demonstrates the feasibility to investigate structure-function relationships in living humans within one cortical area at the level of columnar systems using qMRI.
Article activity feed
-

-

Author Response
Reviewer #1 (Public Review)
[...] One potential issue is that the high myelination signal is associated with the compartment in V2 (pale stripes) which was not functionally defined itself but by the absence of specific functional activations. No difference was reported between those stripes that were defined functionally. Other explanations for the differential pattern of a qMRI signals, e.g. ROI distribution for presumed pale stripes is not evenly distributed (more foveal), ROIs with low activations due to some other factor show higher myelin-related signals, cannot be excluded based on the analysis presented.
Indeed, it would have been advantageous to directly functionally delineate pale stripes in V2. Since we were not able to achieve this by fMRI, we needed an indirect method to infer pale stripe contributions in …
Author Response
Reviewer #1 (Public Review)
[...] One potential issue is that the high myelination signal is associated with the compartment in V2 (pale stripes) which was not functionally defined itself but by the absence of specific functional activations. No difference was reported between those stripes that were defined functionally. Other explanations for the differential pattern of a qMRI signals, e.g. ROI distribution for presumed pale stripes is not evenly distributed (more foveal), ROIs with low activations due to some other factor show higher myelin-related signals, cannot be excluded based on the analysis presented.
Indeed, it would have been advantageous to directly functionally delineate pale stripes in V2. Since we were not able to achieve this by fMRI, we needed an indirect method to infer pale stripe contributions in the analysis. We also added a statement in the discussion section to emphasize this more (p. 9, lines 286–288).
Furthermore, different myelination between thin and thick stripes was not tested, since we did not have a concrete hypothesis on this. Despite the conflicting findings of stronger myelination in dark or pale CO stripes in the literature, no histological study stated myelination differences between dark CO thin and thick stripes. Therefore, our primary interest and hypothesis was lying in comparing the different myelination of thin/thick and pale stripes using MRI.
Thank you very much for this comment about potential other sources of differential qMRI parameter patterns. Indeed, based on the original analysis we could not exclude that the absence of functional activation around the foveal representation may have biased our analysis. We therefore added a supporting analysis, in which we excluded the region around the foveal representation from the analysis. The excluded cortical region was kept consistent between participants by excluding the same eccentricity range in all maps. We added more details in the results section of the revised manuscript (p. 8, lines 189–202). In Figure 5-Supplement 1 and Figure 5-Supplement 3, results from this supporting analysis are shown which reproduced the primary findings from the main analysis, particularly the relatively higher myelination of pale stripes.
ROI definitions solely based on fMRI activation amplitude have additional limitations. However, we find it unlikely that a small fMRI effect size and low contrast-to-noise ratio (i.e. stochastic cause of low statistical parameter values/”activation”) has impacted the results, since Figure 3 shows that we could achieve a high degree of reproducibility for each participant.
We would note that the fact that we found consistent differences across MPM and MP2RAGE sessions makes some potential artifacts driving the differences unlikely. We also find it unlikely that systematic cerebral blood volume differences between stripes would have driven the results. A higher local blood volume would lead to increased BOLD responses but also to a higher R1 value due to the deoxy-hemoglobin induced relaxation, which is opposite to the observation of higher activity in the thick/thin stripes but lower R1 values.
Further studies using other functional metrics (e.g. VASO, ASL etc.) may help us to even more clearly demonstrate specificity but were out of the scope of this already rather extensive study. Although we have added extensive further analyses in the revised manuscript such as controlling for foveal effects or registration performance, we did not see a possibility to fully exclude a systematic bias that might potentially be caused by unknown factors.
Another theoretical and practical issue is the question of "ground truth" for the non-invasive qMRI measures, as the authors - as their starting point - roundly dismiss direct histological tissue studies as conflicting, rather than take a critical look at the merit of the conflicting study results and provide a best hypothesis. If so, they need to explain better how they calibrate their non-invasive MR measurements of myelin.
We agree and have now further elaborated on the limits of specificity of the R1 and R2* signal as cortical myelin marker (p. 2, lines 68–88; p. 6, line 163; p. 8, line 216; p. 9, lines. 257–260). However, we still think that it is important for the reader to appreciate the conflicting results in histological studies using staining methods for myelin, which adds to the study’s background.
We did not intend to give the impression that MRI provides the missing ground-truth to adjudicate histological controversies, but that it provides an alternative and additional view on the open questions. We changed the introduction to better reflect the aspect that the study offers a unique view by providing myelination proxies and functional measures in the same individual, which allows for direct comparison and investigation of structure-function relationships (see p. 2, lines 68–70; p. 3, lines 93–95), which is not accessible to any other approach. Nevertheless, we would like to note that R1 has been well established as a myelin marker under particular conditions (Kirilina et al., 2020; Mancini et al., 2020; Lazari and Lipp, 2021). It has also been widely used for cortical myelin mapping across a variety of populations, systems and field strengths. We added this statement to the introduction (see p. 2, lines 82-85). We note that we excluded volunteers with pathologies or neurological disorders from the study and their mean age was about 28 years. Thus, we had conditions comparable to previous (validation) studies.
Because of the contradictory findings of histological studies, we could not further finesse the hypothesis beyond our previous a priori hypothesis that we expected differences in the myelin sensitive MRI metrics between the thin/thick versus pale stripes. To improve the contextual understanding, we added a paragraph in the discussion section covering in more depth how the MRI results relate to known histological findings (see pp. 8–9, lines 216–240).
While this paper makes an important contribution to the question of the association of specific myelination patterns defining the columnar architecture in V2, it is not entirely clear whether the authors can fully resolve it with the data presented.
Indeed, we agree that non invasive aggregate measures, such as the R1 metrics, offer limited specificity which precludes a fully conclusive inference about cortical myelination. We have further emphasized this on several occasions in the text (see p. 2, lines 68–88; p. 6, line 163; p. 8, line 216; p. 9, lines. 257–260). Since the correspondence of cortical myelin levels and R1 (and other metrics) is an active area of research, we expect that the understanding, sensitivity and specificity of R1 to cortical myelination will further improve. We note that the use of qMRI is a substantial advance over weighted MRI typically used, which suffers from lack of specificity due to instrumental idiosyncrasies and varying measurement conditions.
Reviewer #2 (Public Review)
[...] Unfortunately, this particular study seems to fall into an unhappy middle ground in terms of the conclusions that can be drawn: the relaxometry measures lack the specificity to be considered "ground truth", while the authors claim that the literature lacks consensus regarding the structures that are being studied. The authors propose that their results resolve whether or not stripes differ in their patterns of myelination, but R1 lacks the specificity to do this. While myelin is a primary driver of relaxation times in cortex, relaxometry cannot be considered to be specific to myelin. It is possible that the small observed changes in R1 are driven by myelin, but they could also reflect other tissue constituents, particularly given the small observed effect sizes. If the literature was clear on the pattern of myelination across stripes, this study could confirm that R1 measurements are sensitive to and consistent with this pattern. But the authors present the work as resolving the question of how myelination differs between stripes, which over-reaches what is possible with this method. As it stands, the measured differences in R1 between functionally-defined cortical regions are interesting, but require further validation (e.g., using invasive myelin staining).
We agree that we have inadvertently overstated the specificity of R1 at several occasions in the text. We therefore toned down the statements concerning the correspondence between R1 and myelin throughout the manuscript (e.g. see p. 2, lines 68–88; p. 6, line 163; p. 8, line 216; p. 9, lines. 257–260).
We also removed the phrase that gave the impression that MRI can conclusively resolve the conflicting results found in histological studies. In the Introduction, we changed the corresponding paragraph by emphasizing the alternative view, which can be obtained from MRI by the possibility to investigate structure-function relationships in the living human brain, which would not be possible by invasive myelin staining (see p. 2, lines 68–70; p. 3, lines 93–95).
We acknowledge that – perhaps aside from electron microscopy – all common markers have shortcomings, which limit their specificity. For example, classic histology is not quantitative and resulted in conflicting results. It even includes the very fundamental issue, that the composition of myelin varies across the brain and within brain areas significantly (e.g., its lipid composition (González de San Román et al., 2018)). Thus, we regard the different invasive/non-invasive measures as complementary. R1 adds to this arsenal of measures and can be acquired non invasively. It has been shown to be a reliable myelin marker under certain circumstances. It follows the known myeloarchitecture patterns of the human brain, which was also checked for the data of the present study (see Figure 4 and Appendix 2). It is responsive to traumatic changes (Freund et al., 2019), development (Whitaker et al., 2016; Carey et al., 2018; Natu et al., 2019) and plasticity (Lazari et al., 2022). Since we studied healthy volunteers with no known pathologies that were sampled randomly from the population, we believe that the previous results generally apply and suggest sufficient specificity of the R1 marker. Of course, we cannot fully exclude bias due to unknown factors that have not been investigated/discovered by validation studies yet. However, in this case we expect that the systematic differences between stripe types would remain an important result most likely pointing to another interesting biological difference between stripes.
While more research is needed to clarify the precise role of R1 for cortical myelin, we think that the meaningful determination of quantitative MR parameter within one cortical area is still interesting for the neuroscientific community.
Moreover, the results make clear that R1 differences are not sufficiently strong to provide an independent measure of this structure (e.g., for segmentation of stripe). As such, one would still require fMRI to localise stripes, making it unclear what role R1 measures would play in future studies.
Indeed, the observed small effect sizes in the present study still requires a functional localization with fMRI. We expected small effect sizes using R1 and R2* due to the known small inter-areal or intra-cortical differences of MRI myelin markers. Therefore, this study aimed at a proof-of-concept investigating whether intra-areal R1 differences at the spatial scale of columnar structures can be detected using non-invasive MRI. Our study shows that these differences can be seen but currently not at the single voxel level. We anticipate that with further improvements in sequence development and scanner hardware, high-resolution R1 estimates with sufficient SNR can be acquired making fMRI redundant (for this kind of investigations). Please see the reply to the next comment concerning the impact of using R1 in future studies.
The Introduction concludes with the statement that "Whereas recent studies have explored cortical myelination ... using non-quantitative, weighted MR images... we showed for the first time myelination differences using MRI on a quantitative basis". As written, this sentence implies that others have demonstrated that simpler non-quantitative imaging can achieve the same aims as qMRI. Simply showing that a given method is able to achieve an aim would not be sufficient: the authors should demonstrate that this constitutes an important advance.
Thank you for this comment. It goes to the heart of the concerns raised about specificity and sensitivity of MRI based myelin metrics. We elaborate here on the main advantage of using qMRI in our current study and why it is more specific than weighted MR imaging. However, we emphasize that a thorough comparison between qMRI and weighted MRI is highly complex and refer to our recent review paper on qMRI for further details (Weiskopf et al., 2021), which are beyond the scope of our paper. The signal in weighted MRI, even when optimally optimized to the tissue of interest, additionally depends on both inhomogeneities in the RF transmit and receive (bias) fields. Other methods like using a ratio image (T1w/T2w) can cancel out the receive field bias entirely (in the case of no subject movements between scans) but not the transmit field bias. This hampers the direct analysis and interpretation of signal differences between distant regions of the brain. For high resolution imaging applications, the usage of high magnetic fields such as 7 T is beneficial or even mandatory due to signal-to-noise (SNR) penalties. With increasing field strength, these inhomogeneities also apply to small regions as V2. For these cases, qMRI is advantageous since it provides metrics which are free from these technical biases, significantly improving the specificity. As high-field MRI has the potential to non invasively study the structure and function of the human brain at the spatial scale of cortical layers and cortical columns, we believe that the results of our current study, which successfully demonstrate the applicability of qMRI to robustly detect small differences at the level of columnar systems, is relevant for future studies in the field of neuroscience.
We emphasized these considerations in the revised manuscript (see. p. 9, lines 273–285).
The study includes a very small number of participants (n=4). The advantage of non-invasive in-vivo measurements, despite the fact that they are indirect measures, should be that one can study a reasonable number of subjects. So this low n seems to undermine that point. I rarely suggest additional data collection, but I do feel that a few more subjects would shore up the study's impact.
The present study was conducted in line with a deep phenotyping study approach. That is, we focused on acquiring highly reliable datasets on individuals. We did not intend to capture the population variance, which is often the goal of other group studies, since low level and basic features such as stripes in V2 are expected to be present in all healthy individuals. Thus we traded off and prioritized test-retest measurements for fMRI sessions and using an alternative MP2RAGE acquisition over a larger number of individuals. This resulted in 6–7 scanning sessions on different days for each individual, summing up to 26 long scanning session in total. We also note that the used sample size is not smaller than in other studies with a similar research question. For example, another fMRI study investigating V2 stripes in humans used the same sample size of n=4 (Dumoulin et al., 2017).
The paper overstates what can be concluded in a number of places. For example, the paper suggests that R1 and R2* are highly-specific to myelin in a number of places. For example, on p7 the text reads" "We tested whether different stripe types are differentially myelinated by comparing R1 and R2*..." Relaxation times lack the specificity to definitively attribute these changes purely to myelin. Similarly, on p11: "Our study showed that pale stripes which exhibit lower oxidative metabolic activity according to staining with CO are stronger myelinated than surrounding gray matter in V2." This implies that the study directly links CO staining to myelination. In addition to using non-specific estimates of myelination, the study does not actually measure CO.
We agree that we did not clearly point out the limitations of R1 myelin mapping. Therefore, we toned down the statements about the connection between cortical myelin and R1. The mentioned statements in the reviewer’s comment were changed accordingly (see p. 6, line 163; p. 11, lines 353–354). We also included a small paragraph to clarify the used terminology (color-selective thin stripes, disparity-selective thick stripes) in the manuscript (see p. 4, lines 110–114) to avoid the inadvertent conflation of CO staining and actually measured brain activity.
I'm confused by the analysis in Figure 5. I can appreciate why the authors are keen to present a "tripartite" analysis (thick, thin, and pale stripes). But I find the gray curves confusing. As I understand it, the gray curves as generated include both the stripe of interest (red or blue plots) and the pale stripes. Why not just generate a three-way classification? Generating these plots in effect has already required hard classification of thin and thick stripes, so it is odd to create the gray plots, which mix two types of stripes. Alternatively, could you explicitly model the partial volume for a given cortical location (e.g., under the assumption that partial volume of thick and thin strips is indicated by the z-score) for the corresponding functional contrast? One could then estimate the relaxation times as a simple weighted sum of stripe-wise R1 or R2.
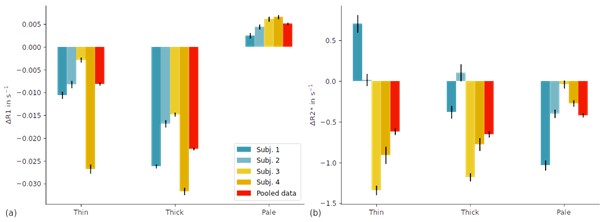
Figure on weighted average of stripe-wise R1 and R2. (a) shows the weighted sum of R1 (de-meaned and de-curved) over all V2 voxels. z-scores from color-selective thin stripe experiments and disparity-selective thick stripes were used as weights in the left and middle group of bars, respectively. An intermediate threshold of zmax=1.96 was used, i.e., final weights were defined as weights=(z-1.96). Weights with z<0 were set to 0. For pale stripes (right group of bars), we used the maximum z-score value from thin and thick stripe measurements. We then set all weights with z≥1.96 to 0 and used the inverse as final weights. i.e., weights = -1 * (max(z)-1.96). (b) shows the same analysis for R2. Error bars indicate 1 standard error of the mean.
(1) Yes, indeed. We agree that modeling the partial volume of each compartment (thin, thick and pale stripes) in each V2 voxel would be the most elegant approach. However, we note that z-scores between thin and thick stripe experiments may not reflect the voxel-wise partial volume effect, since they are a purely statistical measure and not a partial volume model. Having said this, we think that this general approach can give some additional insights and we provide results for a similar analysis here. We calculated the weighted sum of R1 and R2* values over all V2 voxels for each stripe compartment (thin, thick and pale stripes) independently (see above figure). For R1, we see the same pattern of R1 between stripe types as in the manuscript (Figure 5). Additionally, we show the differences here for each subject, which further demonstrates the reproducibility across subjects in our study. For R2*, no clear pattern across subjects emerged, confirming the results in our manuscript. Since, this analysis did not add relavant new information to the manuscript, we refrained from adding this figure to the manuscript, in order not to overload it.
(2) In our current study, we were not primarily interested in investigating differences between thin/thick stripes and pale stripes. While histological analysis found differences (though not consistent) between CO dark stripes (more myelinated, (Tootell et al., 1983)) and CO pale stripes (more myelinated, Krubitzer and Kaas, 1989)), no study stated myelin differences between CO dark stripes. This does not fully exclude the possibility of myelination differences but suggests that if myelination differences between CO dark stripes existed, they would presumably be smaller than differences between CO dark and CO pale stripes. Thus, it would be even more difficult to demonstrate than the hypothesis of this manuscript.
Therefore, we decided to directly test two compartments against each other instead of modeling all three compartments within a single model. In our analysis, we thereby loosely followed the analysis methods described in Li et al. (2019), which compared myelin differences between thin/thick and pale stripes in macaques. We note that this demonstrates further consistency, since it is not trivial that both thick and thin stripes show lower R1 values than the pale stripes. For example, there may be no or opposite differences.
(3) Just for clarification, the plots in Figure 5 show the comparison of R1 (or R2*) between two compartments in V2. The red (blue) curve includes the thin (thick) stripe of interest. The gray curve includes everything in V2 minus contributions from thick (thin) stripes of interest. If we take the thin stripe comparison as example (Figure 5a), then red contains the thin stripes of interest while gray contains everything minus the thick stripes. Therefore, assuming a tripartite stripe arrangement, the gray curve contains both thin and pale stripe contributions.
References
Carey D, Caprini F, Allen M, Lutti A, Weiskopf N, Rees G, Callaghan MF, Dick F. Quantitative MRI provides markers of intra-, inter-regional, and age-related differences in young adult cortical microstructure. Neuroimage 2018; 182:429–440.
Dumoulin SO, Harvey BM, Fracasso A, Zuiderbaan W, Luijten PR, Wandell BA, Petridou N. In vivo evidence of functional and anatomical stripe-based subdivisions in human V2 and V3. Sci Rep 2017; 7:733.
Freund P, Seif M, Weiskopf N, Friston K, Fehlings MG, Thompson AJ, Curt A. MRI in traumatic spinal cord injury: from clinical assessment to neuroimaging biomarkers. Lancet Neurol 2019; 18:1123–1135.
González de San Román E, Bidmon H-J, Malisic M, Susnea I, Küppers A, Hübbers R, Wree A, Nischwitz V, Amunts K, Huesgen PF. Molecular composition of the human primary visual cortex profiled by multimodal mass spectrometry imaging. Brain Struct Func 2018; 223:2767–2783.
Kirilina E, Helbling S, Morawski M, Pine K, Reimann K, Jankuhn S, Dinse J, Deistung A, Reichenbach JR, Trampel R, Geyer S, Müller L, Jakubowski N, Arendt T, Bazin P-L, Weiskopf N. Superficial white matter imaging: Contrast mechanisms and whole-brain in vivo mapping. Sci Adv 2020; 6:eaaz9281.
Krubitzer LA, Kaas JH. Cortical integration of parallel pathways in the visual system of primates. Brain Res 1989; 478:161–165.
Lazari A, Lipp I. Can MRI measure myelin? Systematic review, qualitative assessment, and meta-analysis of studies validating microstructural imaging with myelin histology. Neuroimage 2021; 230:117744.
Lazari A, Salvan P, Cottaar M, Papp D, Rushworth MFS, Johansen-Berg H. Hebbian activity-dependent plasticity in white matter. Cell Rep 2022; 39:110951.
Li X, Zhu Q, Janssens T, Arsenault JT, Vanduffel W. In Vivo Identification of Thick, Thin, and Pale Stripes of Macaque Area V2 Using Submillimeter Resolution (f)MRI at 3 T. Cereb 2019; 29:544–560.
Mancini M, Karakuzu A, Cohen-Adad J, Cercignani M, Nichols TE, Stikov N. An interactive meta-analysis of MRI biomarkers of myelin. Elife 2020; 9:e61523.
Natu VS, Gomez J, Barnett M, Jeska B, Kirilina E, Jaeger C, Zhen Z, Cox S, Weiner KS, Weiskopf N, Grill-Spector K. Apparent thinning of human visual cortex during childhood is associated with myelination. PNAS 2019; 116:20750–20759.
Tootell RBH, Silverman MS, De Valois RL, Jacobs GH. Functional Organization of the Second Cortical Visual Area in Primates. Science 1983; 220:737–739.
Weiskopf N, Edwards LJ, Helms G, Mohammadi S, Kirilina E. Quantitative magnetic resonance imaging of brain anatomy and in vivo histology. Nat Rev Phys 2021; 3:570–588.
Whitaker KJ, Vértes PE, Romero-Garcia R, Váša F, Moutoussis M, Prabhu G, Weiskopf N, Callaghan MF, Wagstyl K, Rittman T, Tait R, Ooi C, Suckling J, Inkster B, Fonagy P, Dolan RJ, Jones PB, Goodyer IM, NSPN Consortium, Bullmore ET. Adolescence is associated with genomically patterned consolidation of the hubs of the human brain connectome. PNAS 2016; 113:9105–9110.
-
eLife assessment
This manuscript will be of interest to a wide range of neuroscientists and clinicians employing imaging methods. Using a combination of cutting edge high resolution magnetic resonance protocols, the authors investigate the structure-function relationship of specialised compartments in the human cortex in vivo. Their results indicate different patterns of myelination across the "stripes" of visual area V2, but will require further independent validation with myelin staining in the human brain.
-
Reviewer #1 (Public Review):
In their manuscript, Haenelt et al. investigated the structure-function relationship for cortical columns in the in vivo human brain. The example they used is the thick stripe - pale stripe - thin stripe organisation of secondary visual cortex (V2).
The specific strength of the current study lies in the combination of cutting edge imaging protocols for quantitative measurements of myelin-related signals (qMRI) together with functional activation, both at submillimeter resolution at high field (7T). This allowed the visualisation of the stripy organisation of V2 with regards to colour (thin stripes) and binocular disparity (thick stripes) as well as myelination in individual human subjects. The main results suggest higher myelination for the pale stripe regions. This is in line with some earlier studies, …
Reviewer #1 (Public Review):
In their manuscript, Haenelt et al. investigated the structure-function relationship for cortical columns in the in vivo human brain. The example they used is the thick stripe - pale stripe - thin stripe organisation of secondary visual cortex (V2).
The specific strength of the current study lies in the combination of cutting edge imaging protocols for quantitative measurements of myelin-related signals (qMRI) together with functional activation, both at submillimeter resolution at high field (7T). This allowed the visualisation of the stripy organisation of V2 with regards to colour (thin stripes) and binocular disparity (thick stripes) as well as myelination in individual human subjects. The main results suggest higher myelination for the pale stripe regions. This is in line with some earlier studies, across primate species, but not with others.
One potential issue is that the high myelination signal is associated with the compartment in V2 (pale stripes) which was not functionally defined itself but by the absence of specific functional activations. No difference was reported between those stripes that were defined functionally. Other explanations for the differential pattern of a qMRI signals, e.g. ROI distribution for presumed pale stripes is not evenly distributed (more foveal), ROIs with low activations due to some other factor show higher myelin-related signals, cannot be excluded based on the analysis presented.
Another theoretical and practical issue is the question of "ground truth" for the non-invasive qMRI measures, as the authors - as their starting point - roundly dismiss direct histological tissue studies as conflicting, rather than take a critical look at the merit of the conflicting study results and provide a best hypothesis. If so, they need to explain better how they calibrate their non-invasive MR measurements of myelin.
While this paper makes an important contribution to the question of the association of specific myelination patterns defining the columnar architecture in V2, it is not entirely clear whether the authors can fully resolve it with the data presented.
The highly sophisticated methods and detailed analysis show that high resolution investigation of structure-function relationship of the columnar organisation in human visual cortex are feasible and reliable. V2 stripe patterns can be visualised structurally (with quantitative myelin-related measurements) and functionally (based on functional selectivity, which is of considerable importance for the field. The results indicate that in humans, the pale or inter strip regions might be associated with high patterns of myelination.
-
Reviewer #2 (Public Review):
This is a nice study that uses cutting-edge MRI measurements in the context of a carefully designed visual experiment. The data would seem to be of high quality and in general, the approach is promising for opening up avenues for non-invasive measurements of cortical myelination.
Unfortunately, this particular study seems to fall into an unhappy middle ground in terms of the conclusions that can be drawn: the relaxometry measures lack the specificity to be considered "ground truth", while the authors claim that the literature lacks consensus regarding the structures that are being studied. The authors propose that their results resolve whether or not stripes differ in their patterns of myelination, but R1 lacks the specificity to do this. While myelin is a primary driver of relaxation times in cortex, …
Reviewer #2 (Public Review):
This is a nice study that uses cutting-edge MRI measurements in the context of a carefully designed visual experiment. The data would seem to be of high quality and in general, the approach is promising for opening up avenues for non-invasive measurements of cortical myelination.
Unfortunately, this particular study seems to fall into an unhappy middle ground in terms of the conclusions that can be drawn: the relaxometry measures lack the specificity to be considered "ground truth", while the authors claim that the literature lacks consensus regarding the structures that are being studied. The authors propose that their results resolve whether or not stripes differ in their patterns of myelination, but R1 lacks the specificity to do this. While myelin is a primary driver of relaxation times in cortex, relaxometry cannot be considered to be specific to myelin. It is possible that the small observed changes in R1 are driven by myelin, but they could also reflect other tissue constituents, particularly given the small observed effect sizes. If the literature was clear on the pattern of myelination across stripes, this study could confirm that R1 measurements are sensitive to and consistent with this pattern. But the authors present the work as resolving the question of how myelination differs between stripes, which over-reaches what is possible with this method. As it stands, the measured differences in R1 between functionally-defined cortical regions are interesting, but require further validation (e.g., using invasive myelin staining).
Moreover, the results make clear that R1 differences are not sufficiently strong to provide an independent measure of this structure (e.g., for segmentation of stripe). As such, one would still require fMRI to localise stripes, making it unclear what role R1 measures would play in future studies.
The Introduction concludes with the statement that "Whereas recent studies have explored cortical myelination ... using non-quantitative, weighted MR images... we showed for the first time myelination differences using MRI on a quantitative basis". As written, this sentence implies that others have demonstrated that simpler non-quantitative imaging can achieve the same aims as qMRI. Simply showing that a given method is able to achieve an aim would not be sufficient: the authors should demonstrate that this constitutes an important advance.
The study includes a very small number of participants (n=4). The advantage of non-invasive in-vivo measurements, despite the fact that they are indirect measures, should be that one can study a reasonable number of subjects. So this low n seems to undermine that point. I rarely suggest additional data collection, but I do feel that a few more subjects would shore up the study's impact.
The paper overstates what can be concluded in a number of places. For example, the paper suggests that R1 and R2* are highly-specific to myelin in a number of places. For example, on p7 the text reads" "We tested whether different stripe types are differentially myelinated by comparing R1 and R2*..." Relaxation times lack the specificity to definitively attribute these changes purely to myelin. Similarly, on p11: "Our study showed that pale stripes which exhibit lower oxidative metabolic activity according to staining with CO are stronger myelinated than surrounding gray matter in V2." This implies that the study directly links CO staining to myelination. In addition to using non-specific estimates of myelination, the study does not actually measure CO.
I'm confused by the analysis in Figure 5. I can appreciate why the authors are keen to present a "tripartite" analysis (thick, thin, and pale stripes). But I find the gray curves confusing. As I understand it, the gray curves as generated include both the stripe of interest (red or blue plots) and the pale stripes. Why not just generate a three-way classification? Generating these plots in effect has already required hard classification of thin and thick stripes, so it is odd to create the gray plots, which mix two types of stripes. Alternatively, could you explicitly model the partial volume for a given cortical location (e.g., under the assumption that partial volume of thick and thin strips is indicated by the z-score) for the corresponding functional contrast? One could then estimate the relaxation times as a simple weighted sum of stripe-wise R1 or R2.
-
Reviewer #3 (Public Review):
Haenelt et al. used sub-mm resolution fMRI and quantitative R1 and R2*imaging in humans to investigate the relationship between putative myelin densities and functional responses confined to different mesoscale sub-compartments of area V2. Specifically, they presented color and disparity-varying stimuli, which are known to preferentially activate thick and thin V2 stripes in human and nonhuman primates. Based on these color and disparity signals, they created ROIs corresponding to the color-biased thin stripes, disparity-biased thick stripes, and the third non-thick non-thin compartment, putatively corresponding to the pale (or inter) stripes. Comparison of the R1 values across these functionally defined V2 sub-compartments revealed lower R1 values in both the color-biased thin and disparity-biased thick …
Reviewer #3 (Public Review):
Haenelt et al. used sub-mm resolution fMRI and quantitative R1 and R2*imaging in humans to investigate the relationship between putative myelin densities and functional responses confined to different mesoscale sub-compartments of area V2. Specifically, they presented color and disparity-varying stimuli, which are known to preferentially activate thick and thin V2 stripes in human and nonhuman primates. Based on these color and disparity signals, they created ROIs corresponding to the color-biased thin stripes, disparity-biased thick stripes, and the third non-thick non-thin compartment, putatively corresponding to the pale (or inter) stripes. Comparison of the R1 values across these functionally defined V2 sub-compartments revealed lower R1 values in both the color-biased thin and disparity-biased thick stripes relative to the putative pale stripes. The interpretation is that myelin densities in pale stripes is higher than in the two other V2 compartments, which corroborates previous studies using post-mortem Gallyas staining (myelin) in primates (yet not other histological studies using other markers for myelin density). The authors conclude that the combination of high-resolution high-sensitive quantitative and functional MRI enables studies whereby the relationship between anatomical and functional properties can be investigated in-vivo.
This study builds upon previous studies of the authors who now combined forces to merge their respective skills in mesoscale functional imaging on the one hand and quantitative MRI on the other hand. The distinction between color- and disparity-biased thin and thick stripes has been previously shown by Nasr, Polimeni and Tootell, yet it is the combination with R1 and R2* imaging that is unique in this study. Dumoulin et al. previously used T1/T2 ratios instead of R1 and R2*values to investigate exactly the same question. Surprisingly, that previous study led to the opposite conclusion, as they showed that pale stripes contain lower myelin densities compared to thick and thin stripes -possibly due to the use of other functional markers in their attempt to differentiate between thin and thick stripes, as also discussed in the present manuscript. The only other study, to the best of my knowledge, that used MRI techniques to separate the three stripe compartments in are V2, was a macaque study, also using the T1/T2 ratio as a surrogate for myelin densities. That monkey study yielded basically the same results as the current study by Haenelt and colleagues: pale stripes are more myelinated than the thick and inter stripes.
Hence the present study aids to resolve existing and important controversies in both the histology and (f)MRI literature. It needs to be kept in mind, however, that all the MRI measures used so far are a 'proxy' for determining myelin densities, hence the final ground-truth will have to come from a combination of functional studies with (novel?) histological methods to determine exactly myelin densities, which can then be used to compare with functional properties segregating the three V2 compartments.
Given the prior discrepancies between histological studies and between different MRI studies, and given the intrinsic importance to link function to fine-grained structural properties, the present study is potentially of great importance for the neuroimaging field -despite the relative small number of participating subjects. The experiments are well performed using state-of-the-art equipment, the analyses are well-done and the writing is excellent showing the scholastic skills of the authors. In addition, the authors discuss and exclude a number of alternative explanations for their results, which is highly informative for the reader. -
