Bacillus thuringiensis toxins divert progenitor cells toward enteroendocrine fate by decreasing cell adhesion with intestinal stem cells in Drosophila
Curation statements for this article:-
Curated by eLife

eLife assessment
Jneid et al find that an entomopathogenic strain of B. thuringiensis and its Cry1A toxins, which are widely used to combat lepidopteran pests, disrupt intestinal epithelial homeostasis in Drosophila-an insect that is generally considered non-suceptible. They demonstrate that the Cry1A toxins act by altering E-cadherin-based adhesion between intestinal stem cells and their new progeny. The findings carry potential implications for unintended, broad effects of B. thuringiensis in agricultural settings.
This article has been Reviewed by the following groups
Discuss this preprint
Start a discussion What are Sciety discussions?Listed in
- Evaluated articles (eLife)
Abstract
Bacillus thuringiensis subsp. kurstaki ( Btk ) is a strong pathogen toward lepidopteran larvae thanks to specific Cry toxins causing leaky gut phenotypes. Hence, Btk and its toxins are used worldwide as microbial insecticide and in genetically modified crops, respectively, to fight crop pests. However, Btk belongs to the B. cereus group, some strains of which are well known human opportunistic pathogens. Therefore, ingestion of Btk along with food may threaten organisms not susceptible to Btk infection. Here we show that Cry1A toxins induce enterocyte death and intestinal stem cell (ISC) proliferation in the midgut of Drosophila melanogaster , an organism non-susceptible to Btk . Surprisingly, a high proportion of the ISC daughter cells differentiate into enteroendocrine cells instead of their initial enterocyte destiny. We show that Cry1A toxins weaken the E-Cadherin-dependent adherens junction between the ISC and its immediate daughter progenitor, leading the latter to adopt an enteroendocrine fate. Hence, although not lethal to non-susceptible organisms, Cry toxins can interfere with conserved cell adhesion mechanisms, thereby disrupting intestinal homeostasis and endocrine functions.
Article activity feed
-

-

Author Response
Reviewer #1 (Public Review):
This work sheds light on the adverse effects of Bacillus thuringiensis, a strong pathogenic bacteria used as a microbial pesticide to kill lepidopteran larvae that threaten crops, on gut homeostasis of non-susceptible organisms. By using the Drosophila melanogaster as a non-susceptible organism model, this paper reveals the mechanisms by which the bacteria disrupt gut homeostasis. Authors combined the use of different genetic tools and Western blot experiments to successfully demonstrate that bacterial protoxins are released and activated throughout the fly gut after ingestion and influence intestinal stem cell proliferation and intestinal cell differentiation. This phenomenon relies on the interaction of activated protoxins with specific components of adherens junctions within the …
Author Response
Reviewer #1 (Public Review):
This work sheds light on the adverse effects of Bacillus thuringiensis, a strong pathogenic bacteria used as a microbial pesticide to kill lepidopteran larvae that threaten crops, on gut homeostasis of non-susceptible organisms. By using the Drosophila melanogaster as a non-susceptible organism model, this paper reveals the mechanisms by which the bacteria disrupt gut homeostasis. Authors combined the use of different genetic tools and Western blot experiments to successfully demonstrate that bacterial protoxins are released and activated throughout the fly gut after ingestion and influence intestinal stem cell proliferation and intestinal cell differentiation. This phenomenon relies on the interaction of activated protoxins with specific components of adherens junctions within the intestinal epithelium. Due to conserved mechanisms governing intestinal cell differentiation, this work could be the starting point for further studies in mammals.
The conclusions proposed by the authors are in general well supported by the data. However, some improvements in data representation, as well as additional key control experiments, would be needed to further reinforce some key points of the paper.
We thank reviewer1 for her appreciation of the work and in depth analysis of the data. We agree with all her comments and believe the suggestions significantly improved the manuscript.
- Figure 1 and others: Several graphs in the manuscript show the number of cells/20000µm2. How is the shape of the gut in the different conditions studied in this manuscript? The gut shape (shrunk gut versus normal gut for example) could influence the number of cells seen in a small area. For example, the number of total cells quantified in a small area (here 20000µm2) of a shrunk gut can be increased while their size decrease. As a result, the quantification of a specific cell type in a small region (here 20000µm2) can be biased and not represent the real number of cells present in the whole posterior part of the R4 region. Would it make sense to calculate a ratio "number of X cells/number of DAPI positive cells per 20000µm2"?
We provided a suitable answer in the "Essential Revisions point 1" corresponding to this reviewer's concern. To summarize, we have now added whole posterior midgut images in the different conditions to highlight the intestinal morphology (Figure 1-figure supplement 1A). The whole gut morphology was not affected by the different challenges we performed. Indeed, we used low doses of spores and/or toxins in order to mimic "natural" amounts of spores/toxins the fly can eat in the environment and in order to avoid drastic gut lining disturbances.
We have also added the cell type ratio in figure 1- figure supplement 2.
- Figure 4: Is it possible that Arm staining is less intense between ISC and progenitors after ingestion of the bacteria due to the fact there is a high rate of stem cell proliferation? Could it be an indirect effect of stem cell proliferation rather than the binding of the toxins to Cadherins?
We thank the reviewer for this pertinent comment. Indeed, for this reason, we compared the intensity of Arm expression at the junction between neighboring progenitors with the Arm intensity around the rest of the cellular membranes and calculated the ratio between both values (see Figure 4-figure supplement 1F-G for an illustration of how we proceeded and the new section in the Material and Methods 736-742). Using this method, even if the whole Arm staining intensity is different (in all the midgut), the ratio reflects the internal cell-cell interaction changes between the two neighboring cells. Moreover, we have observed that Arm staining (using the usual monoclonal antibody N2 7A1 from the DSHB) was very variable from one midgut to another in the same feeding/intoxication condition. So, we do not want to draw conclusion about the whole Arm intensity due to this variability whatever are the intoxication conditions. Finally, the challenged guts always displayed a more disorganized epithelium due to cell proliferation and differentiation. Consequently, Arm staining in ECs and progenitor cells are found in the same focal plane while in unchallenged and well-organized guts, Arm staining in ECs is above the focal plane of Arm staining in progenitor cells. This likely leads to the impression that Arm staining is more intense in challenged midguts. This method description is now added in the Material and methods section (lines 736-742).
Could the authors use the ReDDM system to distinguish between "old" and newly formed cells? This could be a good control to make sure that the signal is quantified in similar cells between the control and the different conditions.
We have analyzed intensity of Arm expression between pairs of GFP cells. Most of these pairs arose from de novo divisions. Indeed, as shown in control conditions (water) with Dl-ReDDM (for example see figure 1-figure supplement 1D), pairs of GFP cells (ISC-ISC) are rare. Most pairs correspond to ISC-EB or ISC-EEP pairs with the progenitor marked by the RFP, meaning that it just arises from the GFP+ mother ISC. Therefore we assume, that in the esg>GFP genotype, pairs of GFP+ cells correspond to one ISC and one progenitor (see Figure 4 – figure supplement 1A-A'). Therefore, when we analyzed the Arm intensity between pairs of GFP cells after intoxication, these cells are very likely "newborn" cells. Even if we suppose there are ISCs and progenitors that remain stuck together for a long time (for instance several days), Cry1A toxins can also be able to disrupt their cell junction. In the context of Cry1A toxin activity, it seems important to analyze the whole impact on cell-cell junctions without discriminating old and new cell-cell interactions.
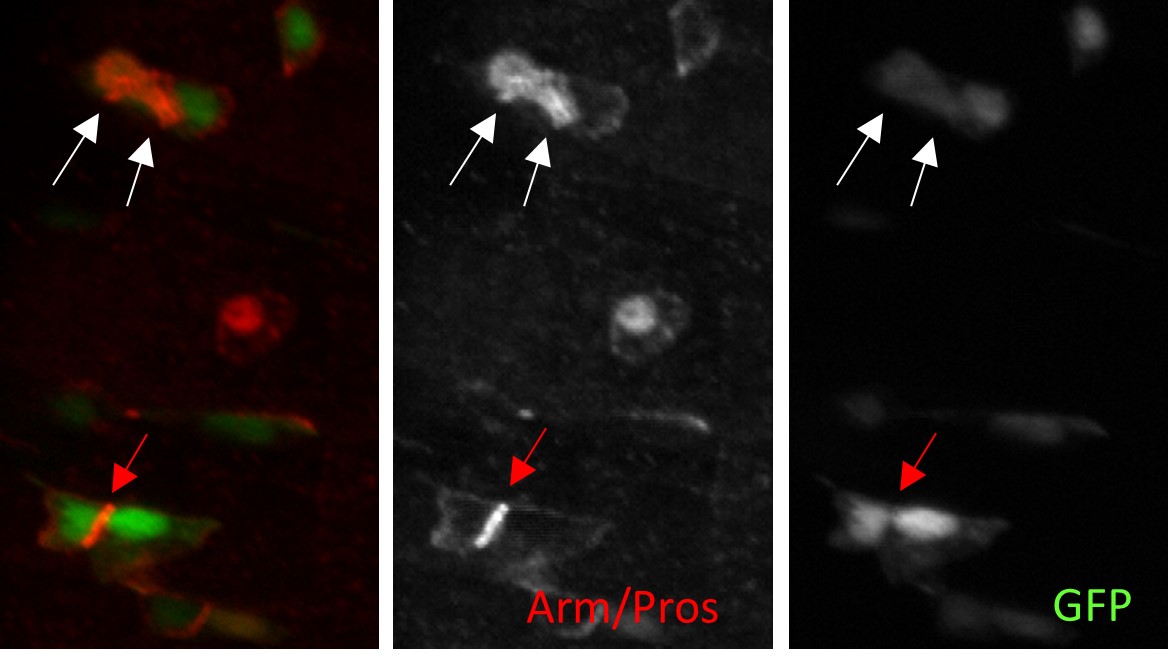
We tried to use anti-Arm and anti-Pros double staining to mark new EEPs. Unfortunately, anti-Arm and anti-Prospero antibodies were both raised in mice. Co-staining with both antibodies give rise to bad labelling either for Arm or for Prospero or for both. Our first author spent lot of energy trying to set up good conditions but unfortunately this was unsuccessful.
Here is an example of what we got (this was the best image we got) with esg>GFP flies fed with water (control) and labelled for Arm and Pros in red. White arrows point two EEPs. Red arrows points the Arm staining between two precursors (ISC/ISC or ISC/EB or EB/EB). It was extremely hard to identify junctions marked by Arm between EEPs and ISCs because the Pros staining was too strong.
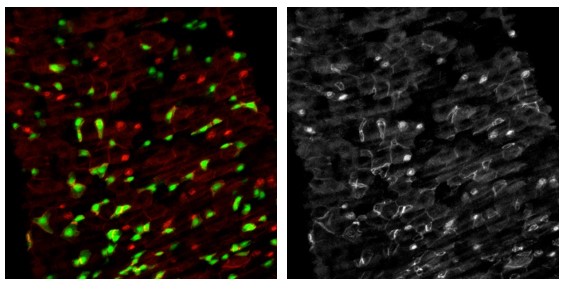
Another example with flies fed with spores of SA11 (increasing the number of EEs). In green is the esg>GFP and in Red Arm and Prospero. The right panel correspond to the single red channel (Arm/Prospero).
Nevertheless, we have now performed a similar analysis in an esg>GFP, Shg::RFP background and analyzed Shg::RFP (Tomato::DE-Cadherin) labelling intensity. We found similar results that are presented in the new Figure 4 (data we Arm have been moved in Figure 4-figure supplement 1). This last analysis have been included in the text lines 285-299.
Figure 4E' and 4G': Arm staining seems more intense when looking at the whole membrane levels of cells compared to control. Is it possible that the measured ratio contact intensity/membrane intensity presented in Figure 4I could be impacted and not reflect the real contact intensity between ISC and progenitor cells?
Please check our answer just above: "…//… we have observed that Arm staining (using the usual monoclonal antibody N2 7A1 from the DSHB) was very variable from one midgut to another in the same feeding/intoxication condition. So, we do not want to draw conclusion about the whole Arm intensity due to this variability whatever are the intoxication conditions".
See also our intensity measurement method described above to avoid bias: "…//… we compared the intensity of Arm expression at the junction between neighboring progenitors with the Arm intensity around the rest of the cellular membranes and calculated the ratio between both values (see Figure 4-figure supplement 1F-G for an illustration of how we proceeded and the new section in the Material and Methods 736-742). Using this method, even if the whole Arm staining intensity is different (in all the midgut), the ratio reflects the internal cell-cell interaction changes between the two neighboring cells."
What is the hypothesis of the authors about the decrease of Arm or DE-Cad seen after bacterial/crystal ingestion? Does the interaction between the toxins and DE-Cad induce a relocation of DE-Cad?
It has been shown that E-Cadherin could be recycled when adherens junctions are destabilized both in Drosophila and mammals(Buchon et al., 2010; O'Keefe et al., 2007; Tiwari et al., 2018). To investigate this possibility, we tried to analyze DE-Cad cytoplasmic relocalization using anti-DE-Cad immunostaining (DCAD2 antibody from DSHB) as well as Shg::RFP (Bloomington stock #58789) or Shg::GFP (Bloomington stock #60584) endogenous fusion. Unfortunately, we did not see obvious differences. Nevertheless, we have now added the split channels of the Shg::RFP labelling in the different conditions in Figure 4A-D'. Nevertheless, we are still interested in the behavior of the DE-cadherin (and signaling, see (Liang et al., 2017)) upon binding of the Cry1A toxin. N. Zucchini-Pascal (author in this article) are currently investigating this question.
The authors should add more details about the way to quantify in the Material and methods section. How many cells have been quantified per intestine? How did they choose the cells where they quantified the contact intensity?..etc
These details were missing in the methods and we thank the reviewer for highlighting this issue. We added these information to the methods (lines 725-742). The number of cell pairs analyzed was present in the raw data related to figure 4 but absent from the main figure and legend. It is now rectified. We only measured the intensity in isolated pairs of cells.
Figure 4B, D, F and H: How did the authors recognize the ISCs?
We agree with the reviewer comment. We cannot recognize ICS per se. Green cells correspond either to ISCs or to EBs. We modified the text accordingly (lines 285-287).
Could the authors do quantifications of DE-Cad signal?
This has been done. It is shown now in figure 4E and in Table 1. We also adapted the text (lines 289-299) to fine-tune our interpretation in light of this new analysis. Indeed, what we have now defined as "mild" adherens junction intensity is between the ratio 1.4 and 1.6 instead of the previous ratio (1.3 to 1.6), because we observed most of the EEP progenitors arising from cell displaying a junction intensity with their mother cells below the 1.4 ratio (see Table 1).
Like Arm staining, the staining seems stronger at the whole membrane level in F and H compared to the control.
As we described above for Arm staining, the intensity of Tomato::DE-Cad labelling can differ from one posterior midgut to another one. One simple explanation would be related to changes in the structure of midgut epithelium which is well organized in unchallenged conditions, while in challenged midguts the epithelial cells are not well-arranged anymore due to rapid cell proliferation and differentiation. Consequently, DE-Cad labelling in ECs is at the same level as that in ISC/progenitors cells, giving the impression that the labelling is stronger.
- Figure 5: How is the stem cell proliferation upon overexpression of DE-Cad in control or upon bacteria/crystals ingestion? Do the authors think that the decrease of Pros+RFP+ new cells upon overexpression of DE-Cad could result from a decrease of stem cell proliferation?
Great suggestion. Thereby, we chose to count the progenitor cells (GFP+ cells) reflecting the ISC division during the last 3 days. Moreover, this also has the advantage of working on the same pictures (samples) used for all the analyzes shown in figure 5 and Figure 5-figure supplement 1. Hence, If we consider the number of GFP+ cells (esg expressing cells corresponding to ISC, EB or EEP) in challenged midguts, the overexpression of the DE-Cad did not seem to alter ISC division. In addition, we still observed more GFP+ cells when the midguts were challenged with SA11 or crystals than with BtkCry, in agreement with the rate of ISC division observed in the WT genetic background shown in figure 1B.
We have now added the counting of GFP+ cells in Figure 5-figure supplement 1E. The text has been modified to integrate this results (lines 306-308).
Did the authors quantify the % of new ECs in the context of overexpression of DE-Cad?
The data has been added in figure 5F. The text has been modified to integrate this result lines 312-313.
Figure 5F: As asked before, did the authors distinguish the signal between newly born cells and the signal between older cells?
In the new figure 5G: we used the esg-ReDDM system that is very efficient. Almost all ISC and progenitors express the GFP. The counting have been done between cell pairs that express both the GFP and RFP. It is specified in the text lines 310-311. Nevertheless, we cannot distinguish between new and old cells here. Indeed, the esg-ReDDM system induce both the GFP and the RFP in all esg+ cells (the old ones and the new ones). Hence, if a division has occurred just before the induction of the system to give birth for instance to an ISC and an EB, both cells will express the GFP and the RFP. But should we consider those pairs of cells as old cells or new cells? Noteworthy, as we analyzed the intensity of junctions 3 days after intoxication and induction of the ReDDM system, we assume that the pairs of GFP+/RFP+ cells arose after the induction of the system. Indeed, to our knowledge, nobody has shown in the posterior midgut, that a progenitor remains stuck to its mother ISC as long as 3 days. Even if we assume that this event can occur, Cry1A toxins can also be able to disrupt their cell junction.
We now have removed the DAPI channel and added the RFP+ channel in Figure 5-figure supplement 1A-D' (previously the Figure S4A-D) to illustrate this explanation and to facilitate the interpretation by the reader.
It would be interesting to compare the junction intensity between mother ISCs and their daughter progenitors before and after intoxication in a same intestine. But we think that this event is quite rare because of the experimental conditions we used (i.e. analyses 3 days after the induction of the ReDDM/intoxication).
The same experiments (stem cell proliferation + quantification of the % of new ECs) could be also done when authors overexpress of the Connectin, supplemental figure 5. This would be another control to conclude that the effects on cell differentiation are specific due to the interaction between DE-Cad and the toxins.
We have added the analyses in Figure 5 - figure supplement 2J and K.
The text has been completed lines 317-320.
In the "crystals" condition, the overexpression of Connection seems to partially rescue the increase % of new Pros+RFP+ new cells observed in Figure 3F (Figure S5I compared to Figure 3F).
Yes, we agree with the reviewer comment. In an esg-ReDDM background (figure 3F), crystals induced a much greater increase in EE numbers than did SA11 spores. However, in a WT or esg>GFP background, crystals induced a similar increase in EE/EEP to that induced by SA11 spores. So we do not yet have explanation excepted the genetic background of the esg-ReDDM.
-
eLife assessment
Jneid et al find that an entomopathogenic strain of B. thuringiensis and its Cry1A toxins, which are widely used to combat lepidopteran pests, disrupt intestinal epithelial homeostasis in Drosophila-an insect that is generally considered non-suceptible. They demonstrate that the Cry1A toxins act by altering E-cadherin-based adhesion between intestinal stem cells and their new progeny. The findings carry potential implications for unintended, broad effects of B. thuringiensis in agricultural settings.
-
Reviewer #1 (Public Review):
This work sheds light on the adverse effects of Bacillus thuringiensis, a strong pathogenic bacteria used as a microbial pesticide to kill lepidopteran larvae that threaten crops, on gut homeostasis of non-susceptible organisms. By using the Drosophila melanogaster as a non-susceptible organism model, this paper reveals the mechanisms by which the bacteria disrupt gut homeostasis. Authors combined the use of different genetic tools and Western blot experiments to successfully demonstrate that bacterial protoxins are released and activated throughout the fly gut after ingestion and influence intestinal stem cell proliferation and intestinal cell differentiation. This phenomenon relies on the interaction of activated protoxins with specific components of adherens junctions within the intestinal epithelium. Due …
Reviewer #1 (Public Review):
This work sheds light on the adverse effects of Bacillus thuringiensis, a strong pathogenic bacteria used as a microbial pesticide to kill lepidopteran larvae that threaten crops, on gut homeostasis of non-susceptible organisms. By using the Drosophila melanogaster as a non-susceptible organism model, this paper reveals the mechanisms by which the bacteria disrupt gut homeostasis. Authors combined the use of different genetic tools and Western blot experiments to successfully demonstrate that bacterial protoxins are released and activated throughout the fly gut after ingestion and influence intestinal stem cell proliferation and intestinal cell differentiation. This phenomenon relies on the interaction of activated protoxins with specific components of adherens junctions within the intestinal epithelium. Due to conserved mechanisms governing intestinal cell differentiation, this work could be the starting point for further studies in mammals.
The conclusions proposed by the authors are in general well supported by the data. However, some improvements in data representation, as well as additional key control experiments, would be needed to further reinforce some key points of the paper.
Figure 1 and others: Several graphs in the manuscript show the number of cells/20000µm2.
How is the shape of the gut in the different conditions studied in this manuscript?
The gut shape (shrunk gut versus normal gut for example) could influence the number of cells seen in a small area. For example, the number of total cells quantified in a small area (here 20000µm2) of a shrunk gut can be increased while their size decrease. As a result, the quantification of a specific cell type in a small region (here 20000µm2) can be biased and not represent the real number of cells present in the whole posterior part of the R4 region. Would it make sense to calculate a ratio "number of X cells/number of DAPI positive cells per 20000µm2"?Figure 4: Is it possible that Arm staining is less intense between ISC and progenitors after ingestion of the bacteria due to the fact there is a high rate of stem cell proliferation? Could it be an indirect effect of stem cell proliferation rather than the binding of the toxins to Cadherins?
Could the authors use the ReDDM system to distinguish between "old" and newly formed cells? This could be a good control to make sure that the signal is quantified in similar cells between the control and the different conditions.
Figure 4E' and 4G': Arm staining seems more intense when looking at the whole membrane levels of cells compared to control. Is it possible that the measured ratio contact intensity/membrane intensity presented in Figure 4I could be impacted and not reflect the real contact intensity between ISC and progenitor cells?
What is the hypothesis of the authors about the decrease of Arm or DE-Cad seen after bacterial/crystal ingestion? Does the interaction between the toxins and DE-Cad induce a relocation of DE-Cad?The authors should add more details about the way to quantify in the Material and methods section. How many cells have been quantified per intestine? How did they choose the cells where they quantified the contact intensity?..etc
Figure 4B, D, F and H: How did the authors recognize the ISCs? Could the authors do quantifications of DE-Cad signal? Like Arm staining, the staining seems stronger at the whole membrane level in F and H compared to the control.
- Figure 5: How is the stem cell proliferation upon overexpression of DE-Cad in control or upon bacteria/crystals ingestion? Do the authors think that the decrease of Pros+RFP+ new cells upon overexpression of DE-Cad could result from a decrease of stem cell proliferation?
Did the authors quantify the % of new ECs in the context of overexpression of DE-Cad?
Figure 5F: As asked before, did the authors distinguish the signal between newly born cells and the signal between older cells?
The same experiments (stem cell proliferation + quantification of the % of new ECs) could be also done when authors overexpress of the Connectin, supplemental figure 5. This would be another control to conclude that the effects on cell differentiation are specific due to the interaction between DE-Cad and the toxins.
In the "crystals" condition, the overexpression of Connection seems to partially rescue the increase % of new Pros+RFP+ new cells observed in Figure 3F (Figure S5I compared to Figure 3F).
-
Reviewer #2 (Public Review):
The authors have used well-characterized Drosophila intestinal epithelium as a model to investigate the potentially harmful effect of Btk Cry toxins on organisms that are not susceptible to the toxins. The experiments are well-designed, precisely performed, and appropriately assessed. Therefore, the presented results are in support of the authors' claims and conclusions. Additionally, the manuscript is written well to convey the message to a wide audience.
-
Reviewer #3 (Public Review):
The described work is about assessing Drosophila midgut histopathology upon consumption of an entomopathogenic strain of B. thuringiensis and its Cry1A toxins, which are lethal to lepidoptera, but non-lethal to Drosophila. Thus, Drosophila is characterized a non-susceptible organism. The authors tested if this "non-susceptible host" is nevertheless histopathologically susceptible. They convincingly show that it is, because the mechanism of action of the Cry1A toxins on progenitor cell E-Cadherin is functionally (but not biochemically) revealed in flies and in Drosophila S2 cells.
Strengths: The thorough cell fate analysis based on reporter genes and the alternative methods tested e.g. the wild type vs. mutant bacterial strains and purified active and inactive versions of Cry toxins.
Weakness: The heavy …
Reviewer #3 (Public Review):
The described work is about assessing Drosophila midgut histopathology upon consumption of an entomopathogenic strain of B. thuringiensis and its Cry1A toxins, which are lethal to lepidoptera, but non-lethal to Drosophila. Thus, Drosophila is characterized a non-susceptible organism. The authors tested if this "non-susceptible host" is nevertheless histopathologically susceptible. They convincingly show that it is, because the mechanism of action of the Cry1A toxins on progenitor cell E-Cadherin is functionally (but not biochemically) revealed in flies and in Drosophila S2 cells.
Strengths: The thorough cell fate analysis based on reporter genes and the alternative methods tested e.g. the wild type vs. mutant bacterial strains and purified active and inactive versions of Cry toxins.
Weakness: The heavy reliance on reporter transgenes, instead of staining of endogenous proteins and the lack of clonal analysis. Despite this the main conclusions are sufficiently supported.
-
