Recurrent network interactions explain tectal response variability and experience-dependent behavior
Curation statements for this article:-
Curated by eLife

eLife assessment
This manuscript uses large-scale neural imaging and network models to show how spontaneous dynamics emerge in such ensembles and how such activity influences behavior. It is a strong addition to the field for explaining many of the observed neural activity patterns and their heterogeneities.
This article has been Reviewed by the following groups
Discuss this preprint
Start a discussion What are Sciety discussions?Listed in
- Evaluated articles (eLife)
Abstract
Response variability is an essential and universal feature of sensory processing and behavior. It arises from fluctuations in the internal state of the brain, which modulate how sensory information is represented and transformed to guide behavioral actions. In part, brain state is shaped by recent network activity, fed back through recurrent connections to modulate neuronal excitability. However, the degree to which these interactions influence response variability and the spatial and temporal scales across which they operate, are poorly understood. Here, we combined population recordings and modeling to gain insights into how neuronal activity modulates network state and thereby impacts visually evoked activity and behavior. First, we performed cellular-resolution calcium imaging of the optic tectum to monitor ongoing activity, the pattern of which is both a cause and consequence of changes in network state. We developed a minimal network model incorporating fast, short range, recurrent excitation and long-lasting, activity-dependent suppression that reproduced a hallmark property of tectal activity – intermittent bursting. We next used the model to estimate the excitability state of tectal neurons based on recent activity history and found that this explained a portion of the trial-to-trial variability in visually evoked responses, as well as spatially selective response adaptation. Moreover, these dynamics also predicted behavioral trends such as selective habituation of visually evoked prey-catching. Overall, we demonstrate that a simple recurrent interaction motif can be used to estimate the effect of activity upon the incidental state of a neural network and account for experience-dependent effects on sensory encoding and visually guided behavior.
Article activity feed
-

-

Author Response
Reviewer #2 (Public Review):
Zylbertal and Bianco propose a new model of trial-to-trial neuronal variability that incorporates the spatial distance between neurons. The 7-parameter model is attractive because of its simplicity: A neuron's activity is a function of stimulus drive, neighboring neurons, and global inhibition. A neuroscientist studying almost any brain area in any model organism could make use of this model, provided that they have access to 1) simultaneously-recorded neurons and 2) the spatial locations of those neurons. I could foresee this model being the de-facto model to compare to all future models, as it is easy to code up and interpret. The paper explores the effectiveness of this distance model by modeling neural activity in the zebrafish optic tectum. They find that this distance-based model can …
Author Response
Reviewer #2 (Public Review):
Zylbertal and Bianco propose a new model of trial-to-trial neuronal variability that incorporates the spatial distance between neurons. The 7-parameter model is attractive because of its simplicity: A neuron's activity is a function of stimulus drive, neighboring neurons, and global inhibition. A neuroscientist studying almost any brain area in any model organism could make use of this model, provided that they have access to 1) simultaneously-recorded neurons and 2) the spatial locations of those neurons. I could foresee this model being the de-facto model to compare to all future models, as it is easy to code up and interpret. The paper explores the effectiveness of this distance model by modeling neural activity in the zebrafish optic tectum. They find that this distance-based model can capture 1) bursting found in spontaneous activity, 2) ongoing co-fluctuations during stimulus-evoked activity, and 3) adaptation effects during prey-catching behavior.
Strengths:
The main strength of the paper is the interpretability of the distance-based model. This model is agnostic to the brain area from which the population of neurons is recorded, making the model broadly applicable to many neuroscientists. I would certainly use this model for any baseline comparisons of trial-to-trial variability.
The model is assessed in three different contexts, including spontaneous activity and behavior. That the model provides some prediction in all three contexts is a strong indicator that this model will be useful in other contexts, including other model organisms. The model could reasonably be extended to other cognitive states (e.g., spatial attention) or accounting for other neuron properties (such as feature tuning, as mentioned in the manuscript).
The analyses and intuition to show how the distance-based model explains adaptation were insightful and concise.
We thank the reviewer for these supportive comments.
Weaknesses:
Model evaluation and comparison: The paper does not fully evaluate the model or its assumptions; here, I note details in which evaluation is needed. A key assumption of the model - that correlations fall off in a gaussian manner (Fig. 1C-E - is not supported by Fig. 1C, which appears to have an exponential fall-off. Functions other than gaussian may provide better fits.
A key feature of our model is that connection strengths smoothly decrease with distance. However, we did not intend to make strong claims about the exact function parametrizing this distance relationship. In light of the reviewer’s comment, we have additionally tested an exponential function and find that it too can describe activity correlations in OT with a negligible decrease in r2 (Figure 1 – figure supplement 1A-C). The main purpose of the analysis was to show that the correlation is maximal around the seed and decays uniformly with distance from it (i.e. no sub-networks or cliques are detected). We have emphasized this in a revised conclusion paragraph and note that while multiple functions can be used to parameterize the relationship, they are nonetheless certainly simplifications. Secondly, we also ran a version of the network simulation where the connections decay in space according to an exponential rather than Gaussian function and show that, as expected, tectal bursting is robust to this change.
Furthermore, it is not clear whether the r^2s in Fig. 1E are computed in a held-out manner (more details about what goes into computing r^2 are needed).
These values are computed by fitting the 2-d Gaussian (or exponential function) to all neurons excluding the seed itself (added a short clarification in the Methods).
Assessing the model based on peak location alone (Fig. 1E) is not sufficient, as other smooth monotonically-decreasing functions may perform similarly.
As discussed above, an exponential function indeed performs similarly to a Gaussian. However, goodness of fit is secondary to the main aim of Fig 1E, which is to show that the correlation peak tends to fall near the seed cell.
Simulating from the model greatly improves the reader's understanding (Fig. 2D), but no explanation is given for why the simulations (Fig. 2D) have almost no background spikes and much fewer, non-co-occurring bursts than those of real data (Fig. 2E).
In part this is because the simulation results depicted in Fig 2D were derived from the ‘baseline model’, prior to optimizing to match biological bursting statistics. It is thus expected that activity will differ from experimental observation and was our main motive to tune the model parameters (now emphasized in the text). However, the model will certainly not account for all aspects of tectal activity; rather, it was designed to reproduce bursting as a prominent feature of ongoing activity and in the second part of the paper we explore the extent to which it can account for other phenomena. As noted above, in the revised abstract, introduction and discussion we have tried to clarify the motivation for developing the model and how it was used to gain insight into activity-dependent changes in network excitability.
A key assumption of the distance model (Fig. 2A) is that each neuron has the same gaussian fall-off (i.e., sigma_excitation and sigma_inhibition), but it is unclear if the data support this assumption.
We intentionally opted for a simple model (i.e. described by few parameters), in part due to the lack of connectivity data and additionally to set a lower bound on the extent to which multiple features of tectal activity could be accounted for. More complex models with additional degrees of freedom (such as cell-specific connectivity) may well describe the data better, but likely at the cost of interpretability. We consider such extensions are beyond the scope of the present study but might be fruitful avenues for future research.
Although an excitatory and inhibitory gain is assumed (Fig. 2A), it is not clear from the data (Fig. 1C) that an inhibitory gain is needed (no negative correlations are observed in Fig. 1C-D).
This is now explored in the revised Figure 3A which includes the condition of zero inhibition gain. See also response to reviewer 1.
After optimization (Fig. 3), the model is evaluated on predicting burst properties but not evaluated on predicting held-out responses (R^2s or likelihoods), and no other model (e.g., fitting a GLM or a model with only an excitatory gain) is considered. In particular, one may consider a model in which "assemblies" do exist - does such an assembly model lead to better held-out prediction performance?
The model we developed is a mechanistic, generative model. In contrast to Pillow et al 2008, we did not fit the model to data but rather we used it to simulate network activity and tuned the seven parameters (using EMOO) to best match biological observations. Thus, rather than assessing goodness-of-fit using cross-validation, our approach involved comparison of summary statistics related to the target emergent phenomenon (tectal bursting). This was necessary as bursting appears highly stochastic. Further to the comments above, we have expanded the parameter space to include instances with only an excitatory gain (where bursting failed) and no distance-dependence (again, busting failed). Introducing assemblies into the model will inevitably support bursting (and introduce many more free parameters), but one of our key observations is that such assemblies are not required for this aspect of
spontaneousactivity. Again, our aim was not to produce a detailed picture of tectal connectivity, but rather to develop a minimal model and estimate the extent to which it can account for observed features of activity. Note that the second half of the paper (Figure 4 onwards) shows the model can explain phenomena that were not considered during parameter tuning.It is unclear why a genetic algorithm (Fig. 1A-C) is necessary versus a grid search; it appears that solutions in Generation 2 (Fig. 3C, leftmost plot, points close to the origin) are as good as solutions in Generation 30 and that the spreads of points across generations do not shrink (as one would expect from better mutations). Given the small number of parameters (7), a grid search is reasonable, computationally tractable, and easier to understand for all readers (Fig. 3A).
Perhaps in hindsight a grid search would have worked, but at increased computational cost (each instantiation of the model is computationally expansive). At the time we chose EMOO, and since it produced satisfactory results, we kept it. As often happens with multi-objective optimization, an improvement in one objective usually happens at the expense of other objectives, so the spread of the points does not shrink much but they move closer to the axes (i.e. reduced error). The final parameter combination is closer to the origin than any point in generation 2, though admittedly not by much. Importantly, however, optimizing the model using the training features generalized to other burst-related statistics.
It is unclear why the excitatory and inhibitory gains of the temporal profiles (Fig. 3I) appear to be gaussian but are formulated as exponential (formula for I_ij^X in Methods).
The interactions indeed have exponential decay in time. These might appear Gaussian because the axis scale is logarithmic.
Overall, comparing this model to other possible (similar) models and reporting held-out prediction performance will support the claim that the distance model is a good explanation for trial-to-trial variability.
See comments above. A key point we want to stress is that we intentionally explored a minimal network model and found that, despite obvious simplifications of the biology, it was nonetheless able to explain multiple aspects of tectal physiology and behaviour. We hope that it inspires future studies and can be extended, in parallel to experimental findings, to more accurately represent the cell-type diversity and cell-specific connectivity of the tectal network.
Data results: Data results were clear and straightforward. However, the explanation was not given for certain results. For example, the relationship between pre-stimulus linear drive and delta R was weak; the examples in Fig. 4C do not appear to be representative of the other sessions. The example sessions in Fig. 4C have R^2=0.17 and 0.19, the two outliers in the R^2 histogram (Fig. 4D).
The revised figure 4 is based on new data and new analysis (see below), and the presented examples no longer represent the extreme tail of the distribution (they still, however, represent strong examples, as is now explicitly indicated in the figure legend).
The black trace in Fig. 4D has large variations (e.g., a linear drive of 25 and 30 have a change in delta R of ~0.1 - greater than the overall change of the dashed line at both ends, ~0.08) but the SEMs are very tight. This suggests that either this last fluctuation is real and a major effect of the data (although not present in Fig. 4C) or the SEM is not conservative enough. No null distribution or statistics were computed on the R^2 distribution (Fig. 4C, blue distribution) to confirm the R^2s are statistically significant and not due to random fluctuations.
We agree that this was not sufficiently robust and in response to this comment we undertook a significant revision to figure 4 and the associated text:
i) The revised figure is based on an entirely new dataset, allowing us to verify the results on independent data. We used 5 min ISI for all stimulus presentations, regardless of stimulus type (high or low elevation), thus ensuring that we are only examining differences in state brought about by previous ongoing activity, without risk of ‘contamination’ by evoked activity.
ii) As per the reviewer’s suggestion, we compared model-estimated pre-stimulus state to a
nullestimate using randomly sampled time-points. We additionally compared the optimised model with the baseline model. Whereas the null (random times) estimates had no predictive power, both models using pre-stimulus activity were able to explain a fraction of the response residuals with the optimised model performing better.iii) We refined the binning process by first computing, for each response, the mean of response residuals across neurons for each bin of estimated linear drive, and then averaging across responses. This prevents the relationship being skewed by rare instances involving unusually large numbers of neurons for a particular linear drive bin, and thereby eliminates the fluctuations the reviewer was referring to.
The absence of any background activity in Fig. 6B (e.g., during the rest blocks) is confusing, given that in spontaneous activity many bursts and background activity are present (Fig. 2E).
The raster only presents evoked responses and no background activity is shown. This has been clarified in the revised figure and legend.
Finally, it appears that the anterior optic tectum contributes to convergent saccades (CS) (Fig. 7E) but no post-saccadic activity is shown to assess how activity changes after the saccade (e.g., plotting activity from 0 to 60).
Activity before and after the saccade is shown in Fig 7A. Fig 7E shows the ‘linear drive’ (or ‘excitability’), and how it changes leading up to the saccade. Since we were interested in the association between pre-saccade state and saccade-associated activity, we did not plot post-saccadic linear drive. However, as can be seen in the below figure for the reviewer, linear drive is strongly suppressed by the saccade, as expected due to CS-associated activity.
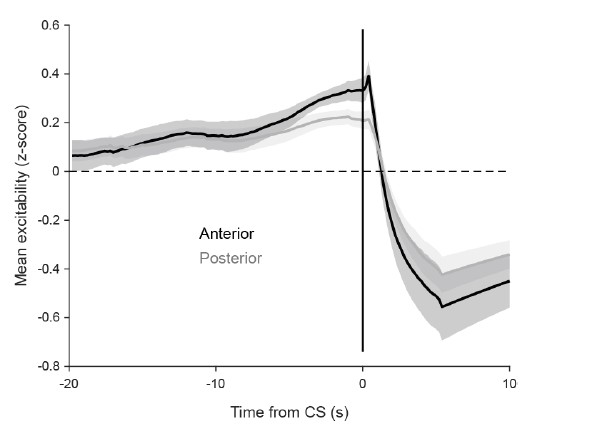
No explanation is given why activity drops ~30 seconds before a convergent saccade (Fig. 7E).
This is no longer shown after we trimmed the history data in Fig 7E in accordance with a comment from reviewer 1. We speculate, however, that the mean linear drive of a compact population of neurons would be somewhat periodical, since a high linear drive leads to a burst which results in a prolonged inhibition (low linear drive) with a slow recovery and so on.
No statistical test is performed on the R^2 distribution (Fig. 7H) to confirm the R^2s (with a mean close to R^2=0.01) are meaningful and not due to random fluctuations.
We revised the analysis in Fig 7 along the same lines as the revision of Fig 4. Model-estimated linear drive predicts CS-associated activity whereas a
nullestimate (random times) shows no such relationship.Presentation: A disjointed part of the paper is that for the first part (Figs. 1-3), the focus is on capturing burst activity, but for the second part (Figs. 4-7), the focus is on trial-to-trial variability with no mention of bursts. It is unclear how the reader should relate the two and if bursts serve a purpose for stimulus-evoked activity.
In the first part of the paper (Figs. 1-3), we use ongoing activity to develop an understanding (formulated as a network model) of how activity modulates the network state. In the second part, we test this understanding in the context of evoked responses and show that model-estimated network state explains a fraction of visual response variability and experience-dependent changes in activity and behaviour. In the revised MS we further emphasize this idea and have edited the results text to strengthen the connections between these parts of the study. See also comments above.
Citations: The manuscript may cite other relevant studies in electrophysiology that have investigated noise correlations, such as:
- Luczak et al., Neuron 2009 (comparing spontaneous and evoked activity).
- Cohen and Kohn, Nat Neuro 2011 (review on noise correlations).
- Smith and Kohn, JNeurosci 2008 (looking at correlations over distance).
- Lin et al., Neuron 2015 (modeling shared variability).
- Goris et al., Nat Neuro 2014 (check out Fig. 4).
- Umakantha et al., Neuron 2021 (links noise correlation and dim reduction; includes other recent references to noise correlations).
We agree that the manuscript could benefit from citing some of these suggested studies and have added citations accordingly.
-
eLife assessment
This manuscript uses large-scale neural imaging and network models to show how spontaneous dynamics emerge in such ensembles and how such activity influences behavior. It is a strong addition to the field for explaining many of the observed neural activity patterns and their heterogeneities.
-
Reviewer #1 (Public Review):
In this paper, the authors first examined how the spontaneous bursts of activity in the optic tectum of zebrafish arise from the excitatory and inhibitory connectivity patterns between tectal neurons. Toward this goal, they recorded spontaneous activity patterns of tectal neurons using large-scale calcium imaging and fitted a simple model to the data to estimate parameters of hypothetical connectivities. They claim that a uniform distribution of fast, short-range excitatory connections and slow, long-range inhibitory connections across tectal populations are sufficient to replicate several aspects of spontaneous burst dynamics.
Based on this finding, the authors further examined the role of model-estimated network states in sensory perceptions and eye convergence behavior for prey capture. Their series of …
Reviewer #1 (Public Review):
In this paper, the authors first examined how the spontaneous bursts of activity in the optic tectum of zebrafish arise from the excitatory and inhibitory connectivity patterns between tectal neurons. Toward this goal, they recorded spontaneous activity patterns of tectal neurons using large-scale calcium imaging and fitted a simple model to the data to estimate parameters of hypothetical connectivities. They claim that a uniform distribution of fast, short-range excitatory connections and slow, long-range inhibitory connections across tectal populations are sufficient to replicate several aspects of spontaneous burst dynamics.
Based on this finding, the authors further examined the role of model-estimated network states in sensory perceptions and eye convergence behavior for prey capture. Their series of experiments show that the proposed slow, long-range inhibitory connections may underlie sensory habituations for spatially specific visual stimuli and resulting eye convergence behavior for prey capture. Their experiments also show that spontaneous dynamics drive spontaneous eye convergence behavior. Based on these results, the authors propose underlying mechanisms of spontaneous activity bursts in the optic tectum and their behavioral significance.
The major strength of the paper is that it found a critical role of inhibitory connectivities between tectal neurons in sensory adaptation and its behavioral consequences based on both statistical modeling and experiments. The model-driven estimation of neural connectivity is rigorous and will likely set the standard for future works in optic tectum research. The major weakness of the paper is its organization of messages in the abstract and the discussion. It would be challenging for readers to understand what is the main take-home message. There are also claims in the discussion that went beyond what their results can support and may result in unnecessary drawbacks from peers in the field. I advise the authors to revise these sections so that the reader can better understand the significance of the paper and how it contributes to the progress in the research field.
The authors' experiments and analyses convincingly support their main claims. Their findings will likely contribute to a better understanding of how excitatory and inhibitory connectivities develop in the optic tectum of zebrafish and how such connectivities play critical roles in sensory perception and behaviors.
This work sits on insights from the recent studies that described the emergence of spontaneous neural assemblies in the optic tectum and the visual habituation behavior of zebrafish. The optic tectum is one of the most studied regions in the zebrafish brain and is an excellent model for understanding these universal neural phenomena observed across animal taxa. I am convinced that the insights from this paper will further stimulate community efforts.
-
Reviewer #2 (Public Review):
Zylbertal and Bianco propose a new model of trial-to-trial neuronal variability that incorporates the spatial distance between neurons. The 7-parameter model is attractive because of its simplicity: A neuron's activity is a function of stimulus drive, neighboring neurons, and global inhibition. A neuroscientist studying almost any brain area in any model organism could make use of this model, provided that they have access to 1) simultaneously-recorded neurons and 2) the spatial locations of those neurons. I could foresee this model being the de-facto model to compare to all future models, as it is easy to code up and interpret. The paper explores the effectiveness of this distance model by modeling neural activity in the zebrafish optic tectum. They find that this distance-based model can capture 1) …
Reviewer #2 (Public Review):
Zylbertal and Bianco propose a new model of trial-to-trial neuronal variability that incorporates the spatial distance between neurons. The 7-parameter model is attractive because of its simplicity: A neuron's activity is a function of stimulus drive, neighboring neurons, and global inhibition. A neuroscientist studying almost any brain area in any model organism could make use of this model, provided that they have access to 1) simultaneously-recorded neurons and 2) the spatial locations of those neurons. I could foresee this model being the de-facto model to compare to all future models, as it is easy to code up and interpret. The paper explores the effectiveness of this distance model by modeling neural activity in the zebrafish optic tectum. They find that this distance-based model can capture 1) bursting found in spontaneous activity, 2) ongoing co-fluctuations during stimulus-evoked activity, and 3) adaptation effects during prey-catching behavior.
Strengths:
The main strength of the paper is the interpretability of the distance-based model. This model is agnostic to the brain area from which the population of neurons is recorded, making the model broadly applicable to many neuroscientists. I would certainly use this model for any baseline comparisons of trial-to-trial variability.
The model is assessed in three different contexts, including spontaneous activity and behavior. That the model provides some prediction in all three contexts is a strong indicator that this model will be useful in other contexts, including other model organisms. The model could reasonably be extended to other cognitive states (e.g., spatial attention) or accounting for other neuron properties (such as feature tuning, as mentioned in the manuscript).
The analyses and intuition to show how the distance-based model explains adaptation were insightful and concise.
Weaknesses:
Model evaluation and comparison: The paper does not fully evaluate the model or its assumptions; here, I note details in which evaluation is needed. A key assumption of the model - that correlations fall off in a gaussian manner (Fig. 1C-E - is not supported by Fig. 1C, which appears to have an exponential fall-off. Functions other than gaussian may provide better fits. Furthermore, it is not clear whether the r^2s in Fig. 1E are computed in a held-out manner (more details about what goes into computing r^2 are needed). Assessing the model based on peak location alone (Fig. 1E) is not sufficient, as other smooth monotonically-decreasing functions may perform similarly. Simulating from the model greatly improves the reader's understanding (Fig. 2D), but no explanation is given for why the simulations (Fig. 2D) have almost no background spikes and much fewer, non-co-occurring bursts than those of real data (Fig. 2E). A key assumption of the distance model (Fig. 2A) is that each neuron has the same gaussian fall-off (i.e., sigma_excitation and sigma_inhibition), but it is unclear if the data support this assumption. Although an excitatory and inhibitory gain is assumed (Fig. 2A), it is not clear from the data (Fig. 1C) that an inhibitory gain is needed (no negative correlations are observed in Fig. 1C-D). After optimization (Fig. 3), the model is evaluated on predicting burst properties but not evaluated on predicting held-out responses (R^2s or likelihoods), and no other model (e.g., fitting a GLM or a model with only an excitatory gain) is considered. In particular, one may consider a model in which "assemblies" do exist - does such an assembly model lead to better held-out prediction performance? It is unclear why a genetic algorithm (Fig. 1A-C) is necessary versus a grid search; it appears that solutions in Generation 2 (Fig. 3C, leftmost plot, points close to the origin) are as good as solutions in Generation 30 and that the spreads of points across generations do not shrink (as one would expect from better mutations). Given the small number of parameters (7), a grid search is reasonable, computationally tractable, and easier to understand for all readers (Fig. 3A). It is unclear why the excitatory and inhibitory gains of the temporal profiles (Fig. 3I) appear to be gaussian but are formulated as exponential (formula for I_ij^X in Methods). Overall, comparing this model to other possible (similar) models and reporting held-out prediction performance will support the claim that the distance model is a good explanation for trial-to-trial variability.
Data results: Data results were clear and straightforward. However, the explanation was not given for certain results. For example, the relationship between pre-stimulus linear drive and delta R was weak; the examples in Fig. 4C do not appear to be representative of the other sessions. The example sessions in Fig. 4C have R^2=0.17 and 0.19, the two outliers in the R^2 histogram (Fig. 4D). The black trace in Fig. 4D has large variations (e.g., a linear drive of 25 and 30 have a change in delta R of ~0.1 - greater than the overall change of the dashed line at both ends, ~0.08) but the SEMs are very tight. This suggests that either this last fluctuation is real and a major effect of the data (although not present in Fig. 4C) or the SEM is not conservative enough. No null distribution or statistics were computed on the R^2 distribution (Fig. 4C, blue distribution) to confirm the R^2s are statistically significant and not due to random fluctuations. The absence of any background activity in Fig. 6B (e.g., during the rest blocks) is confusing, given that in spontaneous activity many bursts and background activity are present (Fig. 2E). Finally, it appears that the anterior optic tectum contributes to convergent saccades (CS) (Fig. 7E) but no post-saccadic activity is shown to assess how activity changes after the saccade (e.g., plotting activity from 0 to 60). No explanation is given why activity drops ~30 seconds before a convergent saccade (Fig. 7E). No statistical test is performed on the R^2 distribution (Fig. 7H) to confirm the R^2s (with a mean close to R^2=0.01) are meaningful and not due to random fluctuations.
Presentation: A disjointed part of the paper is that for the first part (Figs. 1-3), the focus is on capturing burst activity, but for the second part (Figs. 4-7), the focus is on trial-to-trial variability with no mention of bursts. It is unclear how the reader should relate the two and if bursts serve a purpose for stimulus-evoked activity.
Citations: The manuscript may cite other relevant studies in electrophysiology that have investigated noise correlations, such as:
- Luczak et al., Neuron 2009 (comparing spontaneous and evoked activity).
- Cohen and Kohn, Nat Neuro 2011 (review on noise correlations).
- Smith and Kohn, JNeurosci 2008 (looking at correlations over distance).
- Lin et al., Neuron 2015 (modeling shared variability).
- Goris et al., Nat Neuro 2014 (check out Fig. 4).
- Umakantha et al., Neuron 2021 (links noise correlation and dim reduction; includes other recent references to noise correlations). -
