Community diversity is associated with intra-species genetic diversity and gene loss in the human gut microbiome
Curation statements for this article:-
Curated by eLife

eLife assessment
The authors re-analyzed a previously published dataset and identify patterns suggestive of increased bacterial biodiversity in the gut may creating new niches that lead to gene loss in a focal species and promote generation of more diversity. Two limitations are (i) that sequencing depth may not be sufficient to analyze strain-level diversity and (ii) that the evidence is exclusively based on correlations, and the observed patterns could also be explained by other eco-evolutionary processes. The claims should be supported by a more detailed analysis, and alternative hypotheses that the results do not fully exclude should be discussed. Understanding drivers of diversity in natural microbial communities is an important question that is of central interest to biomedically oriented microbiome scientists, microbial ecologists and evolutionary biologists.
This article has been Reviewed by the following groups
Discuss this preprint
Start a discussion What are Sciety discussions?Listed in
- Evaluated articles (eLife)
Abstract
The human gut microbiome contains a diversity of microbial species that varies in composition over time and across individuals. These species (and strains within species) can migrate across hosts and evolve by mutation and recombination within hosts. How the ecological process of community assembly interacts with intra-species diversity and evolutionary change is a longstanding question. Two contrasting hypotheses have been proposed based on ecological observations and theory: Diversity Begets Diversity (DBD), in which taxa tend to become more diverse in already diverse communities, and Ecological Controls (EC), in which higher community diversity impedes diversification within taxa. Previously, using 16S rRNA gene amplicon data across a range of environments, we showed a generally positive relationship between taxa diversity and community diversity at higher taxonomic levels, consistent with the predictions of DBD (Madi et al., 2020). However, this positive 'diversity slope' reaches a plateau at high levels of community diversity. Here we show that this general pattern holds at much finer genetic resolution, by analyzing intra-species strain and nucleotide variation in static and temporally sampled shotgun-sequenced fecal metagenomes from cohorts of healthy human hosts. We find that both intra-species polymorphism and strain number are positively correlated with community Shannon diversity. This trend is consistent with DBD, although we cannot exclude abiotic drivers of diversity. Shannon diversity is also predictive of increases in polymorphism over time scales up to ~4-6 months, after which the diversity slope flattens and then becomes negative-consistent with DBD eventually giving way to EC. Also supporting a complex mixture of DBD and EC, the number of strains per focal species is positively associated with Shannon diversity but negatively associated with richness. Finally, we show that higher community diversity predicts gene loss in a focal species at a future time point. This observation is broadly consistent with the Black Queen Hypothesis, which posits that genes with functions provided by the community are less likely to be retained in a focal species' genome. Together, our results show that a mixture of DBD, EC, and Black Queen may operate simultaneously in the human gut microbiome, adding to a growing body of evidence that these eco-evolutionary processes are key drivers of biodiversity and ecosystem function.
Article activity feed
-

-

Author Response
Public Evaluation Summary:
The authors re-analyzed a previously published dataset and identify patterns suggestive of increased bacterial biodiversity in the gut may creating new niches that lead to gene loss in a focal species and promote generation of more diversity. Two limitations are (i) that sequencing depth may not be sufficient to analyze strain-level diversity and (ii) that the evidence is exclusively based on correlations, and the observed patterns could also be explained by other eco-evolutionary processes. The claims should be supported by a more detailed analysis, and alternative hypotheses that the results do not fully exclude should be discussed. Understanding drivers of diversity in natural microbial communities is an important question that is of central interest to biomedically oriented microbiome …
Author Response
Public Evaluation Summary:
The authors re-analyzed a previously published dataset and identify patterns suggestive of increased bacterial biodiversity in the gut may creating new niches that lead to gene loss in a focal species and promote generation of more diversity. Two limitations are (i) that sequencing depth may not be sufficient to analyze strain-level diversity and (ii) that the evidence is exclusively based on correlations, and the observed patterns could also be explained by other eco-evolutionary processes. The claims should be supported by a more detailed analysis, and alternative hypotheses that the results do not fully exclude should be discussed. Understanding drivers of diversity in natural microbial communities is an important question that is of central interest to biomedically oriented microbiome scientists, microbial ecologists and evolutionary biologists.
We agree that understanding the drivers of diversity in natural communities is an important and challenging question to address. We believe that our analysis of metagenomes from the gut microbiomes is complementary to controlled laboratory experiments and modeling studies. While these other studies are better able to establish causal relationships, we rely on correlations – a caveat which we make clear, and offer different mechanistic explanations for the patterns we observe.
We also mention the caveat that we are only able to measure sub-species genetic diversity in relatively abundant species with high sequencing depth in metagenomes. These relatively abundant species include dozens of species in two metagenomic datasets, and we see no reason why they would not generalize to other members of the microbiome. Nonetheless, further work will be required to extend our results to rarer species.
Our revised manuscript includes two major new analyses. First, we extend the analysis of within-species nucleotide diversity to non-synonymous sites, with generally similar results. This suggests that evolutionarily older, less selectively constrained synonymous mutations and more recent non-synonymous mutations that affect protein structure both track similarly with measures of community diversity – with some subtle differences described in the manuscript.
Second, we extend our analysis of dense time series data from one individual stool donor and one deeply covered species (B. vulgatus) to four donors and 15 species. This allowed us to reinforce the pattern of gene loss in more diverse communities with greater statistical support. Our correlational results are broadly consistent with the predictions of DBD from modeling and experimental studies, and they open up new lines of inquiry for microbiome scientists, ecologists, and evolutionary biologists.
Reviewer #1 (Public Review):
This paper makes an important contribution to the current debate on whether the diversity of a microbial community has a positive or negative effect on its own diversity at a later time point. In my view, the main contribution is linking the diversity-begets-diversity patterns, already observed by the same authors and others, to genomic signatures of gene loss that would be expected from the Black Queen Hypothesis, establishing an eco-evolutionary link. In addition, they test this hypothesis at a more fine-grained scale (strain-level variation and SNP) and do so in human microbiome data, which adds relevance from the biomedical standpoint. The paper is a well-written and rigorous analysis using state-of-the-art methods, and the results suggest multiple new experiments and testable hypotheses (see below), which is a very valuable contribution.
We thank the reviewer for their generous comments.
That being said, I do have some concerns that I believe should be addressed. First of all, I am wondering whether gene loss could also occur because of environmental selection that is independent of other organisms or the diversity of the community. An alternative hypothesis to the Black Queen is that there might have been a migration of new species from outside and then loss of genes could have occurred because of the nature of the abiotic environment in the new host, without relationship to the community diversity. Telling the difference between these two hypotheses is hard and would require extensive additional experiments, which I don't think is necessary. But I do think the authors should acknowledge and discuss this alternative possibility and adjust the wording of their claims accordingly.
We concur with the reviewer that the drivers of the correlation between community diversity and gene loss are unclear. Therefore, we have now added the following text to the Discussion:
“Here we report that genome reduction in the gut is higher in more diverse gut communities. This could be due to de novo gene loss, preferential establishment of migrant strains encoding fewer genes, or a combination of the two. The mechanisms underlying this correlation remain unclear and could be due to biotic interactions – including metabolic cross-feeding as posited by some models (Estrela et al., 2022; San Roman and Wagner, 2021, 2018) but not others (Good and Rosenfeld, 2022) – or due to unknown abiotic drivers of both community diversity and gene loss.”
Additionally, we have revised Figure 1 to show that strain invasions/replacements, in addition to evolutionary change, could be an important driver of changes in intra-species diversity in the microbiome.
Another issue is that gene loss is happening in some of the most abundant species in the gut. Under Black Queen though, we would expect these species to be most likely "donors" in cross-feeding interactions. Authors should also discuss the implications, limitations, and possible alternative hypotheses of this result, which I think also stimulates future work and experiments.
We thank the reviewer for raising this point. It is unclear to us whether the more abundant species would be donors in cross-feeding interactions. If we understand correctly, the reviewer is suggesting that more abundant donors will contribute more total biomass of shared metabolites to the community. This idea makes sense under the assumption that the abundant species are involved in cross-feeding interactions in the first place, which may or may not be the case. As our work heavily relies on a dataset that we previously analyzed (HMP), we wish to cite Figure S20 in Garud, Good et al. 2019 PLoS Biology in which we found there are comparable rates of gene changes across the ~30 most abundant species analyzed in the HMP. This suggests that among the most abundant species analyzed, there is no relationship between their abundance and gene change rate.
That being said, we acknowledge that our study is limited to the relatively abundant focal species and state now in the Discussion: “Deeper or more targeted sequencing may permit us to determine whether the same patterns hold for rarer members of the microbiome.”
Regarding Figure 5B, there is a couple of questions I believe the authors should clarify. First, How is it possible that many species have close to 0 pathways? Second, besides the overall negative correlation, the data shows some very conspicuous regularities, e.g. many different "lines" of points with identical linear negative slope but different intercept. My guess is that this is due to some constraints in the pathway detection methods, but I struggle to understand it. I think the authors should discuss these patterns more in detail.
We sincerely thank the reviewer for raising this issue, as it prompted us to investigate more deeply the patterns observed at the pathway level. In short, we decided to remove this analysis from the paper because of a number of bioinformatics issues that we realized were contributing to the signal. However, in support of BQH-like mechanisms at play, we do find evidence for gene loss in more diverse communities across multiple species in both the HMP and Poyet datasets. Below we detail our investigation into Figure 5b and how we arrived at the conclusion that is should be removed:
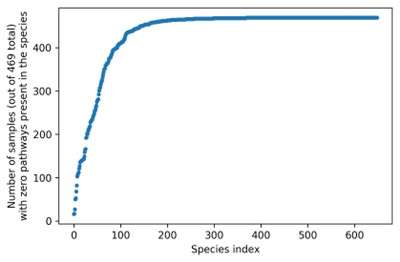
(1) Regarding data points in Figure 5B where many focal species have “zero pathways”,we firstly clarify how we compute pathway presence and richness. Pathway abundance data per species were downloaded from the HMP1-2 database, and these pathway abundances were computed using HUMAnN (HMP Unified Metabolic Analysis Network). According to HUMAnN documentation, pathway abundance is proportional to the number of complete copies of the pathway in the community; this means that if at least one component reaction in a certain pathway is missing coverage (for a sample-species pair), the pathway abundance may be zero (note that HUMAnN also employs “gap filling” to allow no more than one required reaction to have zero abundance). As such, it is likely that insufficient coverage, especially for low-abundance species, causes many pathways to report zero abundance in many species in many samples. Indeed, 556 of the 649 species considered had zero “present” pathways (i.e. having nonzero abundance) in at least 400 of the 469 samples (see figure below).
(2) We thank the reviewer for pointing out the “conspicuous regularities” in Figure 5B,particularly “parallel lines” of data points that we discovered are an artifact of the flawed way in which we computed “community pathway richness [excluding the focal species].” Each diagonal line of points corresponds to different species in the same sample, and because community pathway richness is computed as the total number of pathways [across all species in the sample] minus the number of pathways in the focal species, the current Figure 5B is really plotting y against X-y for each sample (where X is a sample’s total community pathway richness, and y is the pathway richness of an individual species in that sample). This computation fails to account for the possibility that a pathway in an excluded focal species will still be present in the community due to redundancy, and indeed BQH tests for whether this redundancy is kept low in diverse communities due to mechanisms such as gene loss.
We attempted to instead plot community pathway richness defined as the number of unique pathways covered by all species other than the focal species. This is equivalent to [number of unique pathways across all species in a sample] minus the [number of pathways that are ONLY present in the focal species and not any other species in the sample]. However, when we recomputed community pathway richness this way, it is rare that a pathway is present in only one species in a sample. Moreover, we find that with the exception of E. coli, focal species pathway richness tended to be very similar across the 469 samples, often reaching an upper limit of focal species pathway richness observed. (It is unclear to what extent lower pathway richnesses are due to low species abundance/low sample coverage versus gene loss). This new plot reveals even more regularities and is difficult to interpret with respect to BQH. (Note that points are colored by species; the cluster of black dots with outlying high focal pathway richness corresponds to the “unclassified” stratum which can be considered a group of many different species.)
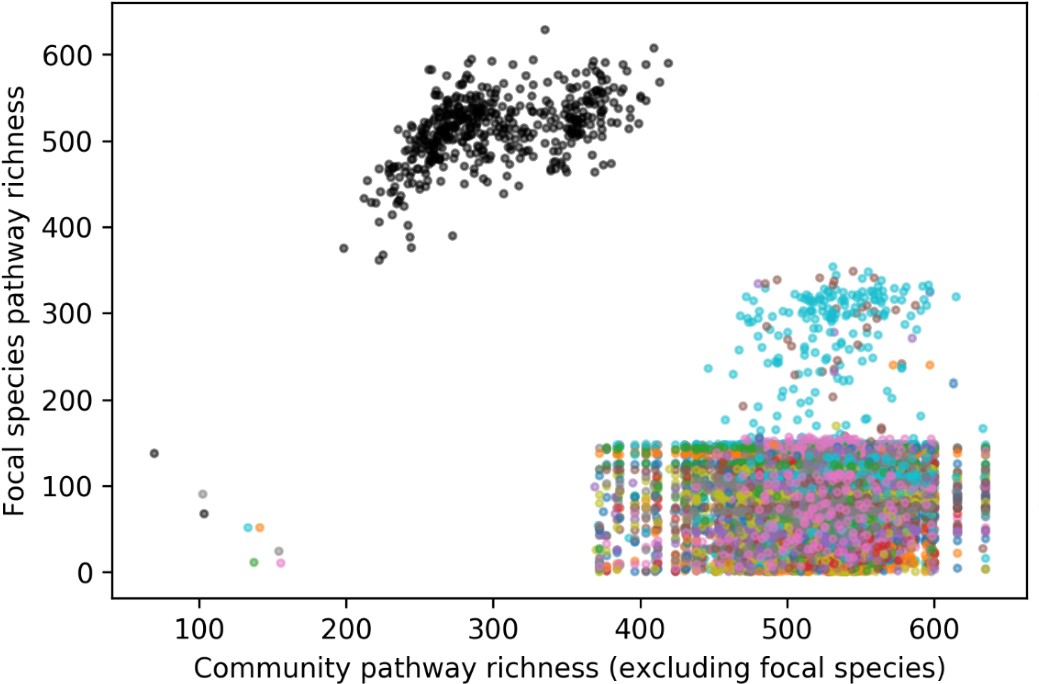
Overall, because community pathway richness (excluding a focal species) seems to primarily vary with sample rather than focal species in this dataset when using the most simple/strict definition of community pathway richness as described above, it is difficult to probe the Black Queen Hypothesis using a plot like Figure 5B. As pointed out by reviewers, lack of sequencing depth to analyze strain-level diversity and accurately quantify pathway abundance, irrespective of species abundance, seems to be a major barrier to this analysis. As such, we have decided to remove Figure 5B from the paper and rewrite some of our conclusions accordingly.
Finally, I also have some conceptual concerns regarding the genomic analysis. Namely, genes can be used for biosynthesis of e.g. building blocks, but also for consumption of nutrients. Under the Black Queen Hypothesis, we would expect the adaptive loss of biosynthetic genes, as those nutrients become provided by the community. However, for catabolic genes or pathways, I would expect the opposite pattern, i.e. the gain of catabolic genes that would allow taking advantage of a more rich environment resulting from a more diverse community (or at least, the absence of pathway loss). These two opposing forces for catabolic and biosynthetic genes/pathways might obscure the trends if all genes are pooled together for the analysis. I believe this can be easily checked with the data the authors already have, and could allow the authors to discuss more in detail the functional implications of the trends they see and possibly even make a stronger case for their claims.
We thank the reviewer for their suggestion. As explained above, we have removed the pathway analysis from the paper due to technical reasons. However, we did investigate catabolic and biosynthetic pathways separately as suggested by the reviewer as we describe below:
We obtained subsets of biosynthetic pathways and catabolic pathways by searching for keywords (such as “degradation” for catabolic) in the MetaCyc pathway database. After excluding the “unclassified” species stratum, we observe a total of 279 biosynthetic and 167 catabolic pathways present in the HMP1-2 pathway abundance dataset. Using the corrected definition of community pathway richness excluding a focal species, for each pathway type—either biosynthetic or catabolic—we plotted focal species pathway richness against community pathway richness including all pathways regardless of type:
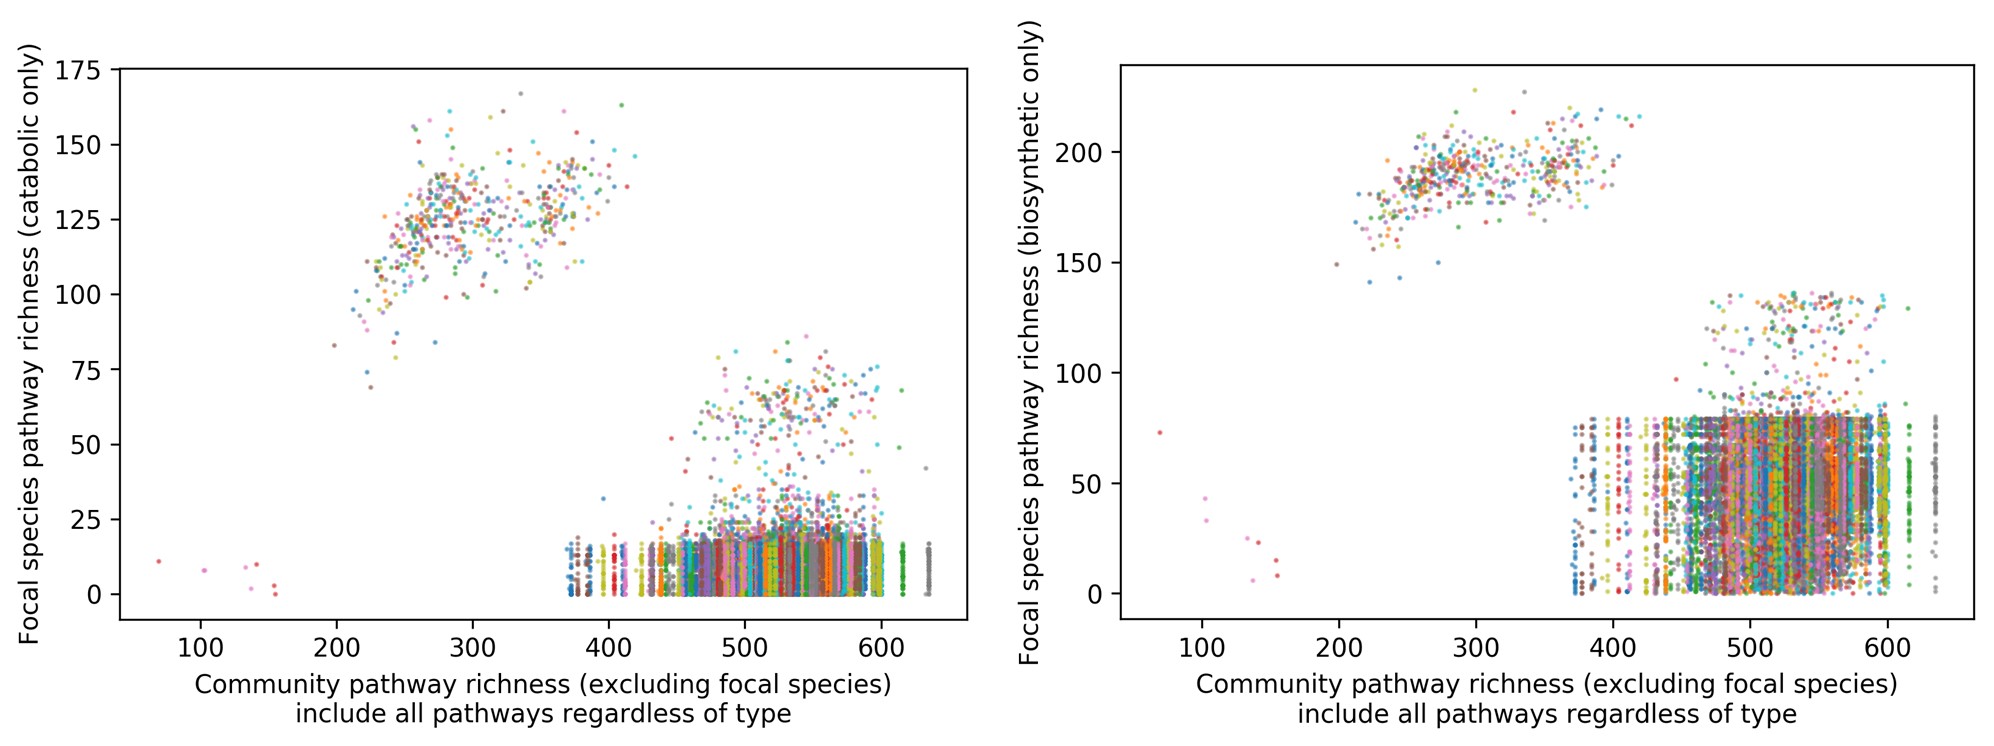
We observe the same problem where, within a sample, community pathway richness excluding the focal species hardly varies no matter which focal species it is, due to nearly all of its detected pathways being present in at least one other species; this makes the plots difficult to interpret.
Reviewer #2 (Public Review):
The authors re-analysed two previously published metagenomic datasets to test how diversity at the community level is associated with diversity at the strain level in the human gut microbiota. The overall idea was to test if the observed patterns would be in agreement with the "diversity begets diversity" (DBD) model, which states that more diversity creates more niches and thereby promotes further increase of diversity (here measured at the strain-level). The authors have previously shown evidence for DBD in microbiomes using a similar approach but focusing on 16S rRNA level diversity (which does not provide strain-level insights) and on microbiomes from diverse environments.
One of the datasets analysed here is a subset of a cross-sectional cohort from the Human Microbiome Project. The other dataset comes from a single individual sampled longitudinally over 18 months. This second dataset allowed the authors to not only assess the links between different levels of diversity at single timepoints, but test if high diversity at a given timepoint is associated with increased strain-level diversity at future timepoints.
Understanding eco-evolutionary dynamics of diversity in natural microbial communities is an important question that remains challenging to address. The paper is well-written and the detailed description of the methodological approaches and statistical analyses is exemplary. Most of the analyses carried out in this study seem to be technically sound.
We thank the reviewer for their kind words, comments, and suggestions.
The major limitation of this study comes with the fact that only correlations are presented, some of which are rather weak, contrast each other, or are based on a small number of data points. In addition, finding that diversity at a given taxonomic rank is associated with diversity within a given taxon is a pattern that can be explained by many different underlying processes, e.g. species-area relationships, nutrient (diet) diversity, stressor diversity, immigration rate, and niche creation by other microbes (i.e. DBD). Without experiments, it remains vague if DBD is the underlying process that acts in these communities based on the observed patterns.
We thank the reviewer for their comments. First, regarding the issue of this being a correlative study, we now more clearly acknowledge that mechanistic studies (perhaps in experimental settings) are required to fully elucidate DBD and BQH dynamics. However, we note that our correlational study from natural communities is complementary to experimental and modeling studies, to test the extent to which their predictions hold in more complex, realistic settings. This is now mentioned throughout the manuscript, most explicitly at the end of the Introduction:
“Although such analyses of natural diversity cannot fully control for unmeasured confounding environmental factors, they are an important complement to controlled experimental and theoretical studies which lack real-world complexity.”
Second, to increase the number of data points analyzed in the Poyet study, we now include 15 species and four different hosts (new Figure 5). The association between community diversity and gene loss is now much more statistically robust, and consistent across the Poyet and HMP time series.
Third, we acknowledge more clearly in the Discussion that other processes, including diet and other environmental factors can generate the DBD pattern. We also now stress more prominently the possibility that strain migration across hosts may be responsible for the patterns observed. For example, in Figure 1, we illustrate the possibility of strain migration generating the patterns we observe.
Below we quote a paragraph that we have now added in the Discussion:
"Second, we cannot establish causal relationships without controlled experiments. We are therefore careful to conclude that positive diversity slopes are consistent with the predictions of DBD, and negative slopes with EC, but unmeasured environmental drivers could be at play. For example, increased dietary diversity could simultaneously select for higher community diversity and also higher intra-species diversity. In our previous study, we found that positive diversity slopes persisted even after controlling for potential abiotic drivers such as pH and temperature (Madi et al., 2020), but a similar analysis was not possible here due to a lack of metadata. Neutral processes can account for several ecological patterns such as species-area relationships (Hubbell, 2001), and must be rejected in favor of niche-centric models like DBD or EC. Using neutral models without DBD or EC, we found generally flat or negative diversity slopes due to sampling processes alone and that positive slopes were hard to explain with a neutral model (Madi et al., 2020). These models were intended mainly for 16S rRNA gene sequence data, but we expect the general conclusions to extend to metagenomic data. Nevertheless, further modeling and experimental work will be required to fully exclude a neutral explanation for the diversity slopes we report in the human gut microbiome.”
Finally, we now put more emphasis on the importance of migration (strain invasion) as a non-exclusive alternative to de novo mutation and gene gain/loss. This is mentioned in the Abstract and is also illustrated in the revised Figure 1.
Another limitation is that the total number of reads (5 mio for the longitudinal dataset and 20 mio for the cross-sectional dataset) is low for assessing strain-level diversity in complex communities such as the human gut microbiota. This is probably the reason why the authors only looked at one species with sufficient coverage in the longitudinal dataset.
Indeed, this is a caveat which means we can only consider sub-species diversity in relatively abundant species. Nevertheless, this allows us to study dozens of species in the HMP and 15 in the more frequent Poyet time series. As more deeply sequenced metagenomes become available, future studies will be able to access the rarer species to test whether the same patterns hold or not. This is now mentioned prominently as a caveat our study in the second Discussion paragraph:
“First, using metagenomic data from human microbiomes allowed us to study genetic diversity, but limited us to considering only relatively abundant species with genomes that were well-covered by short sequence reads. Deeper or more targeted sequencing may permit us to determine whether the same patterns hold for rarer members of the microbiome. However, it is notable that the majority of the dozens of species across the two datasets analyzed support DBD, suggesting that the phenomenon may generalize.”
We also note that rarefaction was only applied to calculate community richness, not to estimate sub-species diversity. We apologize for this confusion, which is now clarified in the Methods as follows:
“SNV and gene content variation within a focal species were ascertained only from the full dataset and not the rarefied dataset.”
Analyzing the effect of diversity at a given timepoint on strain-level diversity at a later timepoint adds an important new dimension to this study which was not assessed in the previous study about the DBD in microbiomes by some of the authors. However, only a single species was analysed in the longitudinal dataset and comparisons of diversity were only done between two consecutive timepoints. This dataset could be further exploited to provide more insights into the prevailing patterns of diversity.
We thank the reviewer for raising this point. We now have considered all 15 species for which there was sufficient coverage from the Poyet dataset, which included four different stool donors. Additionally, in the HMP dataset, we analyze 54 species across 154 hosts, with both datasets showing the same correlation between community diversity and gene loss.
Additionally, we followed the suggestion of the reviewer of examining additional time lags, and in Figure 5 we do observe a dependency on time. This is now described in the Results as follows:
“Using the Poyet dataset, we asked whether community diversity in the gut microbiome at one time point could predict polymorphism change at a future time point by fitting GAMs with the change in polymorphism rate as a function of the interaction between community diversity at the first time point and the number of days between the two time points. Shannon diversity at the earlier time point was correlated with increases in polymorphism (consistent with DBD) up to ~150 days (~4.5 months) into the future (Figure S4), but this relationship became weaker and then inverted (consistent with EC) at longer time lags (Fig 5A, Table S8, GAM, P=0.023, Chi-square test). The diversity slope is approximately flat for time lags between four and six months, which could explain why no significant relationship was found in HMP, where samples were collected every ~6 months. No relationship was observed between community richness and changes in polymorphism (Table S8, GAM, P>0.05).”
Finally, the evidence that gene loss follows increase in diversity is weak, as very few genes were found to be lost between two consecutive timepoints, and the analysis is based on only a single species. Moreover, while positive correlation were found between overall community diversity and gene family diversity in single species, the opposite trend was observed when focusing on pathway diversity. A more detailed analysis (of e.g. the functions of the genes and pathways lost/gained) to explain these seemingly contrasting results and a more critical discussion of the limitations of this study would be desirable.
We agree that our previous analysis of one species in one host provided weak support for gene loss following increases in diversity. As described in the response above, we have now expanded this analysis to 15 focal species and 4 independent hosts with extensive time series. We now analyze this larger dataset and report the more statistically robust results as follows:
“We found that community Shannon diversity predicted future gene loss in a focal species, and this effect became stronger with longer time lags (Fig 5B, Table S9, GLMM, P=0.006, LRT for the effect of the interaction between the initial Shannon diversity and time lag on the number of genes lost). The model predicts that increasing Shannon diversity from its minimum to its maximum would result in the loss of 0.075 genes from a focal species after 250 days. In other words, about one of the 15 focal species considered would be expected to lose a gene in this time frame.
Higher Shannon diversity was also associated with fewer gene gains, and this relationship also became stronger over time (Fig 5C, Table S9, GLMM, P=1.11e-09, LRT). We found a similar relationship between community species richness and gene gains, although the relationship was slightly positive at shorter time lags (Fig 5D, Table S9, GLMM, P=3.41e-04, LRT). No significant relationship was observed between richness and gene loss (Table S9, GLMM, P>0.05). Taken together with the HMP results (Fig 4), these longer time series reveal how the sign of the diversity slope can vary over time and how community diversity is generally predictive of reduced focal species gene content.”
As described in detail in the response to Reviewer 1 above, we found that the HUMAnN2 pathway analyses previously described suffered from technical challenges and we deemed them inconclusive. We have therefore removed the pathway results from the manuscript.
Reviewer #3 (Public Review):
This work provides a series of tests of hypothesis, which are not mutually exclusive, on how genomic diversity is structured within human microbiomes and how community diversity may influence the evolution of a focal species.
Strengths:
The paper leverages on existing metagenomic data to look at many focal species at the same time to test for the importance of broad eco-evolutionary hypothesis, which is a novelty in the field.
Thank you for the succinct summary and recognition of the strengths of our work.
Weaknesses:
It is not very clear if the existing metagenomic data has sufficient power to test these models.
It is not clear, neither in the introduction nor in the analysis what precise mechanisms are expected to lead to DBD.
The conclusion that data support DBD appears to depend on which statistics to measure of community diversity are used. Also, performing a test to reject a null neutral model would have been welcome either in the results or in the discussion.
In our revised manuscript, we emphasize several caveats – including that we only have power to test these hypotheses in focal species with sufficient metagenomic coverage to measure sub-species diversity. We also describe more in the Introduction how the processes of competition and niche construction can lead to DBD. We also acknowledge that unmeasured abiotic drivers of both community diversity and sub-species diversity could also lead to the observed patterns. Throughout the manuscript, we attempt to describe the results and acknowledge multiple possible interpretations, including DBD and EC acting with different strengths on different species and time scales. Our previous manuscript assessing the evidence for DBD using 16S rRNA gene amplicon data from the Earth Microbiome Project (Madi et al., eLife 2020) assessed null models based on neutral ecological theory, and found it difficult to explain the observation of generally positive diversity slopes without invoking a non-neutral mechanism like DBD. While a new null model tailored to metagenomic data might provide additional nuance, we think developing one is beyond the scope of the manuscript – which is in the format of a short ‘Research Advance’ to expand on our previous eLife paper, and we expect that the general results of our previously reported null model provide a reasonable intuition for our new metagenomic analysis. This is now mentioned in the Discussion as follows:
“In our previous study, we found that positive diversity slopes persisted even after controlling for potential abiotic drivers such as pH and temperature (Madi et al., 2020), but a similar analysis was not possible here due to a lack of metadata. Neutral processes can account for several ecological patterns such as species-area relationships (Hubbell, 2001), and must be rejected in favor of niche-centric models like DBD or EC. Using neutral models without DBD or EC, we found generally flat or negative diversity slopes due to sampling processes alone and that positive slopes were hard to explain with a neutral model (Madi et al., 2020). These models were intended mainly for 16S rRNA gene sequence data, but we expect the general conclusions to extend to metagenomic data. Nevertheless, further modeling and experimental work will be required to fully exclude a neutral explanation for the diversity slopes we report in the human gut microbiome.”
-
eLife assessment
The authors re-analyzed a previously published dataset and identify patterns suggestive of increased bacterial biodiversity in the gut may creating new niches that lead to gene loss in a focal species and promote generation of more diversity. Two limitations are (i) that sequencing depth may not be sufficient to analyze strain-level diversity and (ii) that the evidence is exclusively based on correlations, and the observed patterns could also be explained by other eco-evolutionary processes. The claims should be supported by a more detailed analysis, and alternative hypotheses that the results do not fully exclude should be discussed. Understanding drivers of diversity in natural microbial communities is an important question that is of central interest to biomedically oriented microbiome scientists, microbial …
eLife assessment
The authors re-analyzed a previously published dataset and identify patterns suggestive of increased bacterial biodiversity in the gut may creating new niches that lead to gene loss in a focal species and promote generation of more diversity. Two limitations are (i) that sequencing depth may not be sufficient to analyze strain-level diversity and (ii) that the evidence is exclusively based on correlations, and the observed patterns could also be explained by other eco-evolutionary processes. The claims should be supported by a more detailed analysis, and alternative hypotheses that the results do not fully exclude should be discussed. Understanding drivers of diversity in natural microbial communities is an important question that is of central interest to biomedically oriented microbiome scientists, microbial ecologists and evolutionary biologists.
-
Reviewer #1 (Public Review):
This paper makes an important contribution to the current debate on whether the diversity of a microbial community has a positive or negative effect on its own diversity at a later time point. In my view, the main contribution is linking the diversity-begets-diversity patterns, already observed by the same authors and others, to genomic signatures of gene loss that would be expected from the Black Queen Hypothesis, establishing an eco-evolutionary link. In addition, they test this hypothesis at a more fine-grained scale (strain-level variation and SNP) and do so in human microbiome data, which adds relevance from the biomedical standpoint. The paper is a well-written and rigorous analysis using state-of-the-art methods, and the results suggest multiple new experiments and testable hypotheses (see below), …
Reviewer #1 (Public Review):
This paper makes an important contribution to the current debate on whether the diversity of a microbial community has a positive or negative effect on its own diversity at a later time point. In my view, the main contribution is linking the diversity-begets-diversity patterns, already observed by the same authors and others, to genomic signatures of gene loss that would be expected from the Black Queen Hypothesis, establishing an eco-evolutionary link. In addition, they test this hypothesis at a more fine-grained scale (strain-level variation and SNP) and do so in human microbiome data, which adds relevance from the biomedical standpoint. The paper is a well-written and rigorous analysis using state-of-the-art methods, and the results suggest multiple new experiments and testable hypotheses (see below), which is a very valuable contribution.
That being said, I do have some concerns that I believe should be addressed. First of all, I am wondering whether gene loss could also occur because of environmental selection that is independent of other organisms or the diversity of the community. An alternative hypothesis to the Black Queen is that there might have been a migration of new species from outside and then loss of genes could have occurred because of the nature of the abiotic environment in the new host, without relationship to the community diversity. Telling the difference between these two hypotheses is hard and would require extensive additional experiments, which I don't think is necessary. But I do think the authors should acknowledge and discuss this alternative possibility and adjust the wording of their claims accordingly.
Another issue is that gene loss is happening in some of the most abundant species in the gut. Under Black Queen though, we would expect these species to be most likely "donors" in cross-feeding interactions. Authors should also discuss the implications, limitations, and possible alternative hypotheses of this result, which I think also stimulates future work and experiments.
Regarding Figure 5B, there is a couple of questions I believe the authors should clarify. First, How is it possible that many species have close to 0 pathways? Second, besides the overall negative correlation, the data shows some very conspicuous regularities, e.g. many different "lines" of points with identical linear negative slope but different intercept. My guess is that this is due to some constraints in the pathway detection methods, but I struggle to understand it. I think the authors should discuss these patterns more in detail.
Finally, I also have some conceptual concerns regarding the genomic analysis. Namely, genes can be used for biosynthesis of e.g. building blocks, but also for consumption of nutrients. Under the Black Queen Hypothesis, we would expect the adaptive loss of biosynthetic genes, as those nutrients become provided by the community. However, for catabolic genes or pathways, I would expect the opposite pattern, i.e. the gain of catabolic genes that would allow taking advantage of a more rich environment resulting from a more diverse community (or at least, the absence of pathway loss). These two opposing forces for catabolic and biosynthetic genes/pathways might obscure the trends if all genes are pooled together for the analysis. I believe this can be easily checked with the data the authors already have, and could allow the authors to discuss more in detail the functional implications of the trends they see and possibly even make a stronger case for their claims.
-
Reviewer #2 (Public Review):
The authors re-analysed two previously published metagenomic datasets to test how diversity at the community level is associated with diversity at the strain level in the human gut microbiota. The overall idea was to test if the observed patterns would be in agreement with the "diversity begets diversity" (DBD) model, which states that more diversity creates more niches and thereby promotes further increase of diversity (here measured at the strain-level). The authors have previously shown evidence for DBD in microbiomes using a similar approach but focusing on 16S rRNA level diversity (which does not provide strain-level insights) and on microbiomes from diverse environments.
One of the datasets analysed here is a subset of a cross-sectional cohort from the Human Microbiome Project. The other dataset comes …
Reviewer #2 (Public Review):
The authors re-analysed two previously published metagenomic datasets to test how diversity at the community level is associated with diversity at the strain level in the human gut microbiota. The overall idea was to test if the observed patterns would be in agreement with the "diversity begets diversity" (DBD) model, which states that more diversity creates more niches and thereby promotes further increase of diversity (here measured at the strain-level). The authors have previously shown evidence for DBD in microbiomes using a similar approach but focusing on 16S rRNA level diversity (which does not provide strain-level insights) and on microbiomes from diverse environments.
One of the datasets analysed here is a subset of a cross-sectional cohort from the Human Microbiome Project. The other dataset comes from a single individual sampled longitudinally over 18 months. This second dataset allowed the authors to not only assess the links between different levels of diversity at single timepoints, but test if high diversity at a given timepoint is associated with increased strain-level diversity at future timepoints.
Understanding eco-evolutionary dynamics of diversity in natural microbial communities is an important question that remains challenging to address. The paper is well-written and the detailed description of the methodological approaches and statistical analyses is exemplary. Most of the analyses carried out in this study seem to be technically sound.
The major limitation of this study comes with the fact that only correlations are presented, some of which are rather weak, contrast each other, or are based on a small number of data points. In addition, finding that diversity at a given taxonomic rank is associated with diversity within a given taxon is a pattern that can be explained by many different underlying processes, e.g. species-area relationships, nutrient (diet) diversity, stressor diversity, immigration rate, and niche creation by other microbes (i.e. DBD). Without experiments, it remains vague if DBD is the underlying process that acts in these communities based on the observed patterns.
Another limitation is that the total number of reads (5 mio for the longitudinal dataset and 20 mio for the cross-sectional dataset) is low for assessing strain-level diversity in complex communities such as the human gut microbiota. This is probably the reason why the authors only looked at one species with sufficient coverage in the longitudinal dataset.
Analyzing the effect of diversity at a given timepoint on strain-level diversity at a later timepoint adds an important new dimension to this study which was not assessed in the previous study about the DBD in microbiomes by some of the authors. However, only a single species was analysed in the longitudinal dataset and comparisons of diversity were only done between two consecutive timepoints. This dataset could be further exploited to provide more insights into the prevailing patterns of diversity.
Finally, the evidence that gene loss follows increase in diversity is weak, as very few genes were found to be lost between two consecutive timepoints, and the analysis is based on only a single species. Moreover, while positive correlation were found between overall community diversity and gene family diversity in single species, the opposite trend was observed when focusing on pathway diversity. A more detailed analysis (of e.g. the functions of the genes and pathways lost/gained) to explain these seemingly contrasting results and a more critical discussion of the limitations of this study would be desirable.
-
Reviewer #3 (Public Review):
This work provides a series of tests of hypothesis, which are not mutually exclusive, on how genomic diversity is structured within human microbiomes and how community diversity may influence the evolution of a focal species.
Strengths:
The paper leverages on existing metagenomic data to look at many focal species at the same time to test for the importance of broad eco-evolutionary hypothesis, which is a novelty in the field.Weaknesses:
It is not very clear if the existing metagenomic data has sufficient power to test these models.
It is not clear, neither in the introduction nor in the analysis what precise mechanisms are expected to lead to DBD.
The conclusion that data support DBD appears to depend on which statistics to measure of community diversity are used. Also, performing a test to reject a null …Reviewer #3 (Public Review):
This work provides a series of tests of hypothesis, which are not mutually exclusive, on how genomic diversity is structured within human microbiomes and how community diversity may influence the evolution of a focal species.
Strengths:
The paper leverages on existing metagenomic data to look at many focal species at the same time to test for the importance of broad eco-evolutionary hypothesis, which is a novelty in the field.Weaknesses:
It is not very clear if the existing metagenomic data has sufficient power to test these models.
It is not clear, neither in the introduction nor in the analysis what precise mechanisms are expected to lead to DBD.
The conclusion that data support DBD appears to depend on which statistics to measure of community diversity are used. Also, performing a test to reject a null neutral model would have been welcome either in the results or in the discussion. -
