Inhibition is a prevalent mode of activity in the neocortex around awake hippocampal ripples in mice
Curation statements for this article:-
Curated by eLife

Evaluation Summary:
This paper will be of interest to neurophysiologists and system neuroscientists interested in memory and more specifically in hippocampo-cortical interactions. Using a combination of imaging and electrophysiological techniques, the study characterizes neocortical activity patterns around awake hippocampal ripples. Unlike sleep ripples, cortical activity seems to be dominated by inhibition around ripples but differences between intrinsic activity and synaptic transmission highlight complex interactions in the underlying neuronal circuits and dynamics.
(This preprint has been reviewed by eLife. We include the public reviews from the reviewers here; the authors also receive private feedback with suggested changes to the manuscript. Reviewer #3 agreed to share their name with the authors.)
This article has been Reviewed by the following groups
Discuss this preprint
Start a discussion What are Sciety discussions?Listed in
- Evaluated articles (eLife)
Abstract
Coordinated peri-ripple activity in the hippocampal-neocortical network is essential for mnemonic information processing in the brain. Hippocampal ripples likely serve different functions in sleep and awake states. Thus, the corresponding neocortical activity patterns may differ in important ways. We addressed this possibility by conducting voltage and glutamate wide-field imaging of the neocortex with concurrent hippocampal electrophysiology in awake mice. Contrary to our previously published sleep results, deactivation and activation were dominant in post-ripple neocortical voltage and glutamate activity, respectively, especially in the agranular retrosplenial cortex (aRSC). Additionally, the spiking activity of aRSC neurons, estimated by two-photon calcium imaging, revealed the existence of two subpopulations of excitatory neurons with opposite peri-ripple modulation patterns: one increases and the other decreases firing rate. These differences in peri-ripple spatiotemporal patterns of neocortical activity in sleep versus awake states might underlie the reported differences in the function of sleep versus awake ripples.
Article activity feed
-

-

Author Response
Reviewer #1 (Public Review):
Point 1) There is affluent evidence that the cortical activity in the waking brain, even in head restrained mice, is not uniform but represents a spectrum of states ranging from complete desynchronization to strong synchronization, reminiscent of the up and down states observed during sleep (Luczak et al., 2013; McGinley et al., 2015; Petersen et al., 2003). Moreover, awake synchronization can be local, affecting selective cortical areas but not others (Vyazovskiy et al., 2011). State fluctuations can be estimated using multiple criteria (e.g., pupil diameter). The authors consider reduced glutamatergic drive or long-range inhibition as potential sources of the voltage decrease but do not attempt to address this cortical state continuum, which is also likely to play a role. For example: …
Author Response
Reviewer #1 (Public Review):
Point 1) There is affluent evidence that the cortical activity in the waking brain, even in head restrained mice, is not uniform but represents a spectrum of states ranging from complete desynchronization to strong synchronization, reminiscent of the up and down states observed during sleep (Luczak et al., 2013; McGinley et al., 2015; Petersen et al., 2003). Moreover, awake synchronization can be local, affecting selective cortical areas but not others (Vyazovskiy et al., 2011). State fluctuations can be estimated using multiple criteria (e.g., pupil diameter). The authors consider reduced glutamatergic drive or long-range inhibition as potential sources of the voltage decrease but do not attempt to address this cortical state continuum, which is also likely to play a role. For example: does the voltage inactivation following ripples reflect a local downstate? The authors could start by detecting peaks and troughs in the voltage signal and investigate how ripple power is modulated around those events.
Our study is correlational, and hence, we cannot speak as to any casual role that the awake hippocampal ripples may play in the post-ripple hyperpolarization observed in aRSC. It is indeed possible that the post-awake-ripple neocortical hyperpolarization is independent of ripples and reflects other mechanisms that our experiments have possibly been blind to. One such mechanism is neocortical synchronization in the awake state. As reviewer 1 pointed out, it is possible that a proportion of hippocampal ripples occur before neocortical awake down-states. To test this hypothesis, we triggered the ripple power signal by the troughs (as proxies of awake down-states) and peaks (as proxies of awake up-states) of the voltage signals, captured from different neocortical regions, during periods of high ripple activity when the probability of neocortical synchronization is highest (McGinley et al., 2015; Nitzan et al., 2020). According to this analysis (see the figure below), the ripple power was, on average, higher before troughs of aRSC voltage signal than before those of other regions. On the other hand, the ripple power, on average, was not higher after the peaks of aRSC voltage signal than after those of other regions. This observation supports the hypothesis that a local awake down-state could occur in aRSC after the occurrence of a portion of hippocampal ripples. However, a recent work whose preprint version was cited in our submission (Chambers et al., 2022, 2021) reported that, out of 33 aRSC neurons whose membrane potentials were recorded, only 1 showed up-/down-states transitions (bimodal membrane potential distribution). Still, a portion (10 out of 30) of the remaining neurons showed an abrupt post-ripple hyperpolarization. In addition, they reported a modest post-ripple modulation of aRSC neurons’ membrane potential (~ %20 of the up/down-states transition range). Hence, these results suggest that the post-ripple aRSC hyperpolarization is not necessarily the result of down-states in aRSC. A paragraph discussing this point was added to the discussion lines 262-279.
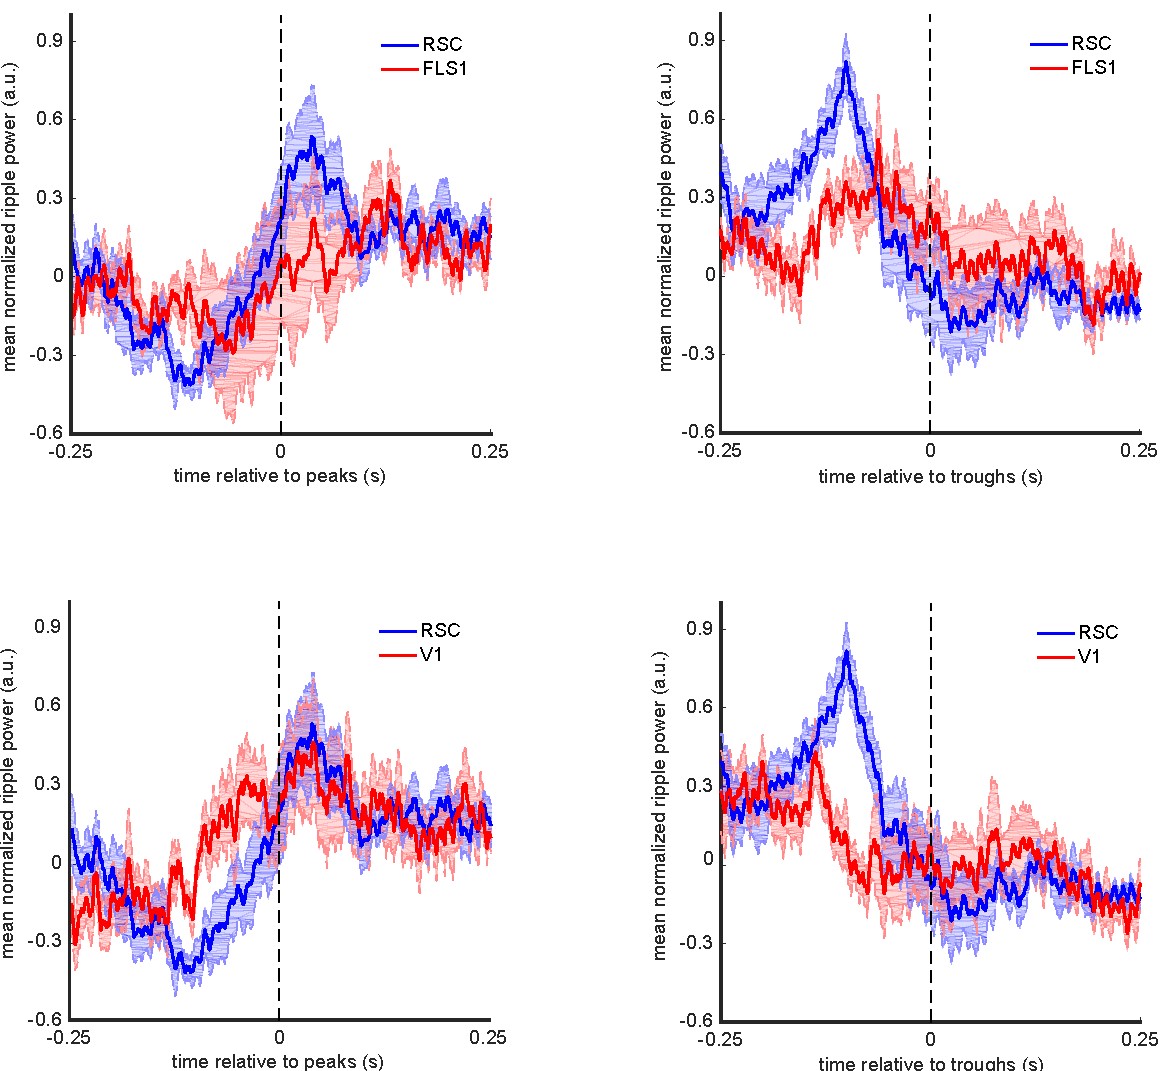
Mean ripple power triggered by troughs and peaks of voltage signal captured from aRSC, V1, and FLS1. Zero time represents the timestamp of neocortical troughs/peaks. The shading represents SEM (n = 6 animals).
Point 2) Ripples are known to be heterogeneous in multiple parameters (e.g., power, duration, isolated events/ ripple bursts, etc.), and this heterogeneity was shown to have functional significance on multiple occasions (e.g. Fernandez-Ruiz et al., 2019 for long-duration ripples; Nitzan et al., 2022 for ripple magnitude; Ramirez-Villegas et al., 2015 for different ripple sharp-wave alignments). It is possible that the small effect size shown here (e.g. 0.3 SD in Fig. 2a) is because ripples with different properties and downstream effects are averaged together? The authors should attempt to investigate whether ripples of different properties differ in their effects on the cortical signals.
The seeming small effect size (e.g. 0.3 SD in Fig. 2a) is because the individual peri-ripple voltage/glutamate traces were z-scored against a peri-non-ripple distribution and then averaged. Alternatively, the peri-ripple traces could have been averaged first, and the averaged trace could have been z-scored against a sampling distribution constructed from the abovementioned peri-non-ripple distribution where the sample size would have been the number of ripples detected for a specific animal. In the latter case, the standard deviation of the sampling distribution would have been used as the divisor in the z-scoring process as opposed to the former case where the standard deviation of the original peri-non-ripple distribution would have been used. Since the standard deviation of the sampling distribution is smaller than the standard deviation of the original distribution by a factor of √(sample size), the final z-scored values in the latter would be higher than those in the former case by a factor of √(sample size). For instance, if the sample size in Fig. 2A (number of ripples) was 100, the mean z-scored value would be 0.3*10 = 3. In any case, it is of interest to investigate the relationship between the ripple and neocortical activity features.
To investigate the relationship between the hippocampal ripple power and the peri-ripple neocortical voltage activity, we focused on the agranular retrosplenial cortex (aRSC) as it showed the highest level of modulation around ripples. To get an idea of what features of the aRSC voltage activity might be correlated with the ripple power, the ripples were divided into 8 subgroups using 8-quantiles of their power distribution, and the corresponding aRSC voltage traces were averaged for each subgroup (similar to the work of Nitzan et al. (Nitzan et al., 2022)). The results of this analysis are summarized in the figure below.
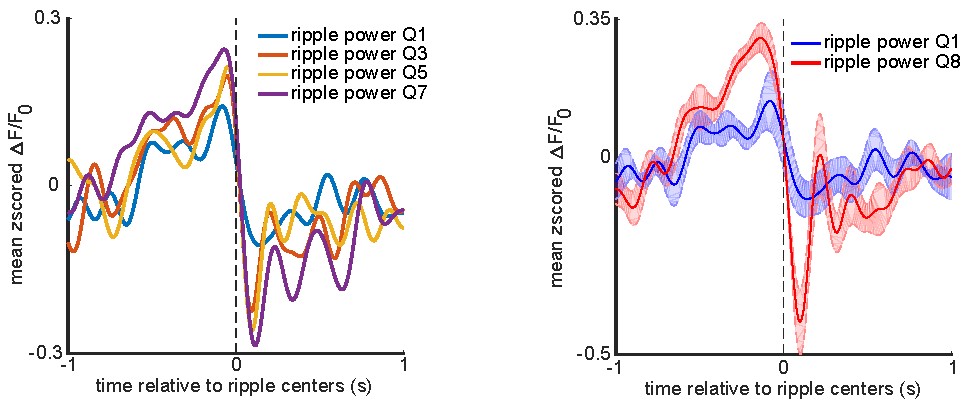
Left: peri-ripple aRSC voltage trace was triggered on ripples in the odd-numbered ripple power subgroups for each animal and then averaged across 6 animals. The standard errors of the mean were not shown for the sake of simplicity. Right: the same as the left panel but for only lowest and highest power subgroups. The shading represents the standard error of the mean.
These results suggested that there might be a positive correlation between the ripple power and the pre-ripple and post-ripple aRSC voltage amplitude. To test this possibility, Pearson’s correlation between the ripple power and pre-/post-ripple aRSC amplitude was calculated for each animal separately. The ripple power for each detected ripple was defined as the average of the ripple-band-filtered, squared, and smoothed hippocampal LFP trace from -50 ms to +50ms relative to the ripple's largest trough timestamp (ripple center). The pre- and post-ripple aRSC amplitude for each ripple was calculated as the average of the aRSC voltage trace over the intervals [-200ms, 0] and [0, 200ms], respectively. The results come as follows.
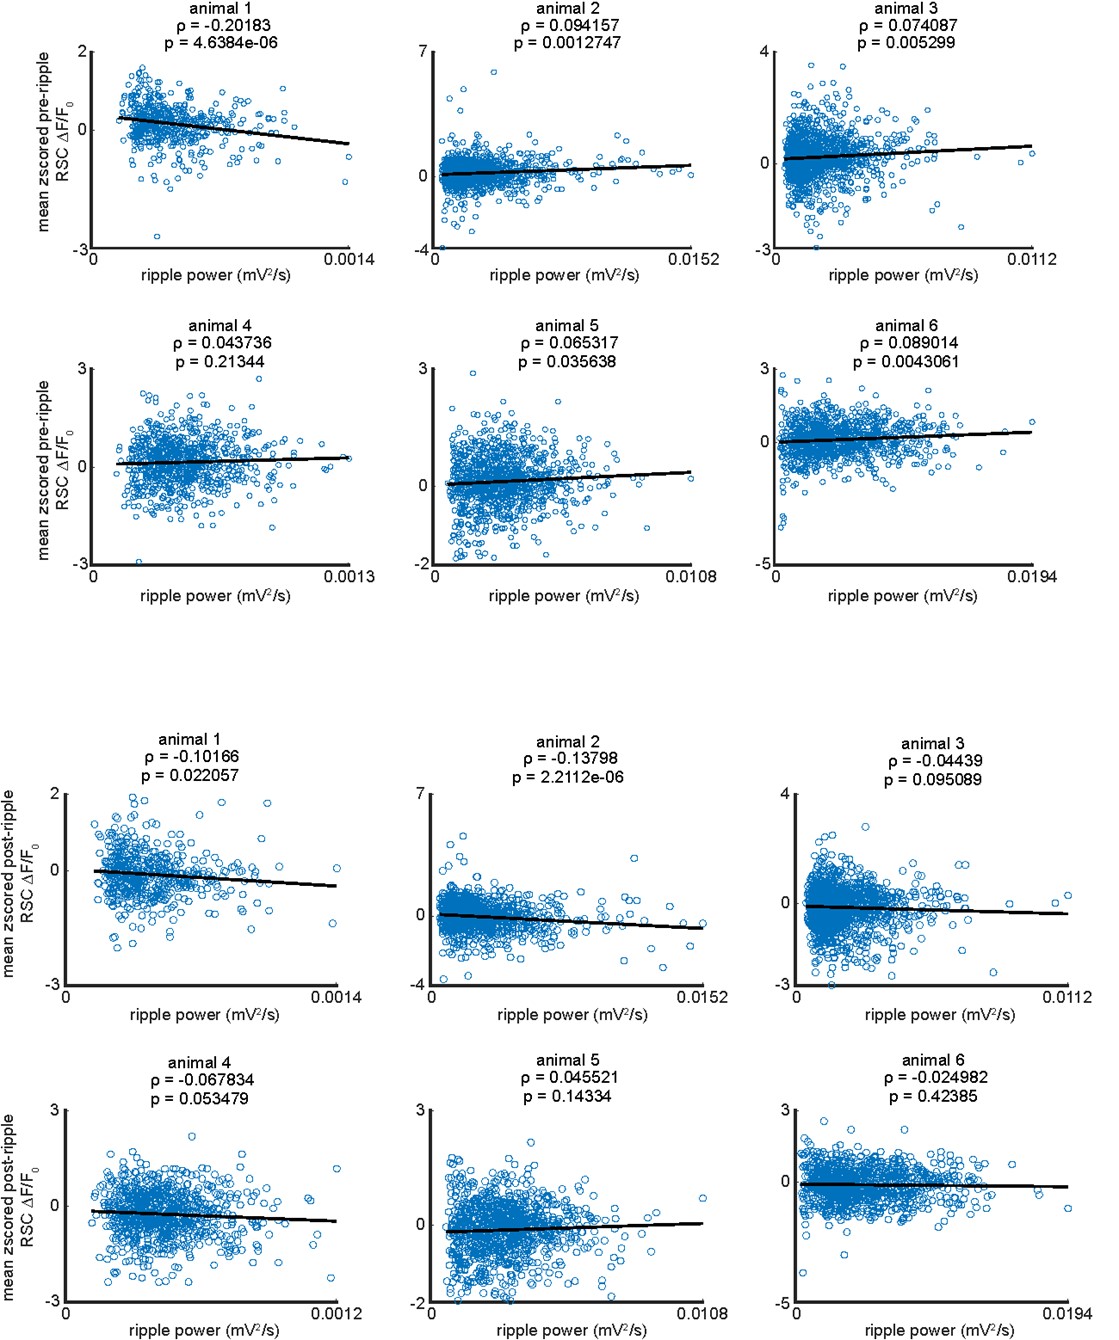
Top: the scatter plots of the ripple power and pre-ripple aRSC voltage amplitude for individual animals. The black lines in each graph represent the linear regression line. The blue circles in each graph are associated with one ripple. The Pearson’s correlation values (ρ) and the p-value of their corresponding statistical significance are represented on top of each graph. Bottom: the same as top graphs but for post-ripple aRSC amplitude.
According to this analysis, 4 out of 6 animals showed a weak positive correlation (ρ = 0.0806 ± 0.0115; mean ± std), 1 animal showed a negative correlation (ρ = -0.20183), and 1 animal did not show a statistically significant correlation (p-value > 0.05) between ripple power and pre-ripple aRSC voltage amplitude. Moreover, 2 out of 6 animals showed a negative correlation (ρ = -0.1 and -0.14), and 4 animals did not show a statistically significant correlation (p-value > 0.05) between ripple power and post-ripple aRSC voltage amplitude.
To check that the correlation results were not influenced by the extreme values of the ripple power and aRSC voltage, we repeated the same correlation analysis after removing the ripples associated with top and bottom %5 of the ripple power and aRSC voltage values. According to this analysis, 1 out of 6 animals showed a negative correlation (ρ = -0.13), and 5 animals did not show a statistically significant correlation (p-value > 0.05) between ripple power and pre-ripple aRSC voltage amplitude. Moreover, 2 out of 6 animals showed a negative correlation (same animals that showed negative correlation before removing the extreme values; ρ = -0.12 and -0.14), 1 animal showed a positive correlation (ρ = 0.1), and 3 animals did not show a statistically significant correlation (p-value > 0.05) between ripple power and post-ripple aRSC voltage amplitude.
Based on these results, we cannot conclude that there is a meaningful correlation between the ripple power and amplitude of aRSC voltage activity before and after the ripples. It is noteworthy to mention that Nitzan et al. (see Fig S6 in (Nitzan et al., 2022)) did not report a statistically significant correlation between ripple power octile number (by discretizing a continuous-valued random variable into 8 subgroups) and pre-ripple firing rate of the mouse visual cortex. However, they reported a statistically significant negative correlation (ρ = -0.13) between the ripple power octile number and post-ripple firing rate of the mouse visual cortex. It appears that their reported negative correlation was influenced by the disproportionately larger values of the firing rate associated with the first ripple power octile compared to the other octiles. Therefore, repeating their analysis after removing the first octile would probably lead to a weak correlation value close to 0.
Next, we investigated the relationship between ripple duration and aRSC voltage activity. To get an idea of what features of the aRSC voltage activity might be correlated with the ripple duration, the ripples were divided into 8 subgroups using 8-quantiles of their duration distribution, and the corresponding aRSC voltage traces were averaged for each subgroup. The results of this analysis are summarized in the figure below.
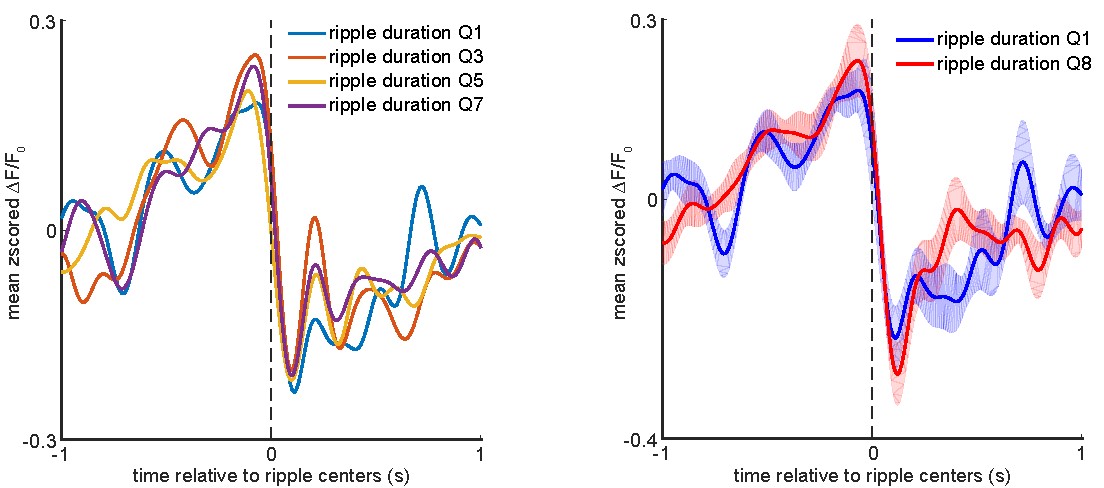
Left: peri-ripple aRSC voltage trace was triggered on ripples in the odd-numbered ripple duration subgroups for each animal and then averaged across 6 animals. The standard errors of the mean were not shown for the sake of simplicity. Right: the same as the left panel but for only lower and highest duration subgroups. The shading represents standard error of the mean.
These results do not reveal a qualitative difference between the patterns of aRSC peri-ripple voltage modulation and ripple duration. However, the same correlation analysis performed for the ripple power was also conducted for the ripple duration. Only 1 animal out of 6 showed a statistically significant correlation (ρ = 0.08) between pre-ripple aRSC voltage amplitude and ripple duration.
Moreover, only 1 animal out of 6 showed a statistically significant correlation (ρ = -0.08) between post-ripple aRSC voltage amplitude and ripple duration. In conclusion, there does not seem to be a meaningful linear relationship between peri-ripple aRSC voltage amplitude and ripple duration.
Next, we investigated whether the peri-ripple aRSC voltage modulation differs depending on whether a single or a bundled ripple occurs in the dorsal hippocampus. The bundled ripples were detected following the method described in our previous work (Karimi Abadchi et al., 2020). We found that 9.4 ± 3.5 (mean ± std across 6 animals) percent of the ripples occurred in bundles. Then, the aRSC voltage trace was triggered by the centers of the single as well as centers of the first/second ripples in the bundled ripples, averaged for each animal, and averaged across 6 animals. The results of this analysis are represented in the following figure.
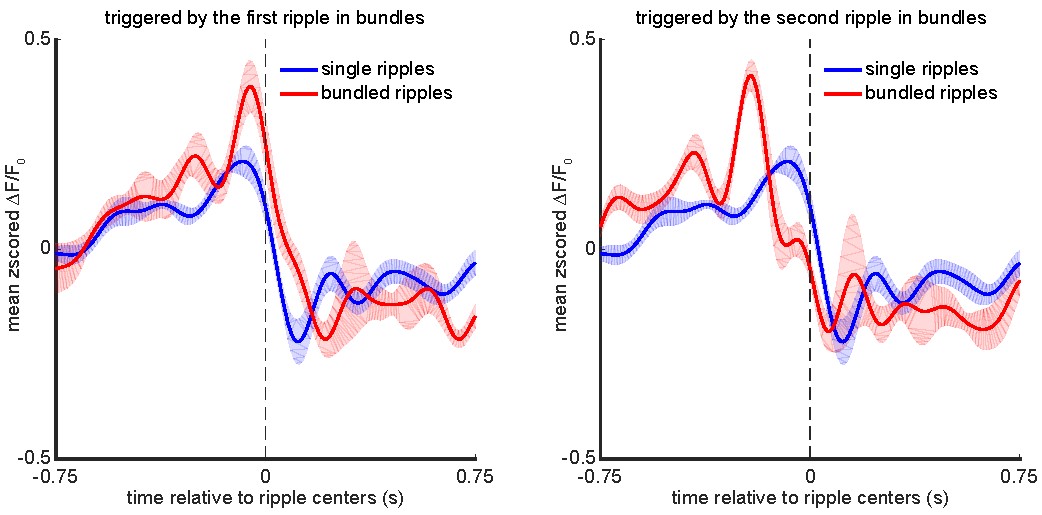
Left: animal-wise average of mean peri-ripple aRSC voltage trace triggered by centers of the single and centers of the first ripple in the bundled ripples. Right: Same to the left but triggered by the centers of the second ripple in the bundled ripples.
These results suggest that the amplitude of aRSC voltage activity is larger before bundled than single ripples, and the timing of aRSC voltage activity is shifted to the later times for bundled versus single ripples. The pre-ripple larger depolarization might signal the occurrence of a bundled ripple (similar to larger pre-bundled- than pre-single-ripple deactivation observed during sleep (Karimi Abadchi et al., 2020)).
Point 3) The differences between the voltage and glutamate signals are puzzling, especially in light of the fact that in the sleep state they went hand in hand (Karimi Abadchi et al., 2020, Fig. 2). It is also somewhat puzzling that the aRSC is the first area to show voltage inactivation but the last area to display an increase in glutamate signal, despite its anatomical proximity to hippocampal output (two synapses away). The SVD analysis hints that the glutamate signal is potentially multiplexed (although this analysis also requires more attention, see below), but does not provide a physiologically meaningful explanation. The authors speculate that feed-forward inhibition via the gRSC could be involved, but I note that the aRSC is among the two major targets of the gRSC pyramidal cells (the other being homotypical projections) (Van Groen and Wyss, 2003), i.e., glutamatergic signals are also at play. To meaningfully interpret the results in this paper, it would be instrumental to solve this discrepancy, e.g., by adding experiments monitoring the activity of inhibitory cells.
Observing that glutamate and voltage signals do not go hand-in-hand in awake versus sleep states was surprising for us as well, and it was the main reason that SVD analysis was performed. Especially that a portion of aRSC excitatory neurons showed elevated calcium activity despite the reduction of voltage and delayed elevation of glutamate signals in aRSC at the population level. At the time of initial submission, pre-ripple reduction and post-ripple elevation of calcium activity in a portion of three subclasses of the superficial aRSC inhibitory neurons were reported (Chambers et al., 2022, 2021), and it was the basis of our speculation on the potential involvement of feed-forward inhibition in the post-ripple voltage reduction. We speculated that the source of this potential feed-forward inhibition could stem from gRSC excitatory neurons, as the reviewer 1 pointed out, or from other neocortical or subcortical regions projecting to aRSC. It is also possible that feedback inhibition would be involved where the principal aRSC neurons that are excited by gRSC (as reviewer 1 pointed out) or any other region, including aRSC itself, excite aRSC inhibitory neurons.
Point 4) I am puzzled by the ensemble-wise correlation analysis of the voltage imaging data: the authors point to a period of enhanced positive correlation between cortex and hippocampus 0-100 ms after the ripple center but here the correlation is across ripple events, not in time. This analysis hints that there is a positive relationship between CA1 MUA (an indicator for ripple power) and the respective cortical voltage (again an incentive to separate ripples by power), i.e. the stronger the ripple the less negative the cortical voltage is, but this conclusion is contradictory to the statements made by the authors about inhibition.
A closer look at Figure 2B iv reveals that elevation of the cross-correlation function between peri-ripple aRSC voltage and hippocampal MUA starts with a short delay (~20 ms) and peaks around 75 ms after the ripple centers. It means the maximum correlation between the two signals occurs at point (75ms, 75ms) on the MUA time-voltage time plane whose origin (i.e. the point (0, 0)) is the ripple centers in the hippocampal MUA and corresponding imaging frame in the voltage signal. Reviewer 1’s interpretation would be correct if the maximum correlation occurred at the point (0, 0) not at the point (75ms, 75 ms). It is because the MUA value at the time of ripple centers (t = 0) is the indicator of the ripple power not at the time t = 75ms. Figure 2B iii shows that the amplitude of hippocampal MUA is more than 2 dB less at t = 75ms than at t = 0 which is a reflection of the fact that ripples are often short-duration events. Instead, if the maximum correlation occurred at the point (0, 100ms) where the ripples had maximum power and aRSC voltage was at its trough (Figure 2B iii), it could have been concluded that “the stronger the ripple the less negative the cortical voltage”.
Point 5) Following my previous point, it is difficult to interpret the ensemble-wise correlation analysis in the absence of rigorous significance testing. The increased correlation between the HPC and RSC following ripples is equal in magnitude to the correlation between pre-ripple HPC MUA and post-ripple cortical activity. How should those results be interpreted? The authors could, for example, use cluster-based analysis (Pernet et al., 2015) with temporal shuffling to obtain significant regions in those plots. In addition, the authors should mark the diagonal of those plots, or even better compute the asymmetry in correlation (see Steinmetz et al., 2019 Extended Fig. 8 as an example), to make it easier for the reader to discern lead/lag relationships.
The purpose of calculating the ensemble-wise correlation coefficient was to provide further information about the relationship between the two random processes peri-ripple HPC MUA and peri-ripple neocortical activity. In general, the correlation between the two random processes cannot be inferred from the temporal relationship between their mean functions. In other words, there are infinitely many options for the shape of the correlation function between two random processes with given mean functions. Moreover, the point was to compare the correlation of peri-ripple neocortical activity and HPC MUA across neocortical regions. The fact that mean peri-ripple activity in, for example, RSC and FLS1 are different does not necessarily mean their correlation functions with peri-ripple HPC MUA are also different.
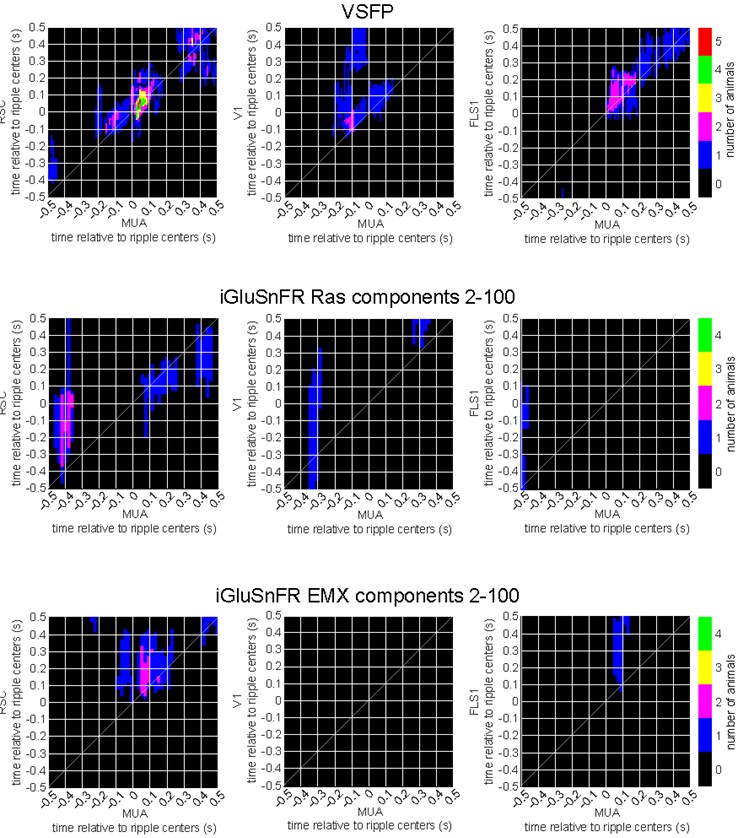
As requested, we performed cluster-based significant testing via temporal shuffling for each individual VSFP (n = 6), iGluSnFR Ras (n = 4), and iGluSnFR EMX (n = 4) animals. The following figures summarize the number of animals showing significant regions in their correlation functions between peri-ripple HPC MUA and different neocortical regions. The diagonal of the correlation functions is marked; however, the temporal lead/lag should not be inferred from these results mainly because the temporal resolution of the two signals, one electrophysiological and one optical, are not the same.
Point 6) For the single cell 2-photon responses presented in Fig. 3, how should the reader interpret a modulation that is at most 1/20 of a standard deviation? Was there any attempt to test for the significance of modulation (e.g., by comparing to shuffle)? If yes, what is the proportion of non-modulated units? In addition, it is not clear from the averages whether those cells represent bona fide distinct groups or whether, for instance, some cells can be upmodulated by some ripples but downmodulated by others. Again, separation of ripples based on objective criteria would be useful to answer this question.
As explained in response to point 2, the seeming small modulation size (e.g. 0.05 SD in Fig. 3b) is because the individual peri-ripple calcium traces were z-scored against a peri-non-ripple distribution and then averaged. Alternatively, the peri-ripple traces could have been averaged first, and the averaged trace could have been z-scored against a sampling distribution constructed from the abovementioned peri-non-ripple distribution where the sample size would have been the number of ripples detected for a specific animal. In this latter case, the standard deviation of the sampling distribution would have been used as the divisor in the z-scoring process as opposed to the former case where the standard deviation of the original peri-non-ripple distribution would have been used. Since the standard deviation of the sampling distribution is smaller than that of the original distribution by a factor of √(sample size), the final z-scored values in the latter would be higher than those in the former case by a factor of √(sample size).
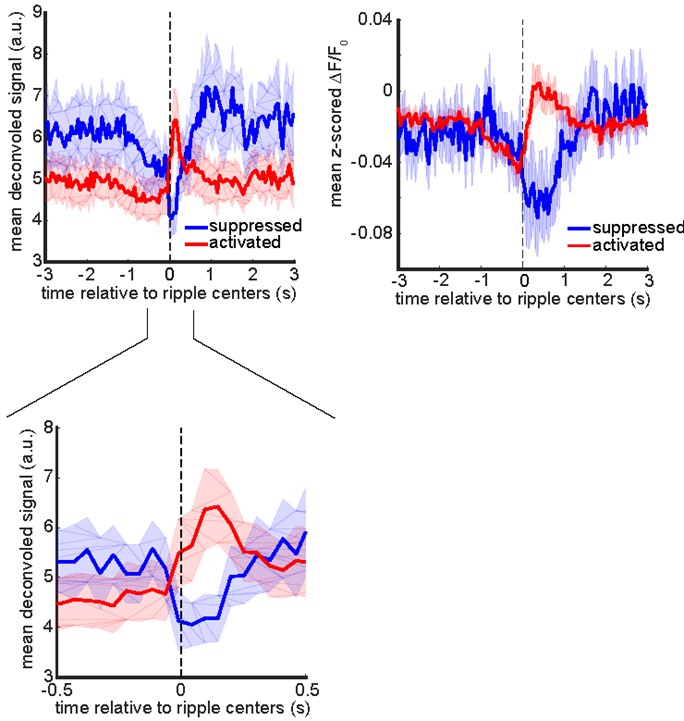
As suggested by the reviewer and to make our results more comparable with those of electrophysiological studies, we deconvolved the calcium traces and tested for the significance of the modulation of each neuron by comparing its mean peri-ripple deconvolved trace with a neuron-specific shuffled distribution (see the methods section for details). We found %8.46 ± 3 (mean ± std across 11 mice) of neurons were significantly modulated over the interval [0, 200ms] and %81.08 ± 8.91 (mean ± std across 11 mice) of which were up-modulated. If the criterion of being distinct is being significantly up- or down-modulated, these two groups could be considered distinct groups. The following figures show mean peri-ripple calcium and deconvolved traces, averaged across up- or down-modulated neurons for each mouse and then averaged across 11 mice.
Point 7) Fig. 3: The decomposition-based analysis of glutamate imaging using SVD needs to be improved. First, it is not clear how much of the variance is captured by each component, and it seems like no attempt has been made to determine the number of significant components or to use a cross-validated approach. Second, the authors imply that reconstructing the glutamate imaging data using the 2nd-100th components 'matches' the voltage signal but this statement holds true only in the case of the aRSC and not for other regions, without providing an explanation, raising questions as to whether this similarity is genuine or merely incidental.
The first 100 components explained about %99.9 of the variance in the concatenated stack of peri-ripple neocortical glutamate activity for each animal which is practically equivalent to the entire variance in the data. Our goal was not to obtain a low-rank approximation of the data for which the number of significant components had to be determined. Instead, we decomposed the data into the activity along the first principal component for which there was no noticeable topography among neocortical regions and the activity along the rest of the components for which there was a noticeable topography among neocortical regions. The first component explained %83.11 ± 6.75 (mean ± std across 4 iGluSnFR Ras mice) and %83.3 ± 5.07 (mean ± std across 4 iGluSnFR EMX mice) of variance in the concatenated stack of peri-ripple neocortical glutamate activity.
As we discussed in the discussion section of the manuscript, SVD is agnostic about brain mechanisms and only cares about capturing maximum variance. Specifically, it is not designed to capture the maximum similarity between glutamate and voltage activity in the brain. Therefore, the only thing we can say with certainty comes as follows: when the activity along the axis with maximum co-variability (1st principal component) across the neocortical regions’ glutamate activity is removed, only aRSC, and no other regions, show a post-ripple down-modulation, whose timing matches that of aRSC post-ripple voltage down-modulation. Moreover, the timing of activity of 1st principal component matches better with that of calcium activity among the up-modulated portion of aRSC neurons. Even though the genuineness of these results is not guaranteed, the similarity between the timing of SVD output in aRSC glutamatergic activity with that in two independently collected signals in aRSC, i.e. voltage and calcium, could support the idea that peri-ripple aRSC glutamatergic activity is likely a mixture of up- and down-modulated components.
Point 8) The estimation of deep pyramidal cells' glutamate activity by subtracting the Ras group (Fig. 4d) is not very convincing. First, the efficiency of transgene expression can vary substantially across different mouse lines. Second, it is not clear to what extent the wide field signal reflects deep cells' somatic vs. dendritic activity due to non-linear scattering (Ma et al., 2016), and it is questionable whether a simple linear subtraction is appropriate. The quality of the manuscript would improve substantially if the authors probe this question directly, either by using deep layer specific line/ 2-P imaging of deep cells or employing available public datasets.
Simulation studies have suggested that the signal, captured by wide-field imaging of voltage-sensitive dye, can be modeled as a weighted sum of voltage activity across neocortical layers (Chemla and Chavane, 2010; Newton et al., 2021). Hence, modeling the glutamate signal as a weighted sum of the glutamate activity across neocortical layers is a good starting point. Future studies would be needed to improve this starting point by imaging glutamate activity in a cohort of mice with iGluSnFR expression in only deep layers’ neurons. Moreover, Ma et al. (Ma et al. 2016) stated that “This means that signal detected at the cortical surface (in the form of a two-dimensional image) represents a superficially weighted sum of signals from shallow and deeper layers of the cortex”.
Reviewer #2 (Public Review):
Point 1) The authors throughout the manuscript compare the correlation between hippocampal MUA and the imaged cortical ensemble activity (Example: Lines 120-122). There is a potential time lag in signal detection with regard to the two detection methods. While the time lag using electrophysiological recording is at the scale of milliseconds, the glutamate-sensitive imaging might take several 100s of ms to be detected. It is not clear in the manuscript how the authors considered this problem during the analysis.
The ensemble-wise correlation analysis characterizes the relationship between two random processes, peri-ripple HPC MUA and peri-ripple neocortical activity (please see the response to reviewer 1’s major point 5). Although it is a valid point that the temporal resolution of the two signals is not the same which could introduce an error in the exact timing of the relationship between the two processes, we did not draw any conclusion based on the exact timing of the elevated correlation between the two processes. Moreover, we smoothed (equivalent to low-pass filtering) and down-sampled the MUA signal (please see the methods section) to bring the temporal scale of the two processes closer to each other. We also want to clarify that the temporal resolution of voltage and glutamate imaging is in the range of 10s of ms (Xie et al., 2016).
Point 2) In the results section "The peri-ripple glutamatergic activity is layer dependent", are the Ras and EMX expressed in two different experimental animal groups? If yes, and there was a time lag between the two groups, is it valid to estimate the deeper layer activity using a scaled version of the Ras from the EMX signal?
This comment is addressed in response to reviewer 1’s major point 8.
Point 3) The authors did not discuss the results adequately in the discussion section. Since there is no behavioral paradigm and no behavioral read-out to induce or correlate it with possible planning and future decision-making process, the significance of the paper will be enhanced by discussing the possible underlying circuitry mechanism that might cause the reported observations. With no planning periods in the task (instead just sitting on a platform), it is actually quite unclear what the purpose of wake ripples should be. For example, the authors discuss the superficial and deep layer responses and their relation to the memory index theory. However, the RSC possesses different groups of excitable neurons in different layers. Specifically, three excitable neurons are found within the different layers of the RSC; the intrinsically bursting neurons (IB), regular spiking (RS), and low-rheobase (LR) neurons. These neurons are distributed heterogeneously within the RSC cortical layer. Although the RS are abundant in the deeper layers of the RSC, they occupy 40% of the total amount of excitable neurons found in layers II/III. On the other hand, the LR is the dominant excitable neuron in the superficial layers. It will add to the significance of the work if the authors discussed the results in the context of the cellular structure of the RSC and how would that impact the observed inhibition in the peri-ripple time window. It would be helpful for the readers and the reviewers to add a schematic diagram to the discussion section.
The goal of our study was to characterize the patterns of neocortical activity around hippocampal ripples in the awake state and not shed light on the function (purpose) of awake ripples. However, we speculated about what our results could mean in the discussion section. To address the reviewer’s comment on the differences across RSC layers, the following paragraph was added to the discussion section lines 342-353.
“Our results suggest that dendrites of deep pyramidal neurons, arborized in the superficial layers of the neocortex, receive glutamatergic modulation earlier than those of the superficial ones. However, the results do not provide a mechanistic explanation of the phenomenon. It is possible that the observed layer-dependency of the glutamatergic modulation would partially result from the heterogeneity of the excitatory as well as inhibitory neurons across aRSC layers. But, the question is how this heterogeneity may lead to the above-mentioned layer-dependency to which our data does not provide an answer. It could be speculated that the difference in the dendritic morphology and firing type of different types of RSC excitatory neurons (Yousuf et al., 2020) or the difference in connectivity of different RSC layers with other brain regions would play a role (Sugar et al., 2011; van Groen and Wyss, 1992; Whitesell et al., 2021). This is a complicated problem and could only be resolved by conducting experiments specifically designed to address this problem.”
Point 4. A general issue (in addition to the missing behaviour), is the mix of the methods. On one side this makes the article very interesting since it highlights that with different methods you actually observe different things. But on the other side, it makes it very difficult to follow the results. It would be a major improvement of the article if the authors could include (as mentioned above) a schematic of the results and their theory, especially highlighting how the different methods would capture different parts of the mechanism. Finally, the authors should not use calcium signals as a direct measure of neuronal firing. Calcium influx is only seen in bursts of firing, not with individual spikes. It is a plasticity signal and therefore should be treated and discussed as such. Just recently it was shown by Adamantidis lab that the calcium signal changes between wake and sleep and this change does not parallel changes in neuronal firing/spikes.
We agree with the reviewer that the calcium signal is biased toward burst of spikes (Huang et al., 2021). To address this concern, the term “spiking activity” was replaced with “calcium activity” throughout the manuscript. Moreover, the calcium signal was deconvoled to get a better estimate of the spiking activity (please refer to our response to the reviewer 1’s point 6).
Point 5. In the discussion section, the authors focus their discussion on the connectivity between the CA1 area and the RSC. Although it is an important point, since the authors are examining the peri-ripple cortical dynamics, it is critical to discuss other possible connectivity effects. Furthermore, the hippocampal input preferentially targets the granular RSC, how would that impact the results and the interpretation of the authors? Additionally, a previous study reported the suppression of the thalamic activity during hippocampal ripples (Yang et al., 2019). Importantly, the thalamic inputs to the RSC target the superficial layers. It will add to the value of the paper if the authors expanded the discussion section and elaborated further on the possible interpretation of the results.
At the time of our initial submission, pre-ripple reduction and post-ripple elevation of calcium activity in a portion of three subclasses of the superficial aRSC inhibitory neurons were reported (Chambers et al., 2022, 2021), and it was the basis of our speculation on the potential involvement of feed-forward inhibition in the post-ripple voltage reduction. We speculated that the source of this potential feed-forward inhibition could stem from gRSC excitatory neurons or other neocortical or subcortical regions projecting to aRSC (please see the discussion section). However, the source being from the thalamus is less likely because multiple studies have observed the suppression of the majority of thalamic neurons during awake ripples (Logothetis et al., 2012; Nitzan et al., 2022; Yang et al., 2019). Moreover, peri-awake-ripple suppression of thalamic axons projecting to the first layer of aRSC is reported (Chambers et al., 2022). On the other hand, it is also possible that feedback inhibition would be involved where the excitatory aRSC neurons that are excited by gRSC (as reviewer 1 pointed out) or any other region, including aRSC itself, excite aRSC inhibitory neurons which in turn inhibit pyramidal cells. To address this comment, the following paragraph was added to the discussion section in lines 323-328.
“Thalamus is another source of axonal projections to aRSC (Van Groen and Wyss, 1992). However, it is less likely that thalamic projections contribute to the peri-awake-ripple aRSC activity modulation because multiple studies have observed the suppression of the majority of thalamic neurons during awake ripples (Logothetis et al., 2012; Nitzan et al., 2022; Yang et al., 2019). Moreover, peri-awake-ripple suppression of thalamic axons projecting to the first layer of aRSC is reported (Chambers et al., 2022).”
-
Evaluation Summary:
This paper will be of interest to neurophysiologists and system neuroscientists interested in memory and more specifically in hippocampo-cortical interactions. Using a combination of imaging and electrophysiological techniques, the study characterizes neocortical activity patterns around awake hippocampal ripples. Unlike sleep ripples, cortical activity seems to be dominated by inhibition around ripples but differences between intrinsic activity and synaptic transmission highlight complex interactions in the underlying neuronal circuits and dynamics.
(This preprint has been reviewed by eLife. We include the public reviews from the reviewers here; the authors also receive private feedback with suggested changes to the manuscript. Reviewer #3 agreed to share their name with the authors.)
-
Reviewer #1 (Public Review):
In this paper, Abadchi et al. investigate neocortical activity patterns surrounding sharp-wave ripples in awake head-fixed mice. To do so, the authors combine multiple approaches, including wide-field voltage and glutamate imaging, 2-photon single-cell calcium imaging, and electrophysiology, used to monitor the hippocampal LFP and MUA. The authors' previous findings in anaesthetized and head-fixed sleeping mice indicated that the majority of cortical areas were strongly activated by ripples. In contrast, they now show that ripple-related neocortical patterns in the awake brain show predominantly suppression of activity. Interestingly, this deactivation seems to be most pronounced and to occur earliest in the agranular retrosplenial cortex (aRSC). To gain a better understanding of the internal dynamics …
Reviewer #1 (Public Review):
In this paper, Abadchi et al. investigate neocortical activity patterns surrounding sharp-wave ripples in awake head-fixed mice. To do so, the authors combine multiple approaches, including wide-field voltage and glutamate imaging, 2-photon single-cell calcium imaging, and electrophysiology, used to monitor the hippocampal LFP and MUA. The authors' previous findings in anaesthetized and head-fixed sleeping mice indicated that the majority of cortical areas were strongly activated by ripples. In contrast, they now show that ripple-related neocortical patterns in the awake brain show predominantly suppression of activity. Interestingly, this deactivation seems to be most pronounced and to occur earliest in the agranular retrosplenial cortex (aRSC). To gain a better understanding of the internal dynamics underlying ripple modulation in the RSC the authors perform 2-photon calcium imaging and find that similar proportions of superficial excitatory cells are activated and suppressed during ripples.
Ripple oscillations have been implicated in multiple cognitive processes including memory consolidation, memory retrieval, and planning, and there is causal evidence suggesting that awake and sleep ripples are differentially involved in those functions. Consequently, understanding the physiological mechanisms underlying hippocampal-neocortical communication during both brain states is of pivotal importance. Many studies investigated the modulation of various cortical areas by ripples during sleep and wakefulness, but the majority of those studies focused on one or few areas. The author's previous study (Abadchi et al., 2020) was an exception in this regard, as it provided a rich characterization of activity surrounding sleep ripples in multiple neocortical areas, including latency to response and direction of propagation. The present study purports to be complementary to those published results, although it lacks many of the analyses used for the sleep paper, which is a missed opportunity. The stark sleep/wake differences in cortical peri-ripple activity reported by the authors are surprising, interesting, and potentially of substantial importance for understanding the functions of ripples in the awake vs. sleep state. However, many of the results presented in the paper are insufficiently analyzed and their statistical significance is unclear, demanding further quantification and clarifications. Moreover, while the paper's major strength lies in the combination of multiple large-scale approaches, it could do better in combining those observations into a coherent conclusion.
Major points:
There is affluent evidence that the cortical activity in the waking brain, even in head restrained mice, is not uniform but represents a spectrum of states ranging from complete desynchronization to strong synchronization, reminiscent of the up and down states observed during sleep (Luczak et al., 2013; McGinley et al., 2015; Petersen et al., 2003). Moreover, awake synchronization can be local, affecting selective cortical areas but not others (Vyazovskiy et al., 2011). State fluctuations can be estimated using multiple criteria (e.g., pupil diameter). The authors consider reduced glutamatergic drive or long-range inhibition as potential sources of the voltage decrease but do not attempt to address this cortical state continuum, which is also likely to play a role. For example: does the voltage inactivation following ripples reflect a local downstate? The authors could start by detecting peaks and troughs in the voltage signal and investigate how ripple power is modulated around those events.
Ripples are known to be heterogeneous in multiple parameters (e.g., power, duration, isolated events/ ripple bursts, etc.), and this heterogeneity was shown to have functional significance on multiple occasions (e.g. Fernandez-Ruiz et al., 2019 for long-duration ripples; Nitzan et al., 2022 for ripple magnitude; Ramirez-Villegas et al., 2015 for different ripple sharp-wave alignments). It is possible that the small effect size shown here (e.g. 0.3 SD in Fig. 2a) is because ripples with different properties and downstream effects are averaged together? The authors should attempt to investigate whether ripples of different properties differ in their effects on the cortical signals.
The differences between the voltage and glutamate signals are puzzling, especially in light of the fact that in the sleep state they went hand in hand (Abadchi et al., 2020, Fig. 2). It is also somewhat puzzling that the aRSC is the first area to show voltage inactivation but the last area to display an increase in glutamate signal, despite its anatomical proximity to hippocampal output (two synapses away). The SVD analysis hints that the glutamate signal is potentially multiplexed (although this analysis also requires more attention, see below), but does not provide a physiologically meaningful explanation. The authors speculate that feed-forward inhibition via the gRSC could be involved, but I note that the aRSC is among the two major targets of the gRSC pyramidal cells (the other being homotypical projections) (Van Groen and Wyss, 2003), i.e., glutamatergic signals are also at play. To meaningfully interpret the results in this paper, it would be instrumental to solve this discrepancy, e.g., by adding experiments monitoring the activity of inhibitory cells.
I am puzzled by the ensemble-wise correlation analysis of the voltage imaging data: the authors point to a period of enhanced positive correlation between cortex and hippocampus 0-100 ms after the ripple center but here the correlation is across ripple events, not in time. This analysis hints that there is a positive relationship between CA1 MUA (an indicator for ripple power) and the respective cortical voltage (again an incentive to separate ripples by power), i.e. the stronger the ripple the less negative the cortical voltage is, but this conclusion is contradictory to the statements made by the authors about inhibition.
Following my previous point, it is difficult to interpret the ensemble-wise correlation analysis in the absence of rigorous significance testing. The increased correlation between the HPC and RSC following ripples is equal in magnitude to the correlation between pre-ripple HPC MUA and post-ripple cortical activity. How should those results be interpreted? The authors could, for example, use cluster-based analysis (Pernet et al., 2015) with temporal shuffling to obtain significant regions in those plots. In addition, the authors should mark the diagonal of those plots, or even better compute the asymmetry in correlation (see Steinmetz et al., 2019 Extended Fig. 8 as an example), to make it easier for the reader to discern lead/lag relationships.
For the single cell 2-photon responses presented in Fig. 3, how should the reader interpret a modulation that is at most 1/20 of a standard deviation? Was there any attempt to test for the significance of modulation (e.g., by comparing to shuffle)? If yes, what is the proportion of non-modulated units? In addition, it is not clear from the averages whether those cells represent bona fide distinct groups or whether, for instance, some cells can be upmodulated by some ripples but downmodulated by others. Again, separation of ripples based on objective criteria would be useful to answer this question.
Fig. 3: The decomposition-based analysis of glutamate imaging using SVD needs to be improved. First, it is not clear how much of the variance is captured by each component, and it seems like no attempt has been made to determine the number of significant components or to use a cross-validated approach. Second, the authors imply that reconstructing the glutamate imaging data using the 2nd-100th components 'matches' the voltage signal but this statement holds true only in the case of the aRSC and not for other regions, without providing an explanation, raising questions as to whether this similarity is genuine or merely incidental.
The estimation of deep pyramidal cells' glutamate activity by subtracting the Ras group (Fig. 4d) is not very convincing. First, the efficiency of transgene expression can vary substantially across different mouse lines. Second, it is not clear to what extent the wide field signal reflects deep cells' somatic vs. dendritic activity due to non-linear scattering (Ma et al., 2016), and it is questionable whether a simple linear subtraction is appropriate. The quality of the manuscript would improve substantially if the authors probe this question directly, either by using deep layer specific line/ 2-P imaging of deep cells or employing available public datasets.
Cited literature
Abadchi, J.K., Nazari-Ahangarkolaee, M., Gattas, S., Bermudez-Contreras, E., Luczak, A., McNaughton, B.L., and Mohajerani, M.H. (2020). Spatiotemporal patterns of neocortical activity around hippocampal sharp-wave ripples. Elife 9, 1-26.
Fernandez-Ruiz, A., Oliva, A., Oliveira, E.F. De, Rocha-Almeida, F., Tingley, D., and Buzsáki, G. (2019). Long-duration hippocampal sharp wave ripples improve memory. Science (80-. ). 364, 1082-1086.
Van Groen, T., and Wyss, J.M. (2003). Connections of the Retrosplenial Granular b Cortex in the Rat. J. Comp. Neurol. 463, 249-263.
Luczak, A., Bartho, P., and Harris, K.D. (2013). Gating of Sensory Input by Spontaneous Cortical Activity. J. Neurosci. 33, 1684-1695.
Ma, Y., Shaik, M.A., Kim, S.H., Kozberg, M.G., Thibodeaux, D.N., Zhao, H.T., Yu, H., and Hillman, E.M.C. (2016). Wide-field optical mapping of neural activity and brain haemodynamics: considerations and novel approaches. Philos. Trans. R. Soc. B Biol. Sci. 371.
McGinley, M.J., David, S. V., and McCormick, D.A. (2015). Cortical Membrane Potential Signature of Optimal States for Sensory Signal Detection. Neuron 87, 179-192.
Nitzan, N., Swanson, R., Schmitz, D., and Buzsáki, G. (2022). Brain-wide interactions during hippocampal sharp wave ripples. Proc. Natl. Acad. Sci. 119.
Pernet, C.R., Latinus, M., Nichols, T.E., and Rousselet, G.A. (2015). Cluster-based computational methods for mass univariate analyses of event-related brain potentials/fields: A simulation study. J. Neurosci. Methods 250, 85-93.
Petersen, C.C.H., Hahn, T.T.G., Sakmann, B., Grinvald, A., and Mehta, M. (2003). Interaction of sensory responses with spontaneous depolarization in layer 2/3 barrel cortex. Proc. Natl. Acad. Sci. 100, 13638-13643.
Ramirez-Villegas, J.F., Logothetis, N.K., and Besserve, M. (2015). Diversity of sharp-wave-ripple LFP signatures reveals differentiated brain-wide dynamical events. Proc. Natl. Acad. Sci. 112, E6379-E6387.
Steinmetz, N.A., Zatka-Haas, P., Carandini, M., and Harris, K.D. (2019). Distributed coding of choice, action and engagement across the mouse brain. Nature 1-8.
Vyazovskiy, V. V, Olcese, U., Hanlon, E.C., Nir, Y., Cirelli, C., and Tononi, G. (2011). Local sleep in awake rats. Nature 472, 443-447. -
Reviewer #2 (Public Review):
Sharp wave ripples (SPW-Rs) are an important electrophysiological biomarker that arise from the synchronous activity of the neuronal population within the hippocampus. Notably, SPW-Rs are essential in communicating compressed sensory representation from the hippocampus to other neocortical areas. Although several studies examined SPW-Rs activity during sleep, they tend also to occur during wake during periods of low speed/no movement. In the current study, Abdachi et al used several imaging and electrophysiological techniques to examine the neural activity surrounding hippocampal SPW-Rs during wake. They identified particular membrane dynamics in the retrosplenial cortex neurons differentiating the neural population into two subpopulations with different firing rate patterns. Furthermore, the authors …
Reviewer #2 (Public Review):
Sharp wave ripples (SPW-Rs) are an important electrophysiological biomarker that arise from the synchronous activity of the neuronal population within the hippocampus. Notably, SPW-Rs are essential in communicating compressed sensory representation from the hippocampus to other neocortical areas. Although several studies examined SPW-Rs activity during sleep, they tend also to occur during wake during periods of low speed/no movement. In the current study, Abdachi et al used several imaging and electrophysiological techniques to examine the neural activity surrounding hippocampal SPW-Rs during wake. They identified particular membrane dynamics in the retrosplenial cortex neurons differentiating the neural population into two subpopulations with different firing rate patterns. Furthermore, the authors concluded that inhibition is more pronounced during wake relative to the sleep state.
I have the following major comments:
1. The authors throughout the manuscript compare the correlation between hippocampal MUA and the imaged cortical ensemble activity (Example: Lines 120-122). There is a potential time lag in signal detection with regard to the two detection methods. While the time lag using electrophysiological recording is at the scale of milliseconds, the glutamate-sensitive imaging might take several 100s of ms to be detected. It is not clear in the manuscript how the authors considered this problem during the analysis.
2. In the results section "The peri-ripple glutamatergic activity is layer dependent", are the Ras and EMX expressed in two different experimental animal groups? If yes, and there was a time lag between the two groups, is it valid to estimate the deeper layer activity using a scaled version of the Ras from the EMX signal?
3. The authors did not discuss the results adequately in the discussion section. Since there is no behavioral paradigm and no behavioral read-out to induce or correlate it with possible planning and future decision-making process, the significance of the paper will be enhanced by discussing the possible underlying circuitry mechanism that might cause the reported observations. With no planning periods in the task (instead just sitting on a platform), it is actually quite unclear what the purpose of wake ripples should be. For example, the authors discuss the superficial and deep layer responses and their relation to the memory index theory. However, the RSC possesses different groups of excitable neurons in different layers. Specifically, three excitable neurons are found within the different layers of the RSC; the intrinsically bursting neurons (IB), regular spiking (RS), and low-rheobase (LR) neurons. These neurons are distributed heterogeneously within the RSC cortical layer. Although the RS are abundant in the deeper layers of the RSC, they occupy 40% of the total amount of excitable neurons found in layers II/III. On the other hand, the LR is the dominant excitable neuron in the superficial layers. It will add to the significance of the work if the authors discussed the results in the context of the cellular structure of the RSC and how would that impact the observed inhibition in the peri-ripple time window. It would be helpful for the readers and the reviewers to add a schematic diagram to the discussion section.
4. A general issue (in addition to the missing behaviour), is the mix of the methods. On one side this makes the article very interesting since it highlights that with different methods you actually observe different things. But on the other side, it makes it very difficult to follow the results. It would be a major improvement of the article if the authors could include (as mentioned above) a schematic of the results and their theory, especially highlighting how the different methods would capture different parts of the mechanism. Finally, the authors should not use calcium signals as a direct measure of neuronal firing. Calcium influx is only seen in bursts of firing, not with individual spikes. It is a plasticity signal and therefore should be treated and discussed as such. Just recently it was shown by Adamantidis lab that the calcium signal changes between wake and sleep and this change does not parallel changes in neuronal firing/spikes.
5. In the discussion section, the authors focus their discussion on the connectivity between the CA1 area and the RSC. Although it is an important point, since the authors are examining the peri-ripple cortical dynamics, it is critical to discuss other possible connectivity effects. Furthermore, the hippocampal input preferentially targets the granular RSC, how would that impact the results and the interpretation of the authors? Additionally, a previous study reported the suppression of the thalamic activity during hippocampal ripples (Yang et al., 2019). Importantly, the thalamic inputs to the RSC target the superficial layers. It will add to the value of the paper if the authors expanded the discussion section and elaborated further on the possible interpretation of the results.
-
Reviewer #3 (Public Review):
This manuscript aimed to reveal the difference and similarity of sharp-wave ripples in awake vs. sleeping mice. To do this, the authors used wide-view voltage and glutamate activity imaging in awake head-fixed mice. The two-photon Ca imaging was applied to examine the spiking activity of the retrosplenial cortex.
They showed that the mean membrane potential and glutamatergic transmission of the neocortex's superficial layers were suppressed and enhanced, respectively, just after the sharp-wave ripples in awake mice, contrary to the same authors' previous findings in urethane-anesthetized and naturally sleeping mice. The retrosplenial cortex was most strongly modulated in membrane potential and glutamatergic transmission by awake sharp-wave ripples. The authors also found two groups of retrosplenial cortical …
Reviewer #3 (Public Review):
This manuscript aimed to reveal the difference and similarity of sharp-wave ripples in awake vs. sleeping mice. To do this, the authors used wide-view voltage and glutamate activity imaging in awake head-fixed mice. The two-photon Ca imaging was applied to examine the spiking activity of the retrosplenial cortex.
They showed that the mean membrane potential and glutamatergic transmission of the neocortex's superficial layers were suppressed and enhanced, respectively, just after the sharp-wave ripples in awake mice, contrary to the same authors' previous findings in urethane-anesthetized and naturally sleeping mice. The retrosplenial cortex was most strongly modulated in membrane potential and glutamatergic transmission by awake sharp-wave ripples. The authors also found two groups of retrosplenial cortical neurons, whose spiking activity, measured by Ca dynamics, was suppressed and enhanced by awake sharp-wave ripples. These findings revealed the critical difference between sharp-wave ripples during waking vs. sleep, which would impact the field of memory research.
This manuscript's strength is that it compares the dynamics of membrane potential and glutamate transmission using wide view imaging. Both experimental and analytical methods were appropriate and supported their main conclusions.
-
