Gene and protein expression and metabolic flux analysis reveals metabolic scaling in liver ex vivo and in vivo
Curation statements for this article:-
Curated by eLife

Evaluation Summary:
The study provides evidence that specific transcriptional responses may underpin the observation that metabolic rates often scale inversely with body mass. The conclusions are supported by direct measurement of metabolic fluxes in mouse and rat livers, although generalizations to other settings remain to be rigorously tested. The study has broad implications for researching and studying animal metabolism and physiology.
(This preprint has been reviewed by eLife. We include the public reviews from the reviewers here; the authors also receive private feedback with suggested changes to the manuscript. Reviewer #1 agreed to share their name with the authors.)
This article has been Reviewed by the following groups
Discuss this preprint
Start a discussion What are Sciety discussions?Listed in
- Evaluated articles (eLife)
Abstract
Metabolic scaling, the inverse correlation of metabolic rates to body mass, has been appreciated for more than 80 years. Studies of metabolic scaling have largely been restricted to mathematical modeling of caloric intake and oxygen consumption, and mostly rely on computational modeling. The possibility that other metabolic processes scale with body size has not been comprehensively studied. To address this gap in knowledge, we employed a systems approach including transcriptomics, proteomics, and measurement of in vitro and in vivo metabolic fluxes. Gene expression in livers of five species spanning a 30,000-fold range in mass revealed differential expression according to body mass of genes related to cytosolic and mitochondrial metabolic processes, and to detoxication of oxidative damage. To determine whether flux through key metabolic pathways is ordered inversely to body size, we applied stable isotope tracer methodology to study multiple cellular compartments, tissues, and species. Comparing C57BL/6 J mice with Sprague-Dawley rats, we demonstrate that while ordering of metabolic fluxes is not observed in in vitro cell-autonomous settings, it is present in liver slices and in vivo. Together, these data reveal that metabolic scaling extends beyond oxygen consumption to other aspects of metabolism, and is regulated at the level of gene and protein expression, enzyme activity, and substrate supply.
Article activity feed
-

-

Author Response:
Evaluation Summary:
The study provides evidence that specific transcriptional responses may underpin the observation that metabolic rates often scale inversely with body mass. The conclusions are supported by direct measurement of metabolic fluxes in mouse and rat livers, although generalizations to other settings remain to be rigorously tested. The study has broad implications for researching and studying animal metabolism and physiology.
We thank the reviewers and editors for this summary. We are pleased that they agree that the conclusions “are supported by direct measurements of metabolic fluxes in mouse and rat livers,” and that “the study has broad implications for researching and studying animal metabolism and physiology. While we fully agree that “generalizations to other settings remain to be rigorously …
Author Response:
Evaluation Summary:
The study provides evidence that specific transcriptional responses may underpin the observation that metabolic rates often scale inversely with body mass. The conclusions are supported by direct measurement of metabolic fluxes in mouse and rat livers, although generalizations to other settings remain to be rigorously tested. The study has broad implications for researching and studying animal metabolism and physiology.
We thank the reviewers and editors for this summary. We are pleased that they agree that the conclusions “are supported by direct measurements of metabolic fluxes in mouse and rat livers,” and that “the study has broad implications for researching and studying animal metabolism and physiology. While we fully agree that “generalizations to other settings remain to be rigorously tested,” we have now added a comment comparing our measured liver fluxes in rodents to those recently measured in people:
“While we did not have the capacity to measure liver fluxes in larger mammals in the current study, endogenous glucose production, VPC, and VCS previously measured using PINTA were 50-60% lower in overnight fasted humans than in rats (Petersen et al., 2019), assuming a liver size of 1,500 g in humans.”
Reviewer #1 (Public Review):
It is well established that the energy expenditure and metabolic rate of metazoan organisms scale inversely to body mass, based on the measurement of oxygen consumption and caloric intake. However, the underlying regulatory mechanisms for this observation are poorly defined. To investigate whether metabolic scaling is associated with reduced levels of transcription of metabolic genes in larger animals, the authors reviewed existing transcriptional datasets from liver tissues of five animals (mice, rats, monkeys, humans and cattle) with a 30,000-fold range in average adult body weights. They identified a number of metabolic genes in different pathways of central carbon metabolism whose expression inversely scaled with body size, a majority of which required oxygen, NAD/H or ATP/ADP. Metabolic flux studies on intact liver sections, as well as in live animals also revealed decreased liver metabolic fluxes in rats compared to mice. Interestingly, these differences were not observed in primary hepatocyte cultures, indicating that metabolic scaling is primarily regulated by cell-extrinsic factors and tissue context. These are interesting findings and highlight the importance of measuring metabolic processes in vivo. The measurement of cellular metabolic fluxes in different contexts (cultured, ex vivo tissue sections and live animals) is a major strength of this study. The lack of direct evidence that enzyme levels correlate with mRNA, and the absence of both transcriptional and enzyme activity measurements in cultured cells are potential weaknesses.
We are delighted, and thank Reviewer #1 for stating that “These are interesting findings and highlight the importance of measuring metabolic processes in vivo” and that “The measurement of cellular metabolic fluxes in different contexts (cultured, ex vivo tissue sections and live animals) is a major strength of this study.” In addition, we sincerely thank the reviewer for raising important weaknesses related to the importance of proteomics, transcriptional and enzyme activity measurements in cultured cells, and are pleased to have had the opportunity to add data to address each of these points.
Reviewer #2 (Public Review):
Akingbesote et al. aim to determine the molecular basis of metabolic scaling - the phenomenon that metabolic rates scale inversely with (0.75) body mass. More specifically, they test the hypothesis that expression of genes involved in the regulation of oxygen consumption and substrate metabolism as well as respective fluxes provide a molecular basis for metabolic scaling across five species: mice, rats, monkeys, humans, and cattle. To this end, Akingbesote et al. use publicly available transcriptomics data and identify genes that show decreasing (normalized) expression with increasing mass of organisms. This descriptive analysis is followed by discussing a few relevant examples and (KEGG) pathway enrichment analysis. The authors then used their published PINTA approach with data from their experiments with mice and rats to provide estimates of selected cytosolic and mitochondrial fluxes in vitro, ex vivo, and in vivo; these estimates are then employed in determining if metabolic fluxes scale. The conclusion drawn from these analyses is that estimates of selected fluxes do not differ in vitro between plated hepatocytes of mice and rats, but that differences can be detected using metabolic flux analysis in vivo. As a result, in vivo flux profiling is more relevant to assessing metabolic scaling.
The conclusions are only in part supported by the data and clarifications are needed both with respect to the analysis of transcriptomics data as well as flux estimates:
- In looking for scaling in gene expression, the authors rely on the assumption that mRNA expression correlates well with protein abundance (citing Schwanhäusser et al., 2011); however, transcripts explain about 40% of variance in protein abundance (this observation holds across multiple species). Hence, the identified patterns based on the transcript data may have little implications for protein abundance or flux.
We agree that, despite the data in the cited publication, gene expression should not be assumed to directly correlate with protein expression, and the two certainly cannot be assumed – without data to equate to metabolic flux. We have removed the citation, and replaced it with proteomics data. Half of the genes available in the proteomics analysis which were found to correlate negatively with body size in our liver transcriptomics analysis also correlated negatively with body size at the level of liver protein expression:
 Author Response Figure 1
Additionally, we analyzed available proteomics assessment of left ventricular expression of the three proteins observed to correlate negatively with body mass in the liver proteomics analysis. One of the three genes observed to correlate negatively with body mass in the proteomics analysis of liver, GLUL, was also shown to correlate negatively with body mass when its expression was assessed in the heart:
 Author Response Figure 2
However, as discussed in our response to the editor’s point 1, we are limited by the available data, and fully acknowledge that without the capacity to statistically compare groups, we cannot make conclusive statements regarding the proteomics data.
Additionally, we have substantially softened the description of the implications of the transcriptomics data in the Abstract, Introduction, and Discussion, including:
- Editing “Together, these data reveal that metabolic scaling extends beyond oxygen consumption to numerous other metabolic pathways, and is likely regulated at the level of gene and protein expression, enzyme activity, and substrate supply” to add the parameters in red.
- Removing “Considering that mRNA expression correlates well with protein expression under basal conditions, especially for metabolic genes (Schwanhäusser et al., 2011), we used mRNA expression as a proxy for the relative abundance of metabolic enzymes.”
- Added “Further analysis of liver proteomics revealed that approximately half of the genes in liver that scaled at the transcriptional level also scaled at the level of protein expression,” now linking gene expression to protein expression to metabolic flux.
- Editing “Numerous metabolic genes…followed the pattern of metabolic scaling, and informed our isotope tracer based in vitro and in vivo metabolic flux studies” to “Numerous metabolic genes…followed the pattern of metabolic scaling. Further analysis of liver proteomics revealed that approximately half of the genes in liver that scaled at the transcriptional level also scaled at the level of protein expression. To determine if gene and protein expression would correlate with scaling at the level of metabolic flux, we performed a comprehensive assessment of liver metabolism in vivo and in vitro using modified Positional Isotopomer NMR Tracer Analysis (PINTA)…”
- Edited “Taken together, this study demonstrates systems regulation of metabolic scaling: gene expression in livers showed that scaling occurs to regulate oxygen consumption and substrate supply, isotope-based tracer studies in mice and rats demonstrated the mechanistic function of these enzymes in vivo which was only apparent in the living organism rather than plated cells” to “Taken together, this study demonstrates systems regulation of the ordering of metabolic fluxes according to body size, and provides unique insight into the regulation of metabolic flux across species.”
- Removed “Interestingly, the scaling of GPT and ADIPOR1 further suggest that there is dependence on extra-hepatic organs in the scaling of in vivo gluconeogenesis and fatty acid oxidation: that is, skeletal muscle supply of alanine for the liver mediated glucose-alanine cycle and adipose tissue-derived adiponectin signaling. These findings also suggests that the scaling of mitochondrial mass (Porter and Brand, 1995) or mitochondrial proton leak (Porter and Brand, 1993) cannot fully explain metabolic scaling.”
- Added “However, it should be noted that metabolic scaling cannot fully be explained at the transcriptional level, because many rate-limiting enzymes in the metabolic processes measured in vivo did not scale at the transcriptional level, and only approximately half of genes that scaled at the level of mRNA scaled at the level of protein. Thus, it is likely that both transcriptional and other mechanisms – such as enzyme activity – are responsible for variations in metabolic flux per unit mass, inversely proportionally to body size. Additionally, the currently available data do not allow us to assess whether expression of certain isoforms of key metabolic enzymes scale differentially across species.”
- While the procedure used to identify transcripts whose expression scale is clearly described, focusing the enrichment on KEGG pathways can only identify metabolic genes that scale. It would be informative and instructive to investigate if and to what extent genes involved in non-metabolic processes, that affect metabolic rates, also scale.
We acknowledge that focusing the enrichment on KEGG pathways does enrich for the identification of metabolic processes that scale. However, we would respectfully submit that because this manuscript focuses on metabolic scaling, this seems to be the most appropriate setting in which to conduct the analysis. New data added in this revision demonstrate that three metabolic enzymes that scaled in the transcriptomics analysis also scale relative to β-actin, further suggesting that the inverse correlation of gene expression with body weight is primarily confined to metabolic processes:
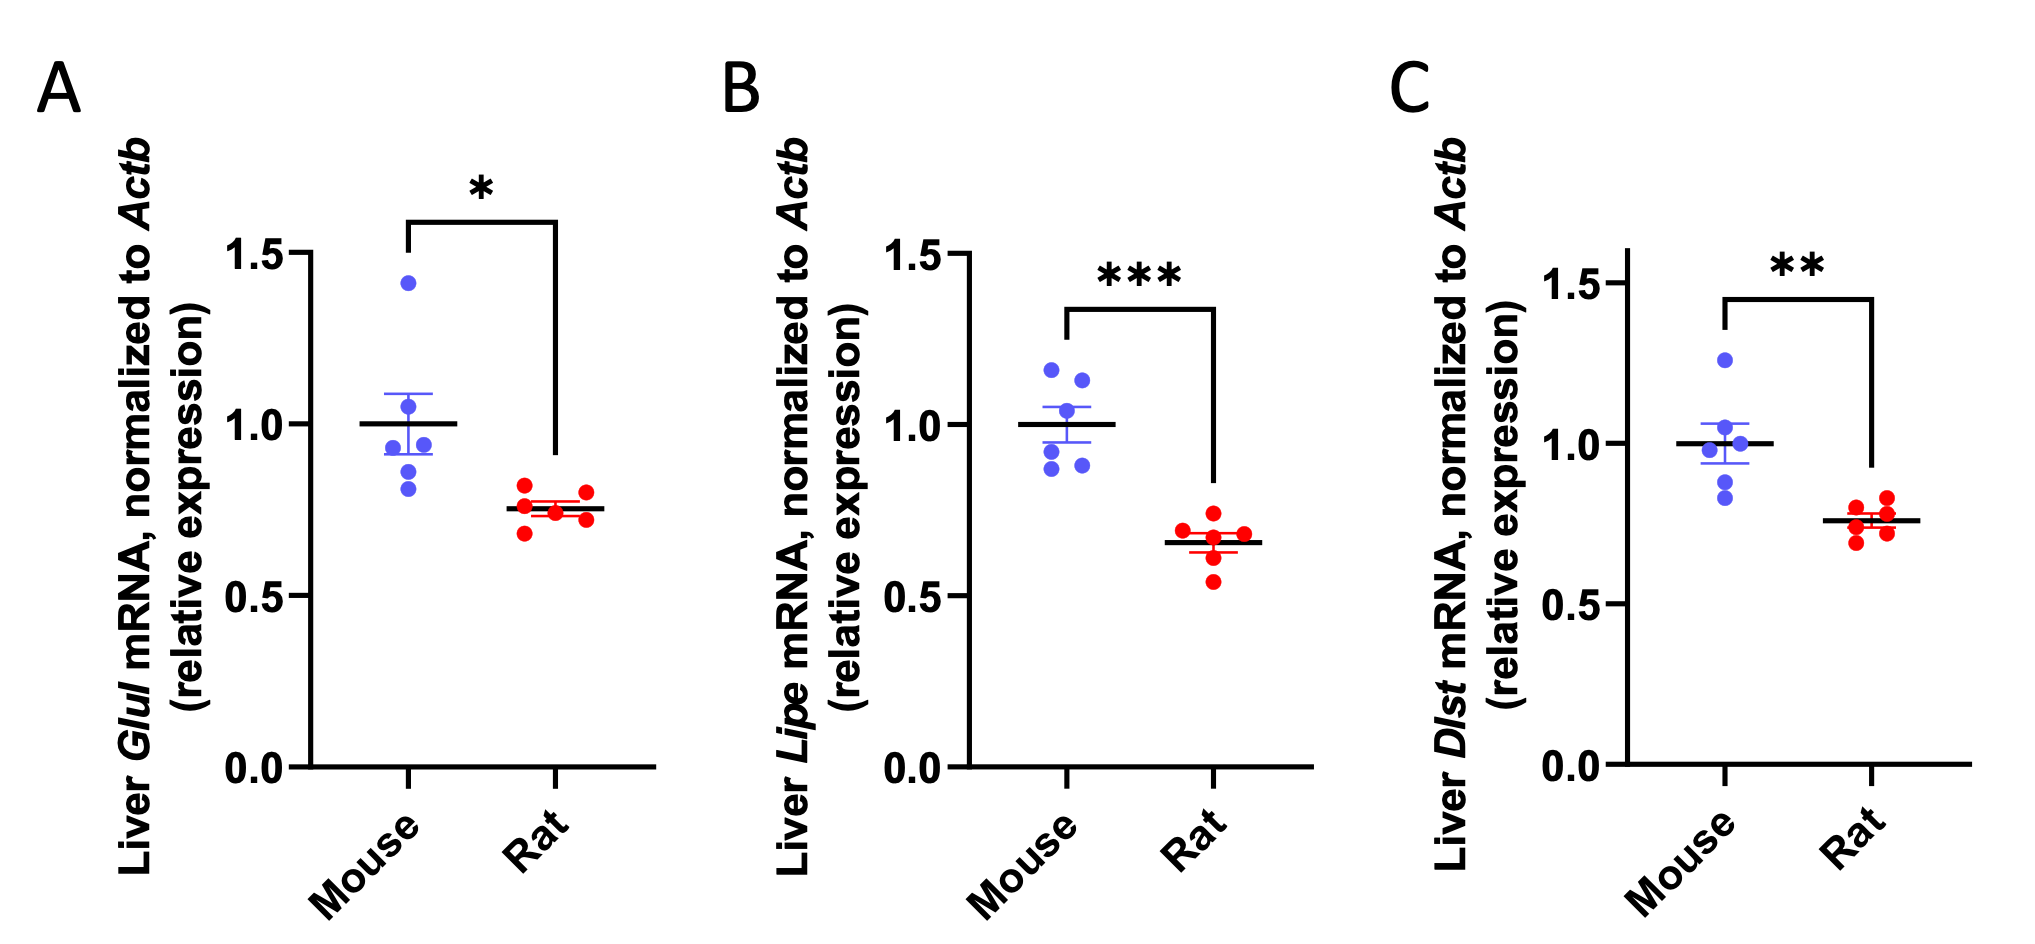 Author Response Figure 3
In addition, we measured the expression of two structural proteins (collagenase 3 [Mmp3] and Larp6) outside of metabolic pathways, relative to β-actin (Actb), and found that neither was differentially expressed relative to actin in mice versus rats:
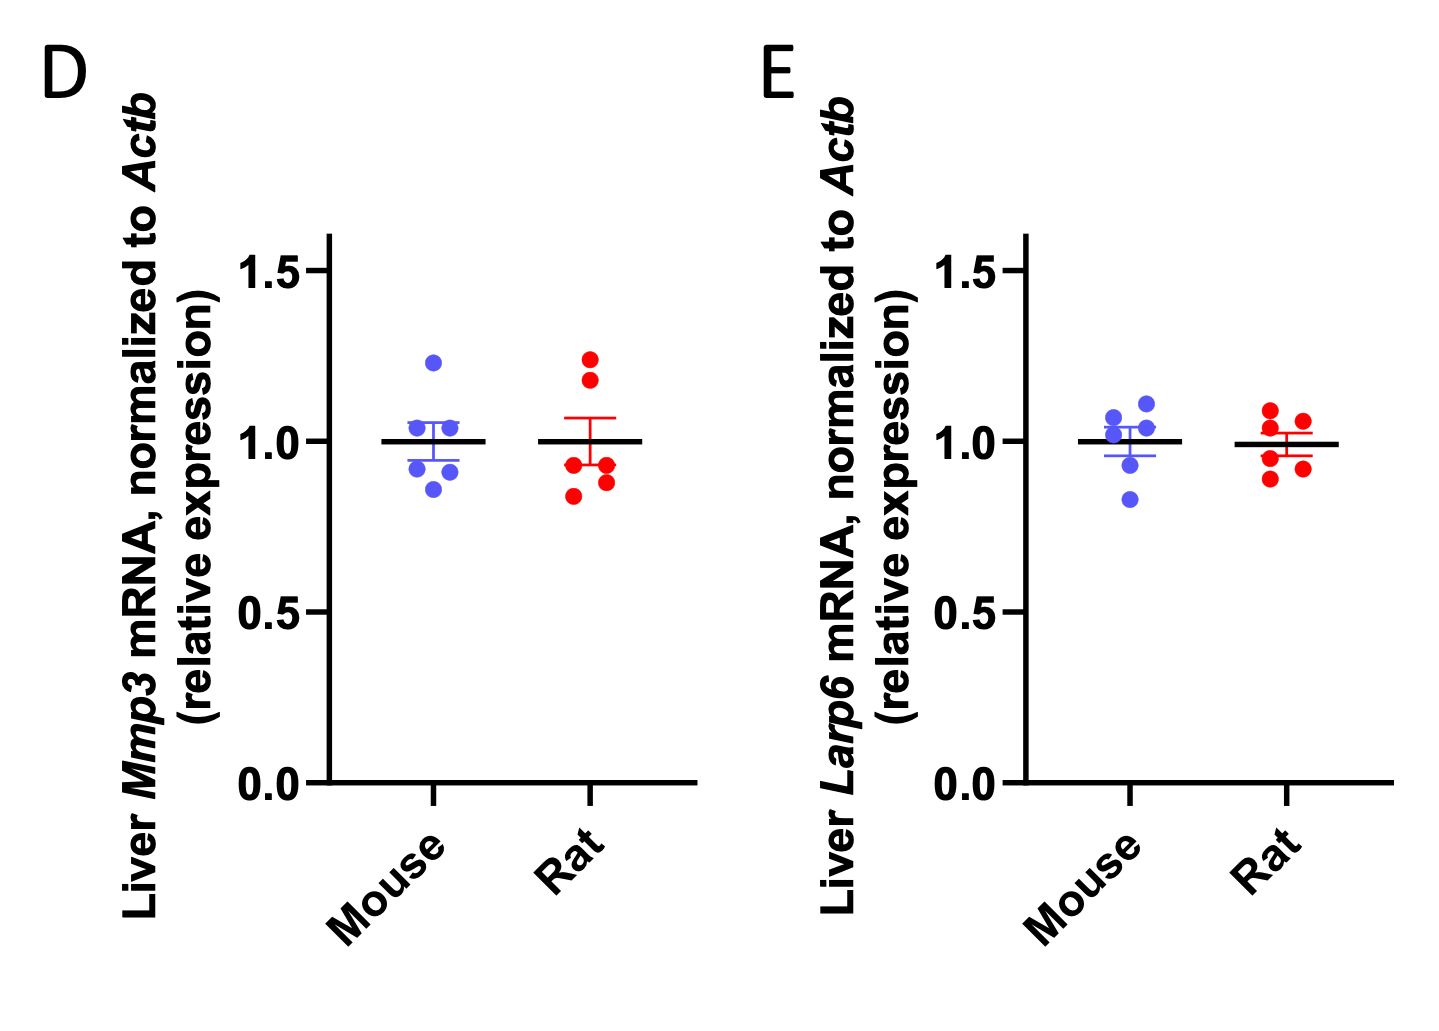 Author Response Figure 4
We recognize that these data may be confounded by the fact that Actb expression could potentially be different in mice versus rats; however, the fact that metabolic genes scale relative to β-actin (Actb) expression shows that it is unlikely that global mRNA scaling is unlikely to be the sole cause of the metabolic scaling phenotype.
- The result on flux ratios and absolute fluxes, based on the equations in Table S1, rely on certain assumptions (e.g. metabolic and isotopic steady state, among the others listed in PINTA); the current presentation does not ensure that all assumptions of PINTA are met in the present setting, so the estimates may be biased, leading to alternative explanations for the observed differences in vivo or the lack thereof in vitro.
However, we fully agree with the reviewer that it is critical to ensure that key assumptions are met when presenting tracer data, and thank them for raising this important point. Thus, we have now added data demonstrating that plasma m+1, m+2, and m+7 glucose are in steady state at 100 min of the 120 min in vivo tracer infusion:
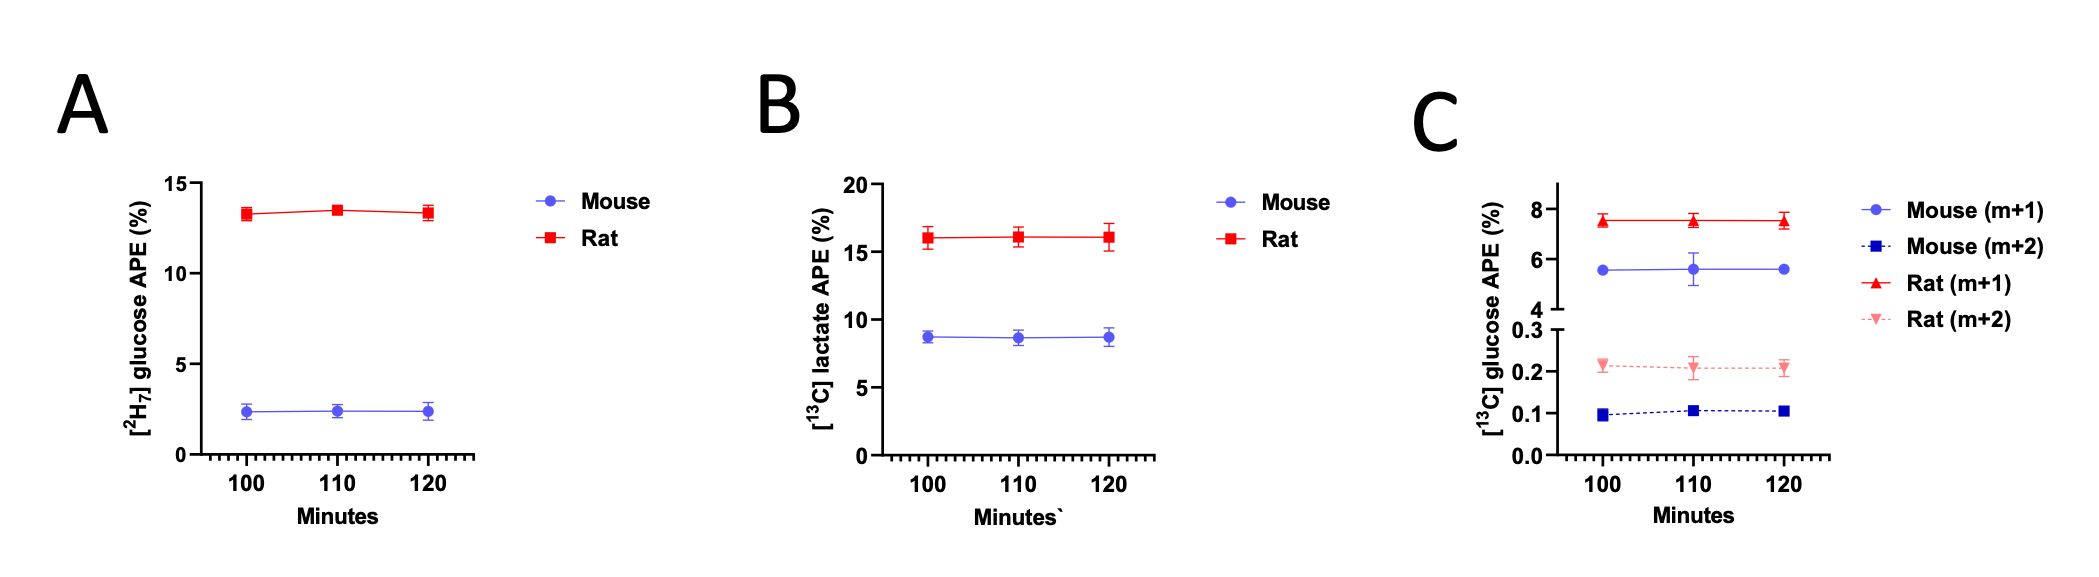 Author Response Figure 5
Additionally, we now show that blood glucose and plasma lactate concentrations have reached steady state as well:
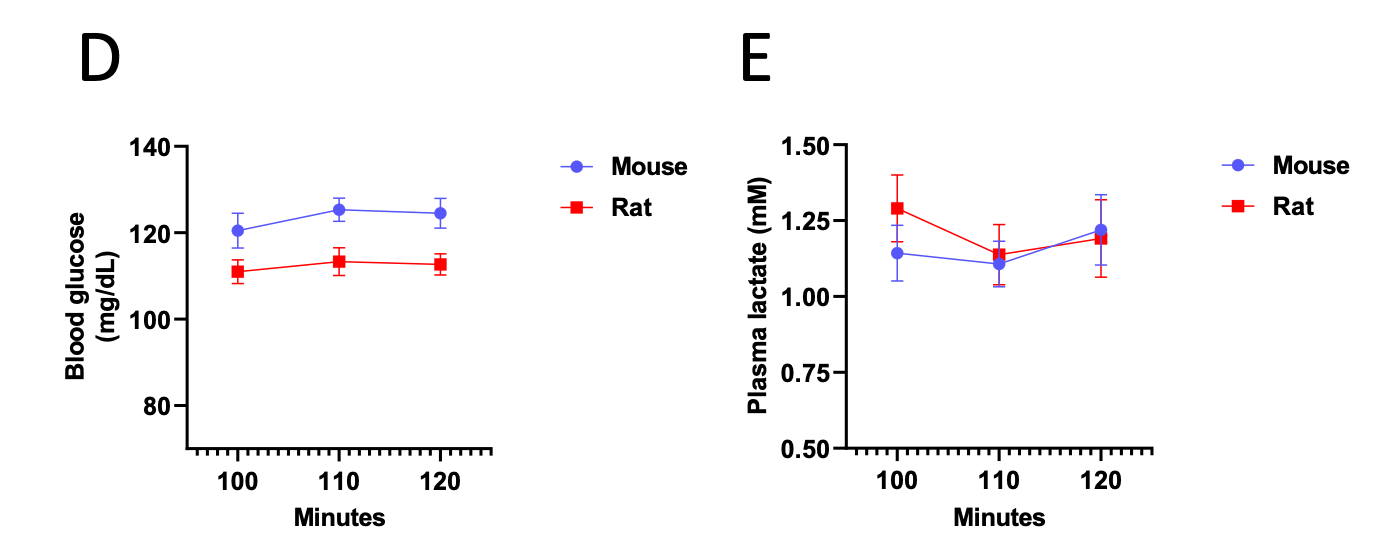 Author Response Figure 6
With these data, we validate that the mice and rats are at metabolic and isotopic steady state by the end of the 120 min tracer infusion. We recognize that we have not validated that liver m+1 and m+2 glucose are at steady state, as that would require two additional groups of mice and rats (to sacrifice at 100 and 110 min, compared to the animals euthanized after 120 min of infusion) and introduce additional variability. Additionally, plasma m+1 and m+2 glucose come from endogenous glucose production from 13C tracer, so if m+1 and m+2 glucose are in steady state in plasma, they must be in steady state in liver.
An additional assumption is that liver glycogen is effectively depleted after the overnight fast utilized in these studies. We have now verified this assumption by comparing fed and overnight fasted liver glycogen concentrations, and detect negligible glycogen after the fast in both rats and mice:
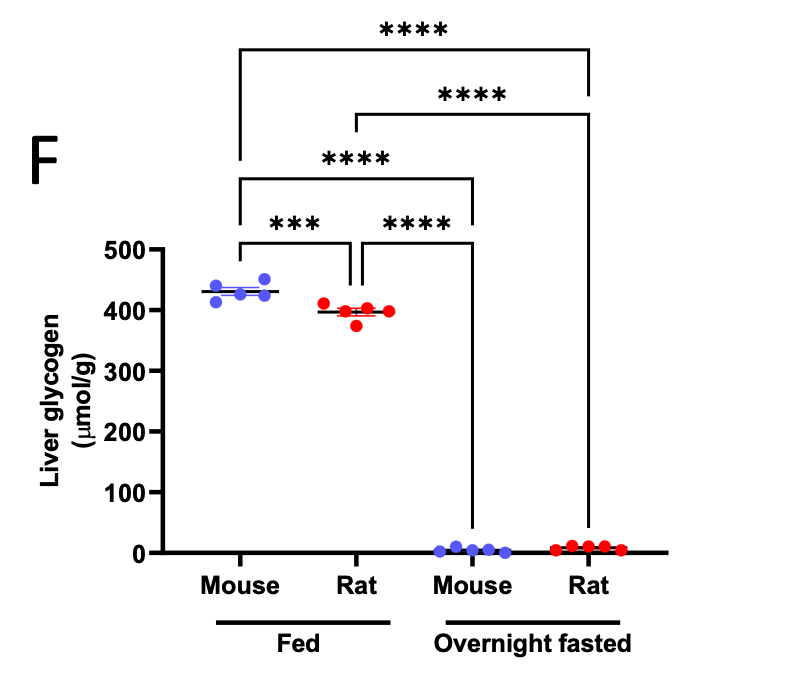 Author Response Figure 7
Additionally, we validated isotopic steady state in our hepatocytes incubated in 3-13C lactate. As expected in plated cell studies, cells reached steady state in both [13C] lactate enrichment and m+1 and m+2 glucose enrichment within 60 min. Because net glucose production is measured using the accumulation of glucose, we do not expect – and did not measure – glucose concentration at steady state, but we did confirm that the accumulation of glucose is linear throughout the 6 hr incubation (thus confirming that 6 hr is a reasonable endpoint):
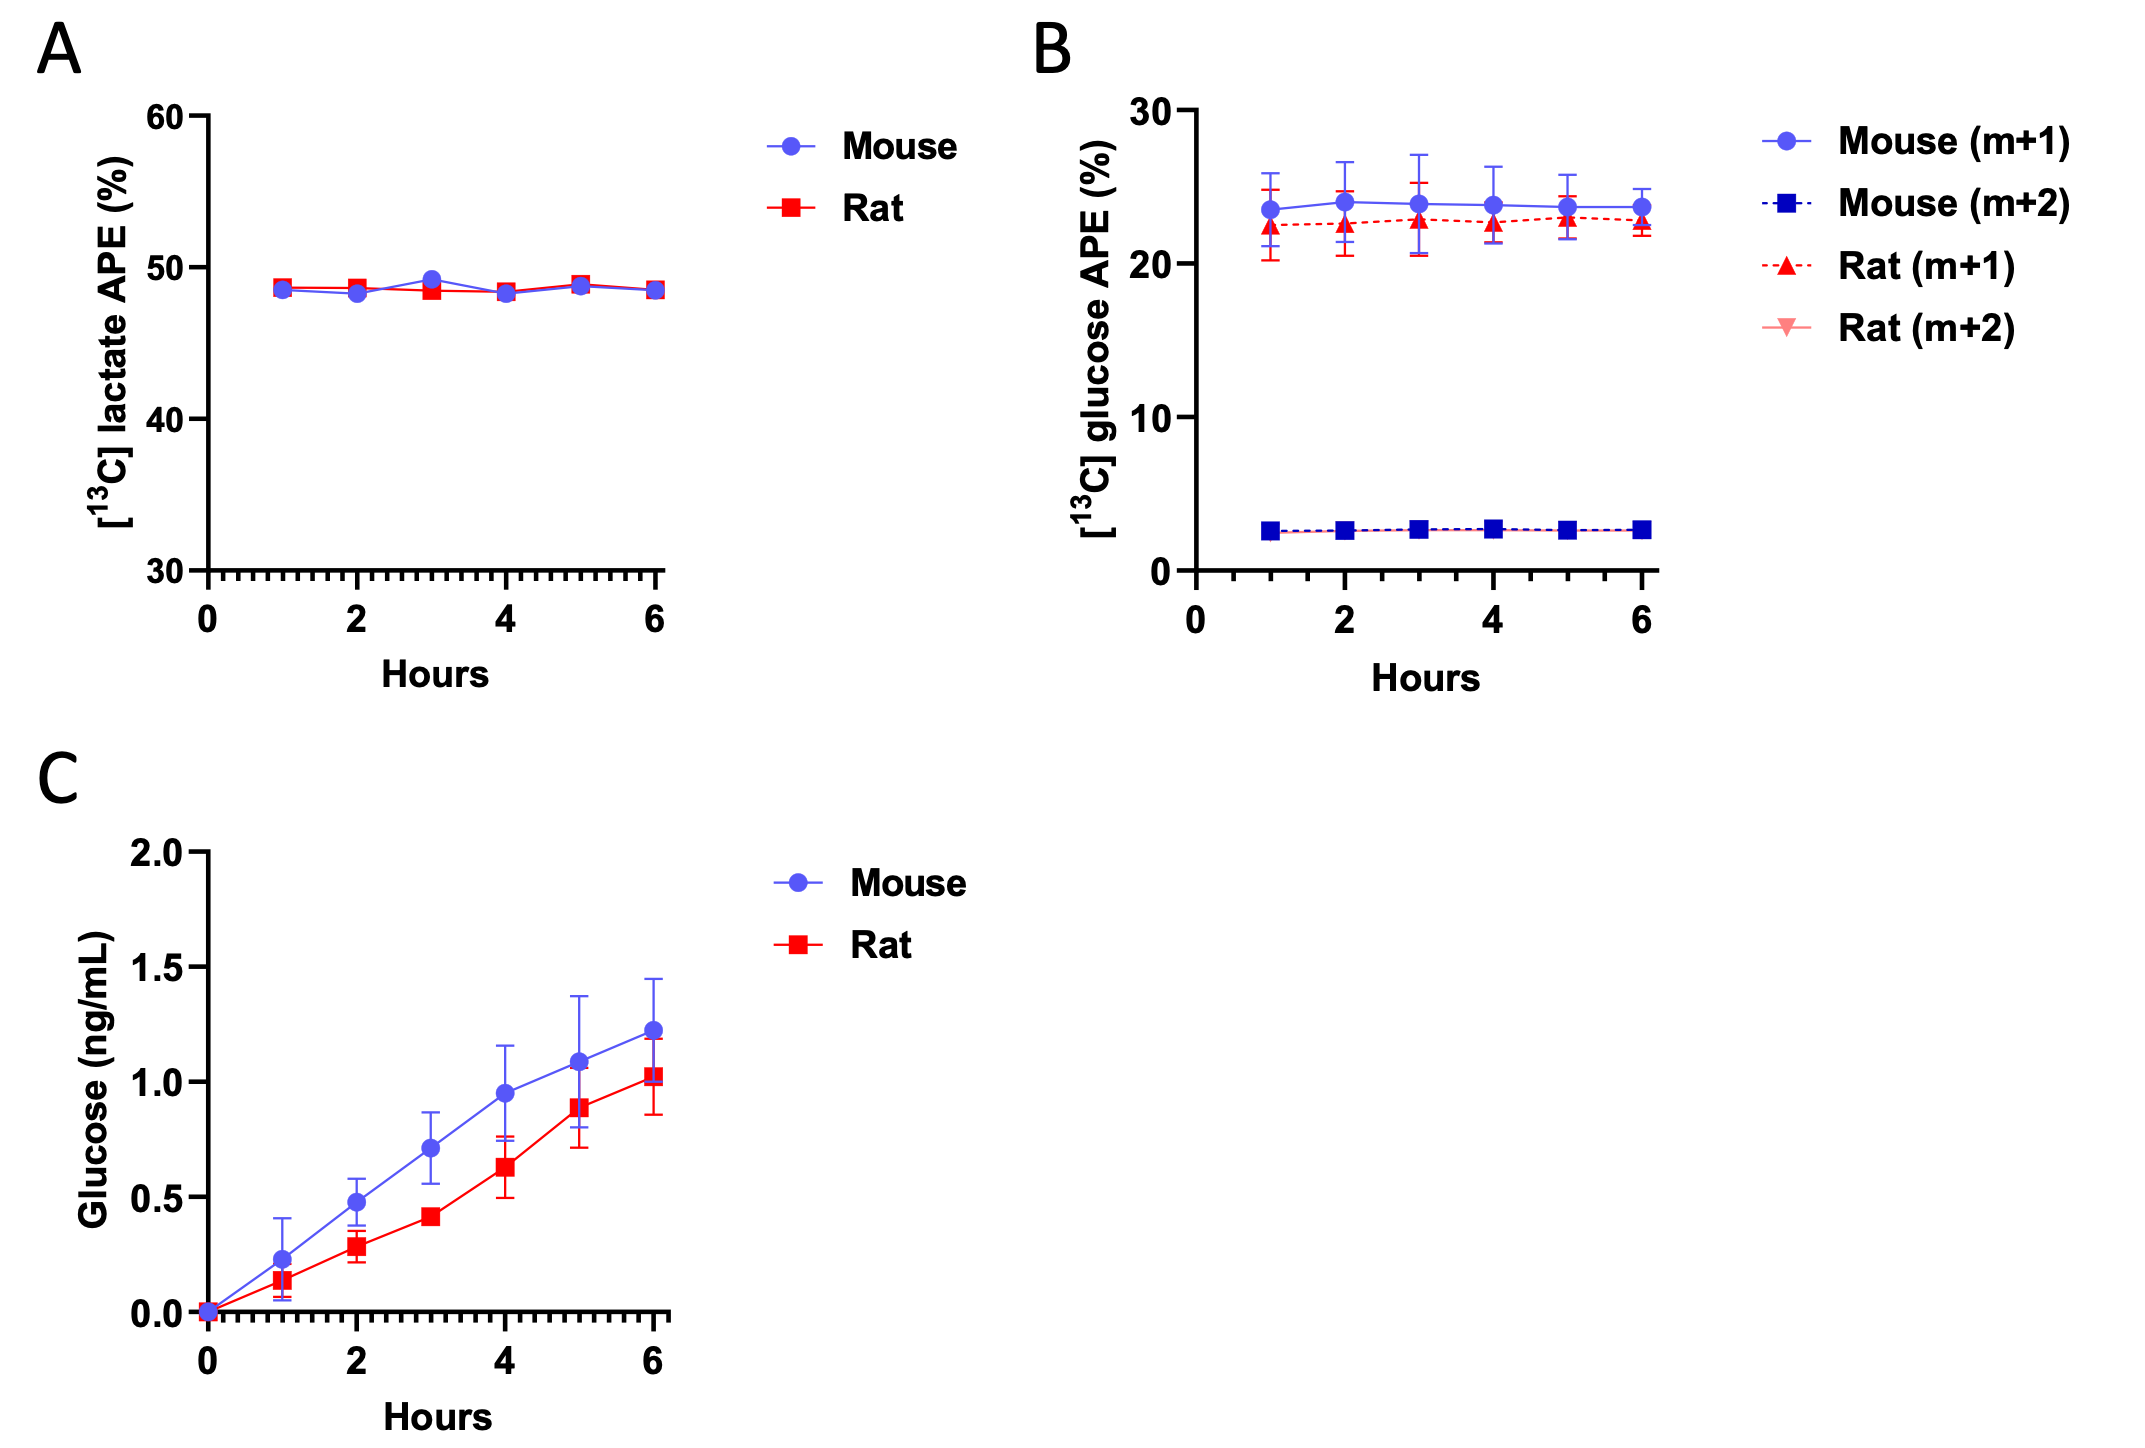 Author Response Figure 8
We very respectfully submit that after 8 prior publications using PINTA called as such (PMID 28986525, 29307489, 29483297, 31545298, 31578240, 32610084, 32132708, 32179679), in addition to several prior publications that utilized PINTA without the acronym, it would not be the most responsible use of animals to try to prove in this manuscript that PINTA is a legitimate means of assessing substrate fluxes in the current manuscript. However, we thank the reviewer for raising the important point regarding assumptions of the method, thereby allowing us to insert data verifying that the key assumptions are met.
- The findings regarding the flux estimates seem to be fully determined by observed differences in gluconeogenesis (as demonstrated in Fig. 4). Usage of more involved approaches for metabolic flux analysis may provide wider-reaching conclusions beyond selected fluxes that appear fully coupled.
Fluxes are back-calculated from total glucose production so that methodologically they are “coupled”, but this does not mean that glucose production will always mirror other flues. For example, in our 2015 manuscript using PINTA – although we had not yet named the method “PINTA” – we measured decreased endogenous glucose production (EGP) simultaneously with increased citrate synthase flux (mitochondrial oxidation, VTCA, which we have subsequently begun to call VCS in recognition of the fact that different reactions in the TCA cycle can proceed at different rates, but the calculation is the same) (Perry et al. Science 2015).
Similarly, another study demonstrated that the same mitochondrial uncoupler (CRMP) increased VCS while EGP decreased in nonhuman primates (Goedeke et al. Sci. Transl. Med. 2019).
These data demonstrate that, while fluxes are back-calculated from EGP with PINTA, the method is fully capable of detecting differences in oxidative fluxes without, or in the opposite direction of, changes in EGP. We very respectfully submit that we are not aware of what a more “involved” approach for metabolic flux analysis would entail, and that after the 8 prior publications listed in response to the previous point, we are not trying to validate PINTA in the current manuscript.
Reviewer #3 (Public Review):
This manuscript addresses a fundamental aspect of mammalian biology referred to as scaling, in which metabolic processes calibrate to the size of the organism. Longstanding observations related to scaling have been established based on rates of oxygen consumption. This manuscript extends these observations to gene expression and metabolic fluxes in order to discover the metabolic pathways that scale with body mass. The analyses are focused on the liver, which is the metabolic hub of the organism. Gene expression levels gleaned from available databases for organisms of varied sizes are analyzed and queried for scaling based on body mass. This analysis reveals that scaling is mainly a characteristic of metabolic genes. These data inform metabolic flux studies in cultured cells, liver slices and whole organisms. These studies demonstrate that scaling of metabolic fluxes occurs, but not out of the context of the whole organism or intact liver (in the form of liver slices). Scaling of metabolic fluxes is not observed in cultured hepatocytes. Overall, this is an interesting line of inquiry. The data are largely correlative in nature but add important texture to traditional characterization of oxygen consumption rates. The application of flux studies is a particular strength because these reflect the true metabolic processes. Enthusiasm was tempered by certain claims that extend beyond data (e.g., the title that suggests that metabolic scaling applies to tissues other than the liver, which was studied), as well as low numbers of biological replicates in some experiments, studies conducted in a single-gender and a writing style that includes excessive technical jargon.
We thank the reviewer for their time spent evaluating the paper, and for their very helpful comments. We agree that “the application of flux studies is a particular strength because these reflect the true metabolic processes.” We agree that the study was focused on liver, although the previous iteration did include a small amount of white adipose tissue flux data, and have edited the manuscript to make clear that this is a liver-focused manuscript. We have now added specific numbers to each figure legend, and have also added in vivo flux measurements in female rats and mice. Additionally, the manuscript has been edited extensively. We have further detailed these modifications in our point-by-point responses to the reviewer.
-
Evaluation Summary:
The study provides evidence that specific transcriptional responses may underpin the observation that metabolic rates often scale inversely with body mass. The conclusions are supported by direct measurement of metabolic fluxes in mouse and rat livers, although generalizations to other settings remain to be rigorously tested. The study has broad implications for researching and studying animal metabolism and physiology.
(This preprint has been reviewed by eLife. We include the public reviews from the reviewers here; the authors also receive private feedback with suggested changes to the manuscript. Reviewer #1 agreed to share their name with the authors.)
-
Reviewer #1 (Public Review):
It is well established that the energy expenditure and metabolic rate of metazoan organisms scale inversely to body mass, based on the measurement of oxygen consumption and caloric intake. However, the underlying regulatory mechanisms for this observation are poorly defined. To investigate whether metabolic scaling is associated with reduced levels of transcription of metabolic genes in larger animals, the authors reviewed existing transcriptional datasets from liver tissues of five animals (mice, rats, monkeys, humans and cattle) with a 30,000-fold range in average adult body weights. They identified a number of metabolic genes in different pathways of central carbon metabolism whose expression inversely scaled with body size, a majority of which required oxygen, NAD/H or ATP/ADP. Metabolic flux studies on …
Reviewer #1 (Public Review):
It is well established that the energy expenditure and metabolic rate of metazoan organisms scale inversely to body mass, based on the measurement of oxygen consumption and caloric intake. However, the underlying regulatory mechanisms for this observation are poorly defined. To investigate whether metabolic scaling is associated with reduced levels of transcription of metabolic genes in larger animals, the authors reviewed existing transcriptional datasets from liver tissues of five animals (mice, rats, monkeys, humans and cattle) with a 30,000-fold range in average adult body weights. They identified a number of metabolic genes in different pathways of central carbon metabolism whose expression inversely scaled with body size, a majority of which required oxygen, NAD/H or ATP/ADP. Metabolic flux studies on intact liver sections, as well as in live animals also revealed decreased liver metabolic fluxes in rats compared to mice. Interestingly, these differences were not observed in primary hepatocyte cultures, indicating that metabolic scaling is primarily regulated by cell-extrinsic factors and tissue context. These are interesting findings and highlight the importance of measuring metabolic processes in vivo. The measurement of cellular metabolic fluxes in different contexts (cultured, ex vivo tissue sections and live animals) is a major strength of this study. The lack of direct evidence that enzyme levels correlate with mRNA, and the absence of both transcriptional and enzyme activity measurements in cultured cells are potential weaknesses.
-
Reviewer #2 (Public Review):
Akingbesote et al. aim to determine the molecular basis of metabolic scaling - the phenomenon that metabolic rates scale inversely with (0.75) body mass. More specifically, they test the hypothesis that expression of genes involved in the regulation of oxygen consumption and substrate metabolism as well as respective fluxes provide a molecular basis for metabolic scaling across five species: mice, rats, monkeys, humans, and cattle. To this end, Akingbesote et al. use publicly available transcriptomics data and identify genes that show decreasing (normalized) expression with increasing mass of organisms. This descriptive analysis is followed by discussing a few relevant examples and (KEGG) pathway enrichment analysis. The authors then used their published PINTA approach with data from their experiments with …
Reviewer #2 (Public Review):
Akingbesote et al. aim to determine the molecular basis of metabolic scaling - the phenomenon that metabolic rates scale inversely with (0.75) body mass. More specifically, they test the hypothesis that expression of genes involved in the regulation of oxygen consumption and substrate metabolism as well as respective fluxes provide a molecular basis for metabolic scaling across five species: mice, rats, monkeys, humans, and cattle. To this end, Akingbesote et al. use publicly available transcriptomics data and identify genes that show decreasing (normalized) expression with increasing mass of organisms. This descriptive analysis is followed by discussing a few relevant examples and (KEGG) pathway enrichment analysis. The authors then used their published PINTA approach with data from their experiments with mice and rats to provide estimates of selected cytosolic and mitochondrial fluxes in vitro, ex vivo, and in vivo; these estimates are then employed in determining if metabolic fluxes scale. The conclusion drawn from these analyses is that estimates of selected fluxes do not differ in vitro between plated hepatocytes of mice and rats, but that differences can be detected using metabolic flux analysis in vivo. As a result, in vivo flux profiling is more relevant to assessing metabolic scaling.
The conclusions are only in part supported by the data and clarifications are needed both with respect to the analysis of transcriptomics data as well as flux estimates:
1. In looking for scaling in gene expression, the authors rely on the assumption that mRNA expression correlates well with protein abundance (citing Schwanhäusser et al., 2011); however, transcripts explain about 40% of variance in protein abundance (this observation holds across multiple species). Hence, the identified patterns based on the transcript data may have little implications for protein abundance or flux.
2. While the procedure used to identify transcripts whose expression scale is clearly described, focusing the enrichment on KEGG pathways can only identify metabolic genes that scale. It would be informative and instructive to investigate if and to what extent genes involved in non-metabolic processes, that affect metabolic rates, also scale.
3. The result on flux ratios and absolute fluxes, based on the equations in Table S1, rely on certain assumptions (e.g. metabolic and isotopic steady state, among the others listed in PINTA); the current presentation does not ensure that all assumptions of PINTA are met in the present setting, so the estimates may be biased, leading to alternative explanations for the observed differences in vivo or the lack thereof in vitro.
4. The findings regarding the flux estimates seem to be fully determined by observed differences in gluconeogenesis (as demonstrated in Fig. 4). Usage of more involved approaches for metabolic flux analysis may provide wider-reaching conclusions beyond selected fluxes that appear fully coupled. -
Reviewer #3 (Public Review):
This manuscript addresses a fundamental aspect of mammalian biology referred to as scaling, in which metabolic processes calibrate to the size of the organism. Longstanding observations related to scaling have been established based on rates of oxygen consumption. This manuscript extends these observations to gene expression and metabolic fluxes in order to discover the metabolic pathways that scale with body mass. The analyses are focused on the liver, which is the metabolic hub of the organism. Gene expression levels gleaned from available databases for organisms of varied sizes are analyzed and queried for scaling based on body mass. This analysis reveals that scaling is mainly a characteristic of metabolic genes. These data inform metabolic flux studies in cultured cells, liver slices and whole …
Reviewer #3 (Public Review):
This manuscript addresses a fundamental aspect of mammalian biology referred to as scaling, in which metabolic processes calibrate to the size of the organism. Longstanding observations related to scaling have been established based on rates of oxygen consumption. This manuscript extends these observations to gene expression and metabolic fluxes in order to discover the metabolic pathways that scale with body mass. The analyses are focused on the liver, which is the metabolic hub of the organism. Gene expression levels gleaned from available databases for organisms of varied sizes are analyzed and queried for scaling based on body mass. This analysis reveals that scaling is mainly a characteristic of metabolic genes. These data inform metabolic flux studies in cultured cells, liver slices and whole organisms. These studies demonstrate that scaling of metabolic fluxes occurs, but not out of the context of the whole organism or intact liver (in the form of liver slices). Scaling of metabolic fluxes is not observed in cultured hepatocytes. Overall, this is an interesting line of inquiry. The data are largely correlative in nature but add important texture to traditional characterization of oxygen consumption rates. The application of flux studies is a particular strength because these reflect the true metabolic processes. Enthusiasm was tempered by certain claims that extend beyond data (e.g., the title that suggests that metabolic scaling applies to tissues other than the liver, which was studied), as well as low numbers of biological replicates in some experiments, studies conducted in a single-gender and a writing style that includes excessive technical jargon.
-
