Low and high frequency intracranial neural signals match in the human associative cortex
Curation statements for this article:-
Curated by eLife

Evaluation Summary:
This paper can provide novel basic science insights into how brain responses at different frequencies signal sensory information. An analysis of intracranial recordings in 121 human participants shows that low-frequency local field potentials and high-frequency (>30 Hz) broadband activity in response to face stimuli have largely similar spatial, functional, and timing properties. However, it is essential to show that the two response types can be reliably disambiguated and to critically discuss the generalizability of the findings.
(This preprint has been reviewed by eLife. We include the public reviews from the reviewers here; the authors also receive private feedback with suggested changes to the manuscript. Reviewer #1 agreed to share their name with the authors.)
This article has been Reviewed by the following groups
Discuss this preprint
Start a discussion What are Sciety discussions?Listed in
- Evaluated articles (eLife)
Abstract
In vivo intracranial recordings of neural activity offer a unique opportunity to understand human brain function. Intracranial electrophysiological (iEEG) activity related to sensory, cognitive or motor events manifests mostly in two types of signals: event-related local field potentials in lower frequency bands (<30 Hz, LF) and broadband activity in the higher end of the frequency spectrum (>30 Hz, High frequency, HF). While most current studies rely exclusively on HF, thought to be more focal and closely related to spiking activity, the relationship between HF and LF signals is unclear, especially in human associative cortex. Here, we provide a large-scale in-depth investigation of the spatial and functional relationship between these 2 signals based on intracranial recordings from 121 individual brains (8000 recording sites). We measure category-selective responses to complex ecologically salient visual stimuli – human faces – across a wide cortical territory in the ventral occipito-temporal cortex (VOTC), with a frequency-tagging method providing high signal-to-noise ratio (SNR) and the same objective quantification of signal and noise for the two frequency ranges. While LF face-selective activity has higher SNR across the VOTC, leading to a larger number of significant electrode contacts especially in the anterior temporal lobe, LF and HF display highly similar spatial, functional, and timing properties. Specifically, and contrary to a widespread assumption, our results point to nearly identical spatial distribution and local spatial extent of LF and HF activity at equal SNR. These observations go a long way towards clarifying the relationship between the two main iEEG signals and reestablish the informative value of LF iEEG to understand human brain function.
Article activity feed
-

-

Author Response
Reviewer #1 (Public Review):
This study investigates low-frequency (LF) local field potentials and high-frequency (HF, >30 Hz) broadband activity in response to the visual presentation of faces. To this end, rhythmic visual stimuli were presented to 121 human participants undergoing depth electrode recordings for epilepsy. Recordings were obtained from the ventral occipito-temporal cortex and brain activity was analyzed using a frequency-tagging approach. The results show that the spatial, functional, and timing properties of LF and HF responses are largely similar, which in part contradicts previous investigations in smaller groups of participants. Together, these findings provide novel and convincing insights into the properties and functional significance of LF and HF brain responses to sensory stimuli.
Strengths
• The properties and functional significance of LF and HF brain responses is a timely and relevant basic science topic.
• The study includes intracranial recordings in a uniquely high number of human participants.
• Using a frequency tagging paradigm for recording and comparing LF and HF responses is innovative and straightforward.
• The manuscript is well-written and well-illustrated, and the interpretation of the findings is mostly appropriate.
Weaknesses
• The writing style of the manuscript sometimes reflects a "race" between the functional significance of LF and HF brain responses and researchers focusing on one or the other. A more neutral and balanced writing style might be more appropriate.
We would like first to thank the reviewer for his/her positive evaluation as well as constructive and helpful comments for revising our manuscript.
Regarding the writing style: we had one major goal in this study, which is to investigate the relationship between low and high frequencies. However, it is fair to say – as we indicate in our introduction section – that low frequency responses are increasingly cast aside in the intracranial recording literature. That is, an increasing proportion of publications simply disregard the evoked electrophysiological response that occur at the low end of the frequency spectrum, to focus exclusively on the high-frequency response (e.g., Crone et al., 2001; Flinker et al., 2011; Mesgarani and Chang, 2012; Bastin et al., 2013; Davidesco et al., 2013; Kadipasoaglu et al., 2016; 2017; Shum et al., 2013; Golan et al., 2016; 2017; Grossman et al., 2019; Wang et al., 2021, see list of references at the end of the reply).
Thus, on top of the direct objective comparison between the two types of signals that our study originally provides, we think that it is fair to somehow reestablish the functional significance of low frequency activity in intracranial recording studies.
The writing style reflects that perspective rather than a race between the functional significance of LF and HF brain responses.
• It remains unclear whether and how the current findings generalize to the processing of other sensory stimuli and paradigms. Rhythmic presentation of visual stimuli at 6 Hz with face stimuli every five stimuli (1.2 Hz) represents a very particular type of sensory stimulation. Stimulation with other stimuli, or at other frequencies likely induce different responses. This important limitation should be appropriately acknowledged in the manuscript.
We agree with the Reviewer 1 (see also Reviewer 2) that it is indeed important to discuss whether the current findings generalize to the other brain functions and to previous findings obtained with different methodologies. We argue that our original methodological approach allows maximizing the generalizability of our findings.
First, frequency-tagging approach is a longstanding stimulation method, starting from the 1930s (i.e., well before standard evoked potential recording methods; Adrian & Matthews, 1934; intracranially: Kamp et al., 1960) and widely used in vison science (Regan, 1989; Norcia et al., 2015) but also in other domains (e.g., auditory, somato-sensory stimulation). More importantly, this approach does not only significantly increase the signal-to-noise ratio of neural responses, but the objectivity and the reliability of the LF-HF signal comparison (objective identification and quantification of the responses, very similar analysis pipelines).
Second, regarding the frequency of stimulation, our scalp EEG studies with high-level stimuli (generally faces) have shown that the frequency selection has little effect on the amplitude and the shape of the responses, as long as the frequency is chosen within a suitable range for the studied function (Alonso-Prieto et al., 2013). Regarding the paradigm used specifically in the present study (originally reported in Rossion et al., 2015 and discussed in detail for iEEG studies in Rossion et al., 2018), it has been validated with a wide range of approaches (EEG, MEG, iEEG, fMRI) and populations (healthy adults, patients, children and infants), identifying typically lateralized occipito-temporal face-selective neural activity with a peak in the middle section of the lateral fusiform gyrus (Jonas et al., 2016; Hagen et al., 2020 in iEEG; Gao et al., 2018 in fMRI).
Importantly, specifically for the paradigm used in the present study, our experiments have shown that the neural face-selective responses are strictly identical whether the faces are inserted at periodic or non-periodic intervals within the train of nonface objects (Quek & Rossion, 2017), that the ratio of periodicity for faces vs. objects (e.g., 1/5, 1/7 … 1/11) does not matter as long as the face-selective responses do not overlap in time (Retter & Rossion, 2016; Retter et al., 2020) and that the responses are identical across a suitable range of base frequency rates (Retter et al., 2020).
Finally, we fully acknowledge that the category-selective responses would be different in amplitude and localization for other types of stimuli, as also shown in our previous EEG (Jacques et al., 2016) and iEEG (Hagen et al., 2020) studies. Yet, as indicated in our introduction and discussion section, there are many advantages of using such a highly familiar and salient stimulus as faces, and in the visual domain at least we are confident that our conclusions regarding the relationship between low and high frequencies would generalize to other categories of stimuli.
We added a new section on the generalizability of our findings at the end of the Discussion, p.32-33 (line 880) (see also Reviewer 2’s comments). Please see above in the “essential revisions” for the full added section.
Reviewer #2 (Public Review):
The study by Jacques and colleagues examines two types of signals obtained from human intracortical electroencephalography (iEEG) measures, the steady-state visual evoked potential and a broadband response extending to higher frequencies (>100 Hz). The study is much larger than typical for iEEG, with 121 subjects and ~8,000 recording sites. The main purpose of the study is to compare the two signals in terms of spatial specificity and stimulus tuning (here, to images of faces vs other kinds of images).
The experiments consisted of subjects viewing images presented 6 times per second, with every 5th image depicting a face. Thus the stimulus frequency is 6 Hz and the face image frequency is 1.2 Hz. The main measures of interest are the responses at 1.2 Hz and harmonics, which indicate face selectivity (a different response to the face images than the other images). To compare the two types of signals (evoked potential and broadband), the authors measure either the voltage fluctuations at 1.2 Hz and harmonics (steady-state visually evoked potential) or the fluctuations of broadband power at these same frequencies.
Much prior work has led to the interpretation of the broadband signal as the best iEEG correlate of spatially local neuronal activity, with some studies even linking the high-frequency broadband signal to the local firing rate of neurons near the electrode. In contrast, the evoked potential is often thought to arise from synchronous neural activity spread over a relatively large spatial extent. As such, the broadband signal, particularly in higher frequencies (here, 30-160 Hz) is often believed to carry more specific information about brain responses, both in terms of spatial fidelity to the cortical sources (the cortical point spread function) and in terms of functional tuning (e.g., preference for one stimulus class over another). This study challenges these claims, particularly, the first one, and concludes that (1) the point spread functions of the two signals are nearly identical, (2) the cortical locations giving rise to the two signals are nearly identical, and (3) the evoked potential has a considerably higher signal-to-noise ratio.
These conclusions are surprising, particularly the first one (same point spread functions) given the literature which seems to have mostly concluded that the broadband signal is more local. As such, the findings pose a challenge to the field in interpreting the neuronal basis of the various iEEG signals. The study is large and well done, and the analysis and visualizations are generally clear and convincing. The similarity in cortical localization (which brain areas give rise to face-selective signals) and in point-spread functions are especially clear and convincing.
We thank the reviewer for his/her fair and positive evaluation of our work and helpful comments.
Although the reviewer does not disagree or criticize our methodology, we would like to reply to their comment about the surprising nature of our findings (particularly the similar spatial extent of LF and HF). In fact, we think that there is little evidence for a difference in ‘point-spread’ function in the literature, and thus that these results are not really that surprising. As we indicate in the original submission (discussion), in human studies, to our knowledge, the only direct comparisons of spatial extent of LF responses and HF is performed by counting and reporting the number of significant electrodes showing a significant response in the two signals (Miller et al., 2007; Crone et al., 1998; Pfurtscheller et al., 2003; see list of references at the end of the reply). Overall, these studies find a smaller number of significant electrodes with HF compared to LF. Intracranial EEG studies pointing to a more focal origin of HF activity generally cite one or several of these publications (e.g. Shum et al., 2013). In the current study, we replicate this finding and provide additional analyses showing that it is confounded with SNR differences across signals and created artificially by the statistical threshold. When no threshold is used and a more appropriate measure of spatial extent is computed (here, spatial extent at half maximum), we find no difference between the 2 signals, except for a small difference in the left anterior temporal lobe. Moreover, in intracranial EEG literature, the localness of the HF response is often backed by the hypothesis that HF is a proxy for firing rate. Indeed, since spikes are supposed to be local, it is implied that HF has to be local as well. However, while clear correlations have been found between HF measured with micro-electrodes and firing rate (e.g., Nir et al. 2007; Manning et al., 2009), there is no information on how local the activity measured at these electrodes is, and no evidence that the HF signal is more local than LF signal in these recordings. Last, the link between (local?) firing rate and HF/broadband signal has been show using micro-electrodes which vastly differ in size compared to macro-electrodes. The nature of the relationship and its spatial properties may differ between micro-electrodes and macro-electrodes used in ECOG/SEEG recordings.
We feel these points were all already discussed thoroughly in the original submission of the manuscript (see p. 28-30 in the revised manuscript) and did not modify the revised manuscript.
The lack of difference between the two signals (other than SNR), might ordinarily raise suspicion that there is some kind of confound, meaning that the two measures are not independent. Yet there are no obvious confounds: in principle, the broadband measure could reflect the high-frequency portion of the evoked response, rather than a separate, non-phase locked response to the signal. However, this is unlikely, given the rapid fall-off in the SSVEP at amplitudes much lower than the 30 Hz low-frequency end of the broadband measure. And the lack of difference between the two signals should not be confused for a null result: both signals are robust and reliable, and both are largely found in the expected parts of the brain for face selectivity (meaning the authors did not fail to measure the signals - it just turns out that the two measures have highly similar characteristics).
The current reviewer and reviewer #3 both commented or raised concerned about the fact that HF signal as measured in our study might be contaminated by LF evoked response, thereby explaining our findings of a strong similarity between the 2 signals.
This was actually a potential (minor) concern given the time-frequency (wavelet) parameters used in the original manuscript. Indeed, the frequency bandwidth (as measured as half width at half maximum) of the wavelet used at the lower bound (30Hz) of the HF signal extended to 11Hz (i.e., half width at half maximum = 19 Hz). At 40Hz, the bandwidth extended to 24Hz (i.e., HWHM = 16 Hz). While low-frequency face-selective responses at that range (above 16 Hz) are negligible (see e.g., Retter & Rossion, 2016; and data below for the present study), they could have potentially slightly contaminated the high frequency activity indeed.
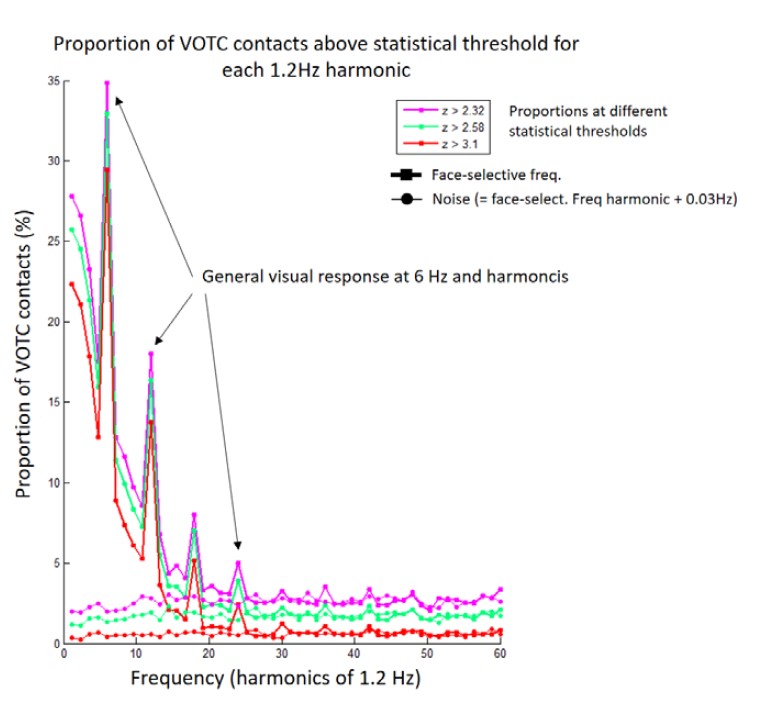
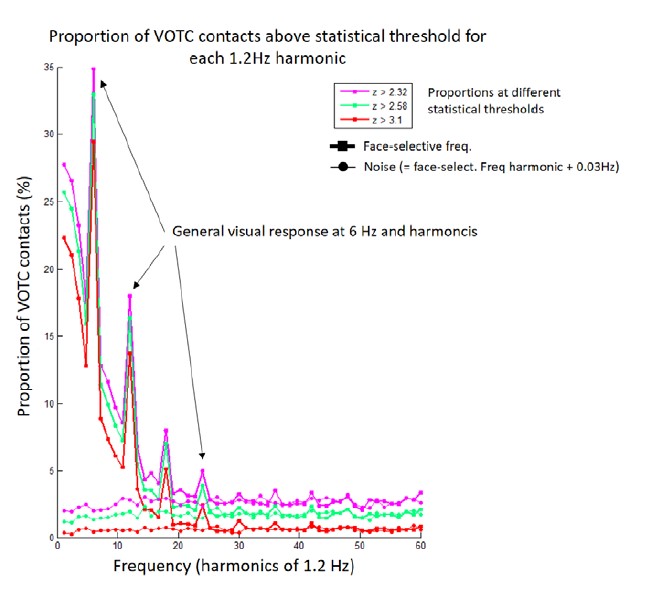
To fully ensure that our findings could not be explained by such a contamination, we recomputed the HF signal using wavelets with a smaller frequency bandwidth and changed the high frequency range to 40-160 Hz. This ensures that the lowest frequency included in the HF signal (defined as the bottom of the frequency range minus half of the frequency bandwidth, i.e., half width at half maximum) is 30 Hz, which is well above the highest significant harmonic of face-selective response in our frequency-tagging experiment (i.e., 22.8 Hz ; defined as the harmonic of face frequency where, at group level, the number of recording contacts with a significant response was not higher than the number of significant contacts detected for noise in bins surrounding harmonics of the face frequency, see figure below). Thus, the signal measured in the 40-160 Hz range is not contaminated by lower frequency evoked responses.
We recomputed all analyses and statistics as reported in the original manuscript with the new HF definition. Overall, this change had very little impact on the findings, except for slightly lower correlation between HF and LF (in Occipital and Anterior temporal lobe) when using single recording contacts as unit data points (Note that we slightly modified the way we compute the maximal expected correlation. Originally we used the test-retest reliability averaged over LF and HF; in the revised version we use the lower reliability value of the 2 signals, which is more correct since the lower reliability is the true upper limit of the correlation). This indicates that the HF activity was mostly independent from phase-locked LF signal already in the original submission. However, since the analyses with the revised time-frequency analyses parameters enforce this independence, the revised analyses are reported as the main analyses in the manuscript.
The manuscript was completely revised accordingly and all figures (main and supplementary) were modified to reflect these new analyses. We also extended the methods section on HF analyses (p. 37) to indicate that HF parameters were selected to ensure independence of the HF signal from the LF evoked response, and provide additional information on wavelet frequency bandwidth.
There are some limitations to the possible generalizability of the conclusions drawn here. First, all of the experiments are of the same type (steady-state paradigm). It could be that with a different experimental design (e.g., slower and/or jittered presentation) the results would differ. In particular, the regularity of the stimulation (6 Hz images, 1.2 Hz faces) might cause the cortex to enter a rhythmic and non-typical state, with more correlated responses across signal types. Nonetheless, the steady-state paradigm is widely used in research, and even if the conclusions turn out to hold only for this paradigm, they would be important. (And of course, they might generalize beyond it.)
We understand the concern of the reviewer and appreciate the last statement about the wide use of the steady-state paradigm and the importance of our conclusions. Above that, we are very confident that our results can be generalized to slower and jittered presentations. Indeed, with this paradigm in particular, we have compared different frequency rates and periodic and nonperiodic stimulations in previous studies (Retter & Rossion, 2016; Quek et al., 2017; Retter et al., 2020). Importantly, specifically for the paradigm used in the present study, the neural face-selective responses are strictly identical whether the faces are inserted at periodic or non-periodic intervals within the train of nonface objects (Quek & Rossion, 2017), showing that the regularity of stimulation does not cause a non-typical state.
Please see our reply above to essential revisions and reviewer 1, in which we fully address this issue, as well as the revised discussion section (p. 32-33).
A second limitation is the type of stimulus and neural responses - images of faces, face-selectivity of neural responses. If the differences from previous work on these types of signals are due to the type of experiment - e.g., finger movements and motor cortex, spatial summation and visual cortex - rather than to the difference in sample size of type of analysis, then the conclusions about the similarity of the two types of signals would be more constrained. Again, this is not a flaw in the study, but rather a possible limitation in the generality of the conclusions.
This is a good point, which has been discussed above also. Please note that this was already partly discussed in the original manuscript when discussing the potential factors explaining the spatial differences between our study and motor cortex studies:
“Second, the hypothesis for a more focal HF compared to LF signals is mostly supported by recordings performed in a single region, the sensorimotor cortex (Miller et al., 2007; Crone et al., 1998; Pfurtscheller et al., 2003; Hermes et al., 2012), which largely consist of primary cortices. In contrast, here we recorded across a very large cortical region, the VOTC, composed of many different areas with various cortical geometries and cytoarchitectonic properties. Moreover, by recording higher-order category-selective activity, we measured activity confined to associative areas. Both neuronal density (Collins et al., 2010; Turner et al., 2016) and myelination (Bryant and Preuss, 2018) are substantially lower in associative cortices than in primary cortices in primates, and these factors may thus contribute to the lack of spatial extent difference between HF and LF observed here as compared to previous reports.” (p. 29-30).
Also in the same section (p. 30) we refer to the type of signals compared in previous motor cortex studies:
“Third, previous studies compared the spatial properties of an increase (relative to baseline) in HF amplitude to the spatial properties of a decrease (i.e. event-related desynchronization) of LF amplitude in the alpha and beta frequency ranges (Crone et al.,1998; 2001; Pfurtscheller et al., 2003; Miller et al., 2007; Hermes et al., 2012). This comparison may be unwarranted due to likely different mechanisms, brain networks and cortical layers involved in generating neuronal increases and decreases (e.g., input vs. modulatory signal, Pfurtscheller and Lopes da Silva, 1999; Schroeder and Lakatos, 2009). In the current study, our frequency-domain analysis makes no assumption about the increase and decrease of signals by face relative to non-face stimuli.”
In the original submission, we also acknowledged that the functional correspondence between LF and HF signals is not at ceiling (p. 31) :
“We acknowledge that the correlations found here are not at ceiling and that there were also slight offsets in the location of maximum amplitude across signals along electrode arrays (Figures 5 and 6). This lack of a complete functional overlap between LF and HF is also in line with previous reports of slightly different selectivity and functional properties across these signals, such as a different sensitivity to spatial summation (Winawer et al., 2013), to selective attention (Davidesko et al., 2013) or to stimulus repetition (Privmann et al., 2011). While part of these differences may be due to methodological differences in signal quantification, they also underline that these signals are not always strongly related, due to several factors. For instance, although both signals involve post-synaptic (i.e., dentritic) neural events, they nevertheless have distinct neurophysiological origins (that are not yet fully understood; see Buszaki, 2012; Leszczyński et al., 2020; Miller et al., 2009). In addition, these differing neurophysiological origins may interact with the precise setting of the recording sites capturing these signals (e.g., geometry/orientation of the neural sources relative to the recording site, cortical depth in which the signals are measured).”
Additional arguments regarding the generalizability can be found in the added section of the discussion as mentioned above.
Finally, the study relies on depth electrodes, which differs from some prior work on broadband signals using surface electrodes. Depth electrodes (stereotactic EEG) are in quite wide use so this too is not a criticism of the methods. Nonetheless, an important question is the degree to which the conclusions generalize, and surface electrodes, which tend to have higher SNR for broadband measures, might, in principle, show a different pattern than that observed her.
This is an interesting point, which cannot be addressed in our study obviously. We agree with the reviewer’s point. However, in contrast to ECoG, which is restricted to superficial cortical layers and gyri, SEEG has the advantages of sampling all cortical layers and a wide range anatomical structures (gyri, sulci, deep structures as medial temporal structures. Therefore, we believe that using SEEG ensures maximal generalizability of our findings. Overall, the relatively low spatial resolution of these 2 recording methods (i.e., several millimeters) compared the average cortical thickness (~2-3 mm) makes it very unlikely that SEEG and ECOG would reveal different patterns of LF-HF functional correspondence.
We added this point in a new section on the generalizability of our findings at the end of the Discussion (p.33, line 896).
Overall, the large study and elegant approach have led to some provocative conclusions that will likely challenge near-consensus views in the field. It is an important step forward in the quantitate analysis of human neuroscience measurements.
We sincerely thank the reviewer for his/her appreciation of our work
Reviewer #3 (Public Review):
Jacques et al. aim to assess properties of low and high-frequency signal content in intracranial stereo encephalography data in the human associative cortex using a frequency tagging paradigm using face stimuli. In the results, a high correspondence between high- and low-frequency content in terms of concordant dynamics is highlighted. The major critique is that the assessment in the way it was performed is not valid to disambiguate neural dynamics of responses in low- and high-frequency frequency bands and to make general claims about their selectivity and interplay.
The periodic visual stimulation induces a sharp non-sinusoidal transient impulse response with power across all frequencies (see Fig. 1D time-frequency representation). The calculated mean high-frequency amplitude envelope will therefore be dependent on properties of the used time-frequency calculation as well as noise level (e.g. 1/f contributions) in the chosen frequency band, but it will not reflect intrinsic high-frequency physiology or dynamics as it reflects spectral leakage of the transient response amplitude envelope. For instance, one can generate a synthetic non-sinusoidal signal (e.g., as a sum of sine + a number of harmonics) and apply the processing pipeline to generate the LF and HF components as illustrated in Fig. 1. This will yield two signals which will be highly similar regardless of how the LF component manifests. The fact that the two low and high-frequency measures closely track each other in spatial specificity and amplitudes/onset times and selectivity is due to the fact that they reflect exactly the same signal content. It is not possible with the measures as they have been calculated here to disambiguate physiological low- and high-frequency responses in a general way, e.g., in the absence of such a strong input drive.
The reviewer expresses strong concerns that our measure of HF activity is merely a reflection of spectral leakage from (lower-frequencies) evoked responses. In other words, physiological HF activity would not exist in our dataset and would be artificially created by our analyses. We should start by mentioning that this comment is in no way specific to our study, but could in fact be directed at all electrophysiological studies measuring stimulus-driven responses in higher frequency bands.
Reviewer 2 also commented on the possible contamination of evoked response in HF signal.
This was actually a potential (minor) concern given the time-frequency (wavelet) parameters used in the original manuscript. Indeed, the frequency bandwidth (as measured as half width at half maximum) of the wavelet used at the lower bound (30Hz) of the HF signal extended to 11Hz (i.e., half width at half maximum = 19 Hz). At 40Hz, the bandwidth extended to 24Hz (i.e., HWHM = 16 Hz). While low-frequency face-selective responses at that range (above 16 Hz) are negligible (see e.g., Retter & Rossion, 2016; and data below for the present study), they could have potentially slightly contaminated the high frequency activity indeed.
To ensure that our findings cannot be explained by such a contamination, we recomputed the HF signal using wavelet with a smaller frequency bandwidth and changed the frequency range to 40-160Hz. This ensures that the lowest frequency included in the HF signal (defined as the bottom of the frequency range minus half of the frequency bandwidth, i.e., half width at half maximum) was 30 Hz. This was well above the highest significant harmonic of face-selective response in our FPVS experiment which was 22.8 Hz (defined as the harmonic of face frequency where, at group level, the number of recording contacts with a significant response was not higher than the number of significant contacts detected for noise in bins surrounding harmonics of the face frequency, see figure below). This ensures that the signal measured in the 40-160Hz range is not contaminated by lower frequency evoked responses.
We recomputed all analyses and statistics from the manuscript with the new HF definition. Overall, this change had very little impact on the findings, except for slightly lower correlation between HF and LF (in Occipital and Anterior temporal lobe) when using single recording contacts as unit data points (Note that we slightly modified the way we compute the maximal expected correlation. Originally we used the test-retest reliability averaged over LF and HF; now we use the lower reliability value of the 2 signals, which is more correct since the lower reliability is the true upper limit of the correlation) This indicates that the HF activity was mostly independent from phase-locked LF signal already in the original submission. However, since the analyses with the revised time-frequency analyses parameters enforces this independence, we choose to keep the revised analyses as the main analyses in the manuscript.
The manuscript was completely revised accordingly and all figures (main and supplementary) were modified to reflect the new analyses. We also extended the method section on HF analyses (p. 37) to indicate that HF parameters were selected to ensure independence of the HF signal from the LF evoked response, and provide additional information on wavelet frequency bandwidth.
We believe our change in the time-frequency parameters and frequency range (40-160 Hz), the supplementary analyses using 80-160 Hz signal (per request of reviewer #2; see Figure 5 – figure supplement 4 and 5) and the fact that harmonics of the face frequency signal are not observed beyond ~23Hz, provide sufficient assurances that our findings are not driven by a contamination of HF signal by evoked/LF responses (i.e., spectral leakage).
With respect to the comment of the reviewer on the 1/f contributions on frequency band computation, as indicated in the original manuscript, the HF amplitude envelope is converted to percent signal change, separately for each frequency bin over the HF frequency range, BEFORE averaging across frequency bands. This steps works as a normalization step to remove the 1/f bias and ensures that each frequency in the HF range contributes equally to the computed HF signal. This was added to the method section (HF analysis, p 38 (line 1038) ): ” This normalization step ensures that each frequency in the HF range contributes equally to the computed HF signal, despite the overall 1/f relationship between amplitude and frequency in EEG.”
The connection of the calculated measures to ERPs for the low-frequency and population activity for the high-frequency measures for their frequency tagging paradigm is not clear and not validated, but throughout the text they are equated, starting from the introduction.
The frequency-tagging approach is widely used in the electrophysiology literature (Norcia et al., 2015) and as such requires no further validation. In the case our particular design, the connection between frequency-domain and time-domain representation for low-frequencies has been shown in numerous of our publications with scalp EEG (Rossion et al., 2015; Jacques et al., 2016; Retter and Rossion, 2016; Retter et al., 2020). FPVS sequences can be segmented around the presentation of the face image (just like in a traditional ERP experiment) and averaged in the time-domain to reveal ERPs (e.g., Jacques et al., 2016; Retter and Rossion, 2016; Retter et al., 2020). Face-selectivity of these ERPs can be isolated by selectively removing the base rate frequencies through notch-filtering (e.g., Retter and Rossion, 2016; Retter et al., 2020). Further, we have shown that the face-selective ERPs generated in such sequences are independent of the periodicity, or temporal predictability, of the face appearance (Queck et al. 2017) and to a large extent to the frequency of face presentation (i.e., unless faces are presented too close to each other, i.e., below 400 ms interval; Retter and Rossion, 2016). The high frequency signal in our study is measured in the same manner as in other studies and we simply quantify the periodic amplitude modulation of the HF signal. HF responses in frequency-tagging paradigm has been measured before (e.g., Winawer et al., 2013). In the current manuscript, Figure 1 provides a rational and explanation of the methodology. We also think that our manuscript in itself provides a form of validation for the quantification of HF signal in our particular frequency-tagging setup.
-
Evaluation Summary:
This paper can provide novel basic science insights into how brain responses at different frequencies signal sensory information. An analysis of intracranial recordings in 121 human participants shows that low-frequency local field potentials and high-frequency (>30 Hz) broadband activity in response to face stimuli have largely similar spatial, functional, and timing properties. However, it is essential to show that the two response types can be reliably disambiguated and to critically discuss the generalizability of the findings.
(This preprint has been reviewed by eLife. We include the public reviews from the reviewers here; the authors also receive private feedback with suggested changes to the manuscript. Reviewer #1 agreed to share their name with the authors.)
-
Reviewer #1 (Public Review):
This study investigates low-frequency (LF) local field potentials and high-frequency (HF, >30 Hz) broadband activity in response to the visual presentation of faces. To this end, rhythmic visual stimuli were presented to 121 human participants undergoing depth electrode recordings for epilepsy. Recordings were obtained from the ventral occipito-temporal cortex and brain activity was analyzed using a frequency-tagging approach. The results show that the spatial, functional, and timing properties of LF and HF responses are largely similar, which in part contradicts previous investigations in smaller groups of participants. Together, these findings provide novel and convincing insights into the properties and functional significance of LF and HF brain responses to sensory stimuli.
Strengths
• The properties and …Reviewer #1 (Public Review):
This study investigates low-frequency (LF) local field potentials and high-frequency (HF, >30 Hz) broadband activity in response to the visual presentation of faces. To this end, rhythmic visual stimuli were presented to 121 human participants undergoing depth electrode recordings for epilepsy. Recordings were obtained from the ventral occipito-temporal cortex and brain activity was analyzed using a frequency-tagging approach. The results show that the spatial, functional, and timing properties of LF and HF responses are largely similar, which in part contradicts previous investigations in smaller groups of participants. Together, these findings provide novel and convincing insights into the properties and functional significance of LF and HF brain responses to sensory stimuli.
Strengths
• The properties and functional significance of LF and HF brain responses is a timely and relevant basic science topic.
• The study includes intracranial recordings in a uniquely high number of human participants.
• Using a frequency tagging paradigm for recording and comparing LF and HF responses is innovative and straightforward.
• The manuscript is well-written and well-illustrated, and the interpretation of the findings is mostly appropriate.Weaknesses
• The writing style of the manuscript sometimes reflects a "race" between the functional significance of LF and HF brain responses and researchers focusing on one or the other. A more neutral and balanced writing style might be more appropriate.
• It remains unclear whether and how the current findings generalize to the processing of other sensory stimuli and paradigms. Rhythmic presentation of visual stimuli at 6 Hz with face stimuli every five stimuli (1.2 Hz) represents a very particular type of sensory stimulation. Stimulation with other stimuli, or at other frequencies likely induce different responses. This important limitation should be appropriately acknowledged in the manuscript. -
Reviewer #2 (Public Review):
The study by Jacques and colleagues examines two types of signals obtained from human intracortical electroencephalography (iEEG) measures, the steady-state visual evoked potential and a broadband response extending to higher frequencies (>100 Hz). The study is much larger than typical for iEEG, with 121 subjects and ~8,000 recording sites. The main purpose of the study is to compare the two signals in terms of spatial specificity and stimulus tuning (here, to images of faces vs other kinds of images).
The experiments consisted of subjects viewing images presented 6 times per second, with every 5th image depicting a face. Thus the stimulus frequency is 6 Hz and the face image frequency is 1.2 Hz. The main measures of interest are the responses at 1.2 Hz and harmonics, which indicate face selectivity (a …
Reviewer #2 (Public Review):
The study by Jacques and colleagues examines two types of signals obtained from human intracortical electroencephalography (iEEG) measures, the steady-state visual evoked potential and a broadband response extending to higher frequencies (>100 Hz). The study is much larger than typical for iEEG, with 121 subjects and ~8,000 recording sites. The main purpose of the study is to compare the two signals in terms of spatial specificity and stimulus tuning (here, to images of faces vs other kinds of images).
The experiments consisted of subjects viewing images presented 6 times per second, with every 5th image depicting a face. Thus the stimulus frequency is 6 Hz and the face image frequency is 1.2 Hz. The main measures of interest are the responses at 1.2 Hz and harmonics, which indicate face selectivity (a different response to the face images than the other images). To compare the two types of signals (evoked potential and broadband), the authors measure either the voltage fluctuations at 1.2 Hz and harmonics (steady-state visually evoked potential) or the fluctuations of broadband power at these same frequencies.
Much prior work has led to the interpretation of the broadband signal as the best iEEG correlate of spatially local neuronal activity, with some studies even linking the high-frequency broadband signal to the local firing rate of neurons near the electrode. In contrast, the evoked potential is often thought to arise from synchronous neural activity spread over a relatively large spatial extent. As such, the broadband signal, particularly in higher frequencies (here, 30-160 Hz) is often believed to carry more specific information about brain responses, both in terms of spatial fidelity to the cortical sources (the cortical point spread function) and in terms of functional tuning (e.g., preference for one stimulus class over another). This study challenges these claims, particularly, the first one, and concludes that (1) the point spread functions of the two signals are nearly identical, (2) the cortical locations giving rise to the two signals are nearly identical, and (3) the evoked potential has a considerably higher signal-to-noise ratio.
These conclusions are surprising, particularly the first one (same point spread functions) given the literature which seems to have mostly concluded that the broadband signal is more local. As such, the findings pose a challenge to the field in interpreting the neuronal basis of the various iEEG signals. The study is large and well done, and the analysis and visualizations are generally clear and convincing. The similarity in cortical localization (which brain areas give rise to face-selective signals) and in point-spread functions are especially clear and convincing.
The lack of difference between the two signals (other than SNR), might ordinarily raise suspicion that there is some kind of confound, meaning that the two measures are not independent. Yet there are no obvious confounds: in principle, the broadband measure could reflect the high-frequency portion of the evoked response, rather than a separate, non-phase locked response to the signal. However, this is unlikely, given the rapid fall-off in the SSVEP at amplitudes much lower than the 30 Hz low-frequency end of the broadband measure. And the lack of difference between the two signals should not be confused for a null result: both signals are robust and reliable, and both are largely found in the expected parts of the brain for face selectivity (meaning the authors did not fail to measure the signals - it just turns out that the two measures have highly similar characteristics).
There are some limitations to the possible generalizability of the conclusions drawn here. First, all of the experiments are of the same type (steady-state paradigm). It could be that with a different experimental design (e.g., slower and/or jittered presentation) the results would differ. In particular, the regularity of the stimulation (6 Hz images, 1.2 Hz faces) might cause the cortex to enter a rhythmic and non-typical state, with more correlated responses across signal types. Nonetheless, the steady-state paradigm is widely used in research, and even if the conclusions turn out to hold only for this paradigm, they would be important. (And of course, they might generalize beyond it.) A second limitation is the type of stimulus and neural responses - images of faces, face-selectivity of neural responses. If the differences from previous work on these types of signals are due to the type of experiment - e.g., finger movements and motor cortex, spatial summation and visual cortex - rather than to the difference in sample size of type of analysis, then the conclusions about the similarity of the two types of signals would be more constrained. Again, this is not a flaw in the study, but rather a possible limitation in the generality of the conclusions. Finally, the study relies on depth electrodes, which differs from some prior work on broadband signals using surface electrodes. Depth electrodes (stereotactic EEG) are in quite wide use so this too is not a criticism of the methods. Nonetheless, an important question is the degree to which the conclusions generalize, and surface electrodes, which tend to have higher SNR for broadband measures, might, in principle, show a different pattern than that observed her.
Overall, the large study and elegant approach have led to some provocative conclusions that will likely challenge near-consensus views in the field. It is an important step forward in the quantitate analysis of human neuroscience measurements.
-
Reviewer #3 (Public Review):
Jacques et al. aim to assess properties of low and high-frequency signal content in intracranial stereo encephalography data in the human associative cortex using a frequency tagging paradigm using face stimuli. In the results, a high correspondence between high- and low-frequency content in terms of concordant dynamics is highlighted. The major critique is that the assessment in the way it was performed is not valid to disambiguate neural dynamics of responses in low- and high-frequency frequency bands and to make general claims about their selectivity and interplay.
The periodic visual stimulation induces a sharp non-sinusoidal transient impulse response with power across all frequencies (see Fig. 1D time-frequency representation). The calculated mean high-frequency amplitude envelope will therefore be …
Reviewer #3 (Public Review):
Jacques et al. aim to assess properties of low and high-frequency signal content in intracranial stereo encephalography data in the human associative cortex using a frequency tagging paradigm using face stimuli. In the results, a high correspondence between high- and low-frequency content in terms of concordant dynamics is highlighted. The major critique is that the assessment in the way it was performed is not valid to disambiguate neural dynamics of responses in low- and high-frequency frequency bands and to make general claims about their selectivity and interplay.
The periodic visual stimulation induces a sharp non-sinusoidal transient impulse response with power across all frequencies (see Fig. 1D time-frequency representation). The calculated mean high-frequency amplitude envelope will therefore be dependent on properties of the used time-frequency calculation as well as noise level (e.g. 1/f contributions) in the chosen frequency band, but it will not reflect intrinsic high-frequency physiology or dynamics as it reflects spectral leakage of the transient response amplitude envelope. For instance, one can generate a synthetic non-sinusoidal signal (e.g., as a sum of sine + a number of harmonics) and apply the processing pipeline to generate the LF and HF components as illustrated in Fig. 1. This will yield two signals which will be highly similar regardless of how the LF component manifests. The fact that the two low and high-frequency measures closely track each other in spatial specificity and amplitudes/onset times and selectivity is due to the fact that they reflect exactly the same signal content. It is not possible with the measures as they have been calculated here to disambiguate physiological low- and high-frequency responses in a general way, e.g., in the absence of such a strong input drive. The connection of the calculated measures to ERPs for the low-frequency and population activity for the high-frequency measures for their frequency tagging paradigm is not clear and not validated, but throughout the text they are equated, starting from the introduction.
-
