Synthetic reconstruction of the hunchback promoter specifies the role of Bicoid, Zelda and Hunchback in the dynamics of its transcription
Curation statements for this article:-
Curated by eLife

Evaluation Summary:
The authors combine the study of synthetic transcriptional enhancers with theoretical models to understand the role of Bicoid, Hunchback and Zelda during syncytial cycles. They conclude that Bcd exists in active and inactive forms; that Hb regulates transcription during some stage after initiation; and that an equilibrium model captures the relevant behaviors, implying energy expenditure during DNA binding/transcription interaction with RNAP is theoretically unnecessary.
(This preprint has been reviewed by eLife. We include the public reviews from the reviewers here; the authors also receive private feedback with suggested changes to the manuscript. Reviewer #1 and Reviewer #3 agreed to share their name with the authors.)
This article has been Reviewed by the following groups
Discuss this preprint
Start a discussion What are Sciety discussions?Listed in
- Evaluated articles (eLife)
Abstract
For over 40 years, the Bicoid- hunchback (Bcd- hb ) system in the fruit fly embryo has been used as a model to study how positional information in morphogen concentration gradients is robustly translated into step-like responses. A body of quantitative comparisons between theory and experiment have since questioned the initial paradigm that the sharp hb transcription pattern emerges solely from diffusive biochemical interactions between the Bicoid transcription factor and the gene promoter region. Several alternative mechanisms have been proposed, such as additional sources of positional information, positive feedback from Hb proteins or out-of-equilibrium transcription activation. By using the MS2-MCP RNA-tagging system and analysing in real time, the transcription dynamics of synthetic reporters for Bicoid and/or its two partners Zelda and Hunchback, we show that all the early hb expression pattern features and temporal dynamics are compatible with an equilibrium model with a short decay length Bicoid activity gradient as a sole source of positional information. Meanwhile, Bicoid’s partners speed-up the process by different means: Zelda lowers the Bicoid concentration threshold required for transcriptional activation while Hunchback reduces burstiness and increases the polymerase firing rate.
Article activity feed
-

-

Author Response
Reviewer #1 (Public Review):
In this paper, Fernandes et al. take advantage of synthetic constructs to test how Bicoid (Bcd) activates its downstream target Hunchback (Hb). They explore synthetic constructs containing only Bcd, Bcd and Hb, and Bcd and Zelda binding sites. They use these to develop theoretical models for how Bcd drives Hb in the early embryo. They show that Hb sites alone are insufficient to drive further Hb expression.
The paper's first half focuses on how well the synthetic constructs replicate the in vivo expression of hb. This approach is generally convincing, and the results are interesting. Consistent with previous work, they show that Bcd alone is sufficient to drive an expression profile that is similar to wild‐type, but the addition of Hb and Zelda are needed to generate precise and rapid …
Author Response
Reviewer #1 (Public Review):
In this paper, Fernandes et al. take advantage of synthetic constructs to test how Bicoid (Bcd) activates its downstream target Hunchback (Hb). They explore synthetic constructs containing only Bcd, Bcd and Hb, and Bcd and Zelda binding sites. They use these to develop theoretical models for how Bcd drives Hb in the early embryo. They show that Hb sites alone are insufficient to drive further Hb expression.
The paper's first half focuses on how well the synthetic constructs replicate the in vivo expression of hb. This approach is generally convincing, and the results are interesting. Consistent with previous work, they show that Bcd alone is sufficient to drive an expression profile that is similar to wild‐type, but the addition of Hb and Zelda are needed to generate precise and rapid formation of the boundaries. The experimental results are supported by modelling. The model does a nice job of encapsulating the key conclusions and clearly adds value to the analysis.
In the second part of the paper, the authors use their synthetic approach to look at how the Hb boundary alters depending on Bcd dosage. This part asks whether the observed Bcd gradient is the same as the activity gradient of Bcd (i.e. the "active" part of Bcd is not a priori the same as the protein gradient). This is a very interesting problem and good the authors have tried to tackle this. However, the strength of their conclusions needs to be substantially tempered as they rely on an overestimation of the Bcd gradient decay length.
Comments:
‐ My major concern regards the conclusions for the final section on the activity gradient. In the Introduction it is stated: "[the Bcd gradient has] an exponential AP gradient with a decay length of L ~ 20% egg‐length (EL)". While this was the initial estimate (Houchmandzadeh et al., Nature 2002), later measurements by the Gregor lab (see Supplementary Material of Liu et al., PNAS 2013) found that "The mean length constant was reduced to 16.5 ± 0.7%EL after corrections for EGFP maturation". The original measurements by Houchmandzadeh et al. had issues with background control, that also led to the longer measured decay length. In later work, Durrieu et al., Mol Sys Biol 2018, found a similar scale for the decay length to Liu et al. Looking at Figure 5, a value of 16.5%EL for the decay length is fully consistent with the activity and protein gradients for Bcd being similar. In short, the strength of the conclusions clearly does not match the known gradient and should be substantially toned down.
The reviewer is right: several studies aiming to quantitatively measure the Bicoid protein gradient ended‐up with quite different decay lengths.
A summary of the various decay lengths measured, and the method used for these measurements is given below:
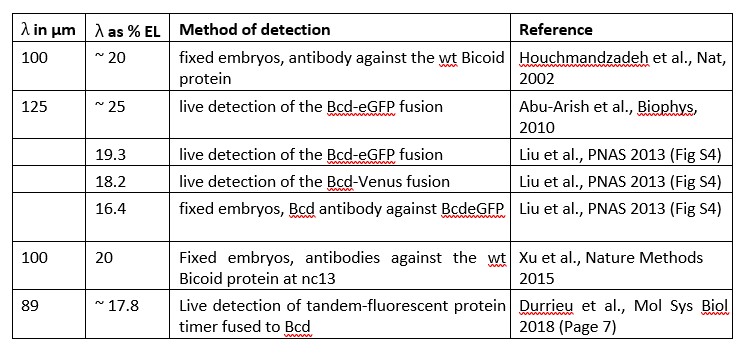
As indicated, these measurements are quite variable among the different studies and the differences can potentially be attributed to different methods of detection (antibody staining on fixed samples vs fluorescent measurements on live sample) or to the type of protein detected (endogenous Bicoid vs fluorescently tagged).
We agree with the reviewer that given these discrepancies, the exact value of the Bcd protein gradient decay length is not known and that we only have measurements that put it in between 16 and 25 % EL (see the Table above). Therefore, we agree that we should tone down the difference between the protein vs activity gradient and focus on the measurements of the effective activity gradient decay length allowed by our synthetic reporters. This allows us to revisit the measurement of the Hill coefficient of the transcription step‐like response, which is based on the decay‐length for the Bcd protein gradient, and assumed in previous published work to be of 20% EL (Gregor et al., Cell, 2007a; Estrada et al., 2016; Tran et al., PLoS CB, 2018). Importantly, the new Hill coefficient allows us to set the Bcd system within the limits of an equilibrium model.
As mentioned by the reviewer, it is possible that the decay length of the protein gradient measured using antibody staining (Houchmandzadeh et al,, Nature, 2002) was not correct due to background controls. Such measurements were also performed in Xu et al. (2015) which agree with the original measurements (Houchmandzadeh et al., Nature 2002). As indicated in the table above, all the other measurements of the Bcd protein gradient decay length were done using fluorescently tagged Bcd proteins and we cannot exclude the possibility the wt vs tagged protein might have different decay lengths due to potentially different diffusion coefficients or half‐lives. Before drawing any conclusion on the exact value of the endogenous Bcd protein gradient decay length, it is essential to measure it again in conditions that correct for the background issues for immuno‐staining as it was done in Liu et al., PNAS, 2013 for the Bcd‐eGFP protein. In this study, the authors only measured the decay length of the Bcd fusion protein using immuno‐staining for the Bcd protein. Unfortunately, in this study, the authors did not measure again the decay length of the endogenous Bcd protein gradient using immuno‐staining and the same procedure for background control. Therefore, they do not firmly exclude the possibility that the endogenous vs tagged Bcd proteins might have different decay length.
We thank the reviewer for his comment which helped us to clarify the message. In addition, as there is clearly an issue for the measurements of the Bcd protein gradient, we added a section in the SI (Section E) and a Table (Table S4) describing the various decay length measured for the Bcd or the Bcd‐fluorescently tagged protein gradients from previous studies. In the discussion, together with the possibility that there might be a protein vs activity gradient (as we originally proposed and believe is still a valid possibility), we also discuss the alternative possibility proposed by the reviewer which is that the protein vs activity gradients have the same decay lengths but that the decay length of the Bcd protein gradient was potentially not correctly evaluated.
‐ All of the experiments are performed in a background with the hb gene present. Does this impact on the readout, as the synthetic lines are essentially competing with the wild‐type genes? What controls were done to account for this?
We agree with the reviewer that this concern might be particularly relevant at the hb boundary where a nucleus has been shown to only contain ~ 700 Bicoid molecules (Gregor et al., Cell, 2007b). However, ~1000 Bicoid binding regions have been identified by ChIP seq experiments in nc14 embryos (Hannon et al., Elife, 2017) and given that several Bcd binding sites are generally clustered together in a Bcd region, the number of Bcd binding sites in the fly genome is likely larger than 1000. It is much greater than the number of Bicoid binding sites in our synthetic reporters. Therefore, we think that it is unlikely that adding the synthetic reporters (which in the case of B12 only represents at most 1/100 of the Bcd binding sites in the genome) will severely alter the competition for Bcd binding between the other Bcd binding sites in the genome. Additionally, the insertion of a BAC spanning the endogenous hb locus with all its Bcd‐dependent enhancers did not affect (as far as we can tell) the regulation of the wildtype gene (Lucas, Tran et al., 2018).
We have added a sentence concerning this point in the main text (lines 108 to 111).
‐ Further, the activity of the synthetic reporters depends on the location of insertion. Erceg et al. PLoS Genetics 2014 showed that the same synthetic enhancer can have different readout depending on its genomic location. I'm aware that the authors use a landing site that appears to replicate similar hb kinetics, but did they try random insertion or other landing site? In short, how robust are their results to the specific local genome site? This should have been tested, especially given the boldly written conclusions from the work.
This concern of the reviewer has been tested and is addressed Fig S1 where we compare two random insertions of the hb‐P2 transgene (on chromosome II and III; Lucas, Tran et al., 2018) and the insertion at the VK33 landing site that was used for the whole study. As shown Fig. S1, the dynamics of transcription (kymographs) are very similar. In the main text, the reference Fig. S1 is found in the Materials and Methods section (bottom of the 1st paragraph concerning the Drosophila stocks, lines 518).
‐ Related to the above, it's also not obvious that readout is linear ‐ i.e. as more binding sites are added, there could be cooperativity between binding domains. This may have been accounted for in the model but it is not clear to me how.
The reviewer is totally correct. It is clear from our data that readout is not linear: comparing (increase of 1.5 X in the number of BS) B6 with B9 leads to a 4.5 X greater activation rate and this argues against independent activation of transcription by individual bound Bcd TF. There is almost no impact of adding 3 more sites when comparing B9 to B12 (even though it corresponds to an increase of 1.33 X in the number of BS). This issue has been rephrased in the main text (lines 200 to 203) and further developed for the modeling aspects in the SI section C and Figure S3. It is also discussed in the second paragraph of the discussion (lines 380 to 383).
‐ It would be good in the Introduction/Discussion to give a broader perspective on the advantages and disadvantages of the synthetic approach to study gene regulation. The intro only discusses Tran et al. Yet, there is a strong history of using this approach, which has also helped to reveal some of the approaches shortcoming. E.g. Gertz et al. Nature 2009 and Sharon et al. Nature Biotechnology 2012. Again, I may have missed, but from my reading I cannot see any critical analysis of the pros/cons of the synthetic approach in development. This is necessary to give readers a clearer context.
One sentence was added in the introduction concerning this point (lines 79 to 82).
A short review concerning the synthetic approach in development has also been added at the beginning of the discussion (lines 347 to 359).
Reviewer #2 (Public Review):
It is known that Bicoid increases in concentration across the syncytial division cycles, the gradient length scale for Bicoid does not change, and hunchback also increases in concentration during the syncytial cycles but the sharp boundary of the hunchback gradient is constantly seen despite the change in concentration of Bicoid. This manuscript shows that by increasing the Bicoid concentration or by adding Zelda binding sites, the expression of hunchback can be recapitulated to that of a previously studied promoter for hunchback.
I have the following comments to understand the implications of the study in the context of increasing concentrations of Bicoid during the syncytial division cycles:
‐ Bicoid itself is also increasing over the syncytial division cycles, how does this change in concentration of Bicoid affect the activation of the hunchback promoter given the cooperative binding of Bicoid and Bicoid and Zelda as documented by the study?
We thank the reviewer for this remark about the dynamics of the Bcd gradient, which we may have taken for granted. A seminal work on the dynamics of the Bcd gradient using fluorescent‐tagged Bcd (Gregor et al, Cell, 2007a) has shown that the gradient of Bcd nuclear concentration (this nuclear concentration is the one that matter for transcription) remains stable over nuclear cycles, despite a global increase of Bcd amount in the embryo. This can be explained by the fact that Bcd molecules are imported in the nuclei and that the number of nuclei double at every cycle, such that both processes compensate each other. Thus, we assumed that the gradient of Bcd nuclear concentration was stable over nc11 to nc13.
We have clarified this assumption in the model section in the manuscript (lines 165‐168).
Supporting our assumption, when looking at the transcription dynamics regulated by Bcd, in Lucas et al, PLoS Gen, 2018, we observed very reproducible expression pattern dynamics of the hb‐P2 reporter at each cycle nc11 to nc13. Such reproducibility in the pattern dynamics were also observed in this current work for hb‐P2, B6, B9, B12 and H6B6 reporters (Fig. S6A). Also, in Lucas et al, PLoS Gen, 2018, the shift in the established boundary positions of hb‐P2 reporter between nc11 to nc13 is ~2%EL (approximately a nucleus length ~10μm) and it is thus marginal.
In addition, as mentioned in the text (lines 105 to 107), we only focused our analysis on nc13 data which are statistically stronger given the higher number of nuclei analyzed. Thus, any change of Bcd nuclear concentration that would happen over nuclear cycles will not matter.
Concerning Zelda: Zelda’s transcriptional activity when measured on a reporter with only 6 Zld binding sites changes drastically over the nuclear cycles, with strong activity at nc11 and much weaker activity at nc13 (Fig S4A). This indicates that the changes in expression pattern dynamics of Z2B6 from nc11 to nc13 are caused predominantly by decreasing Zelda activity: the effect of Zld on the Z2B6 promoter is very strong during nc11 and nc12. It is also very strong at the beginning of nc13 (even though the Z6 reporter is almost silent) and became a bit weaker in the second part of nc13 (Fig S4B‐D).
‐ Does the change in concentration of Bicoid across the nuclear cycles shift the gradient similar to the change in numbers of Bicoid binding sites?
In both Lucas et al, PLoS Gen, 2018 and in this work (Fig. 1, Fig. 3 and Fig. S6A), we found that the positions of the expression boundary are very reproducible and stable in time for hb‐P2, B6, B9, B12, H6B6 during the interphase of nc12 to 13. For hb‐P2, the averaged shift of the established boundary position in nc11, 12 and 13 is within 2 %EL. This averaged shift between the cycles is of similar magnitude to the difference caused by embryo‐to‐embryo variability within nc13 (~2 %EL) (Gregor et al, Cell, 2007b, Lucas et al, PloS Gen, 2018). This shift is much smaller than the difference between the expression boundary positions of B6 and B9 (~ 8 % EL) and between B6 and Z2B6 (~17.5 %EL) in nc13.
For these reasons, we conclude that the difference between the expression patterns of B6, B9 and Z2B6 are caused predominantly by changing the TF binding site configurations of the reporters, rather than variability in the Bcd gradient.
The assumption of gradient stability has been clarified in the previous answer and in the manuscript (lines 165‐168).
‐ The intensity is a little higher for B9 and B12 at the anterior in 2B? Is this statistically different? is this likely to change the amount of Bicoid expression at the locus and lead to more robust activation?
We performed statistical tests to distinguish the spot intensities at the anterior pole for every pair of reporters in Fig. 2B (hb‐P2, B6, B9 and B12). All p‐values from pair‐wise KS tests are greater than 0.067, suggesting that the spot intensities at the anterior pole are not distinguishable between these reporters.
We have clarified this in the manuscript (line 157).
‐Are the fraction of active loci not changing across the syncytial cycles when the concentration of Bicoid also changes and consistent with the synthetic promoters?
To measure the reproducibility of the expression pattern dynamics in different nuclear cycles, we compared the boundary position of the fraction of active loci pattern as a function of time for all hbP2 and synthetic reporters (Fig. S6A). In this figure panel, for all reporters except Z2B6, the curves in nc12 and nc13 largely overlap, suggesting high reproducibility in the pattern dynamics between cycles and consequently low sensitivity to the subtle variation in the Bcd nuclear concentration gradient between the cycles.
For Z2B6, we attributed the difference in pattern dynamics between nc12 and nc13 to the changes in Zelda activity, as validated independently with a synthetic reporter with only 6 Zld binding sites (Fig. S4A).
‐How do the numbers of Hb BS change the expression of Hb? H6B6 has 6 Hb BS whereas the Hb‐P2 has 1? Are more controls needed to compare these 2 contexts?
As our goal was to determine to which mechanistic step of our model each TF (Bcd, Hb, Zld) contributed, we added BS numbers that are much higher than in the hb‐P2 promoter. The added number of Hb BS remains very low when compared to total number of Hb binding sites in the entire genome (Karplan et al, PLOS Gen, 2011), therefore, it is very unlikely to affect the endogenous expression of Hb protein.
We clarified this in the manuscript (lines 211 to 212).
Does Zelda concentration change across the syncytial division cycles? How does the change in concentration in the natural context affect the promoter activation of Hb?
Zelda concentration is stable over the nuclear cycles, as observed with the fluorescently‐tagged Zld protein (Dufourt et al., Nat Com, 2018). However, Zelda’s transcriptional activity when measured on a reporter with only 6 Zld binding sites changes drastically over the nuclear cycles, with strong activity at nc11 and much weaker activity at nc13 (Fig S4A, this work).
The impact of this change in Zld activity can be observed with the Z2B6 promoter, with the expression boundary moving from the posterior region toward the anterior region over the nuclear cycles (Fig. S4B‐D). However, we don’t detect any changes in the expression pattern dynamics of hb‐P2 over the nuclear cycles (Fig. S6A and in Lucas et al., PLoS Gen, 2018).
We have clarified this in lines 250‐251 of the main manuscript.
‐Changing the dose of Bicoid shifts the boundary of hunchback expression. It would be nice to model or test this in the context of varing doses of zelda or even reason this with respect to varying doses of zelda across the syncytial division cycles.
We thank the reviewer for this insight. Concerning Zelda, we did not perform any experiment reducing the amount of Zelda in the embryo. However, in a previous study (Lucas et al., PLoS Genetics, 2018), we observed that the boundary of hb was shifted towards the anterior when decreasing the amount of Zelda consistent to the fact that the dose of Zelda is critical to set the boundary position and the threshold of Bcd concentration required for activation. However, as Zelda is distributed homogeneously along the AP axis, it cannot bring per se positional information to the system.
Reviewer #3 (Public Review):
I think the framing could be improved to better reflect the contribution of the work. From the abstract, for example, it's unclear to me what the authors think is the most meaningful conclusion. Is it the observations about the finer details of TF regulation (bursting dynamics), the fact that Bcd is probably the sole source of "positional information" for hb‐p2, that Bcd exists in active/inactive form, or the fact that an equilibrium model probably suffices to explain what we observe? The first sentence itself seems to suggest this paper will discuss "dynamic positional information", in which case it's somewhat misleading to say this kind of work is "largely unexplored"; Johannes Jaeger in particular has been a strong proponent of this view since at least 2004. On that note some particularly relevant recent papers in the Drosophila early embryo include:
- Jaeger and Verd (2020) Curr Topics Dev Biol
- Verd et al. (2017) PLoS Comp Biol
- Huang, Amourda, et al. and Saunders (2017) eLife
- Yang, Zhu, et al. (2020) eLife [see also the second half of Perkins (2021) PLoS Comp Biol for further discussion of that model]
‐Some reviews from James Briscoe also discuss this perspective.
We agree with the reviewer that the phrasing of the abstract was not clear enough to emphasize the contribution of the work and we are also sorry if it suggested that the dynamic positional information is largely unexplored because this was not at all our intention.
We rephrased the abstract aiming to better highlight the most meaningful conclusions.
‐I would also recommend modifying the title to reflect the biology found in the new results.
We modified the title to better reflect the new results:
“Synthetic reconstruction of the hunchback promoter specifies the role of Bicoid, Zelda and Hunchback in the dynamics of its transcription”‐A major point that the authors should address is the design of the synthetic constructs. From table S1, the sites are often very closely linked (4‐7 base pairs). From the footprint of these proteins, we know they can cover DNA across this size (see, https://pubmed.ncbi.nlm.nih.gov/8620846/). As such, there may be direct competition/steric hindrance (see https://pubmed.ncbi.nlm.nih.gov/28052257/). What impact does this have on their interpretations? Note also that the native enhancer has spaced sites with variable identities.
We completely agree with the reviewer comment in the sense that we named our reporters according to the number (N) of Bcd binding sites sequences that they contain, even though we cannot prove definitively that they can effectively be bound simultaneously by N Bcd molecules. It is thus possible that B9 is not a B9 but an effective B6 (i.e. B9 can only be bound simultaneously by 6 molecules) if, for instance, the binding of a Bcd molecule to one site would prevent by the binding of another Bcd molecule to a nearby site (as proposed by the reviewer in the case of direct competition or steric hindrance).
Even though we cannot exclude this possibility, we think that our use of B6, B9, B12, in reference to the 6 Bcd BS of hb‐P2 promoter, is relevant for several reasons : i) some of the Bcd BS in the hb‐P2 promoter are also very close from each other (see Table S1); ii) the design of the synthetic construct was made by multimerizing a series of 3 strong Bcd binding sites with a similar spacing as found for the closest sites in the hb‐P2 promoter (as shown in Figure 1A and Table S1); iii) the binding of the Bicoid protein has been shown in foot printing experiments in vitro to be more efficient on sites of the hb‐P2 promoter that are close from each other, and this has even been interpreted as binding cooperativity (Ma et al., 1996); iv) even though these experiments were not performed with full‐length proteins, two molecules of the paired homeodomain (from the same family of DNA binding domain as Bcd) are able to simultaneously bind to two binding sites separated by only 2 base pairs. This binding to very close sites is even cooperative while when the two sites are distant by 5 base pairs or more, the simultaneous binding to the two sites occurs without cooperativity (Wilson et al., 1993).
Conversely, as it is very difficult to demonstrate that 9 Bcd molecules can effectively bind to our B9 promoter, it is very difficult to know exactly how many binding sites for Bcd the hb‐P2 contains, and a large debate concerning not only the number but also the identity of the Bcd sites in the hb promoter is still ongoing (Park et al., 2019; Ling et al., 2019).
As we cannot exclude the possibility that B9 is an effective B6, it remains possible that B9 and hb‐P2 (which is supposed to only contains 6 sites) have the same number of effective Bcd binding site and this could explain why the two reporters have very similar transcription dynamics and features.
Regarding other interpretations in the manuscript, we identified two other aspects that will be affected if our synthetic reporters have fewer effective sites than the number of sites they carry. The first one concerns the synergy, as the increase in the number of sites of 1.5 from B6 to B9 might be over‐estimated but this would even increase the synergistic effect given the 4.5 difference in activity of the two reporters (Fig. S3). The second one concerns the discussion on the Hill coefficient and the decay length where the effective number of binding sites (N) is required to determine the limit of concentration sensing (Fig. 5). This would particularly be important for the hb‐P2 promoter.
Except for these specific points, we don’t think that the possibility that reporters do not exactly contain as many as effective binding sites than proposed, has a huge impact on our interpretations and the general message conveyed in this manuscript. Most importantly, it is very clear that our B6 and B9 reporters differ only by three Bcd binding sites and have yet very distinct expression dynamics: while B9 recapitulates almost all transcription features of hb‐P2, B6 is far from achieving it. Similarly, H6B6 and Z2B6 have very different transcription features than B6 and these differences have been key for understanding the mechanistic functions of the three TF we studied.
This discussion has been added to the discussion (lines 400 to 414)
-
Evaluation Summary:
The authors combine the study of synthetic transcriptional enhancers with theoretical models to understand the role of Bicoid, Hunchback and Zelda during syncytial cycles. They conclude that Bcd exists in active and inactive forms; that Hb regulates transcription during some stage after initiation; and that an equilibrium model captures the relevant behaviors, implying energy expenditure during DNA binding/transcription interaction with RNAP is theoretically unnecessary.
(This preprint has been reviewed by eLife. We include the public reviews from the reviewers here; the authors also receive private feedback with suggested changes to the manuscript. Reviewer #1 and Reviewer #3 agreed to share their name with the authors.)
-
Reviewer #1 (Public Review):
In this paper, Fernandes et al. take advantage of synthetic constructs to test how Bicoid (Bcd) activates its downstream target Hunchback (Hb). They explore synthetic constructs containing only Bcd, Bcd and Hb, and Bcd and Zelda binding sites. They use these to develop theoretical models for how Bcd drives Hb in the early embryo. They show that Hb sites alone are insufficient to drive further Hb expression.
The paper's first half focuses on how well the synthetic constructs replicate the in vivo expression of hb. This approach is generally convincing, and the results are interesting. Consistent with previous work, they show that Bcd alone is sufficient to drive an expression profile that is similar to wild-type, but the addition of Hb and Zelda are needed to generate precise and rapid formation of the …
Reviewer #1 (Public Review):
In this paper, Fernandes et al. take advantage of synthetic constructs to test how Bicoid (Bcd) activates its downstream target Hunchback (Hb). They explore synthetic constructs containing only Bcd, Bcd and Hb, and Bcd and Zelda binding sites. They use these to develop theoretical models for how Bcd drives Hb in the early embryo. They show that Hb sites alone are insufficient to drive further Hb expression.
The paper's first half focuses on how well the synthetic constructs replicate the in vivo expression of hb. This approach is generally convincing, and the results are interesting. Consistent with previous work, they show that Bcd alone is sufficient to drive an expression profile that is similar to wild-type, but the addition of Hb and Zelda are needed to generate precise and rapid formation of the boundaries. The experimental results are supported by modelling. The model does a nice job of encapsulating the key conclusions and clearly adds value to the analysis.
In the second part of the paper, the authors use their synthetic approach to look at how the Hb boundary alters depending on Bcd dosage. This part asks whether the observed Bcd gradient is the same as the activity gradient of Bcd (i.e. the "active" part of Bcd is not a priori the same as the protein gradient). This is a very interesting problem and good the authors have tried to tackle this. However, the strength of their conclusions need to be substantially tempered as they rely on an overestimation of the Bcd gradient decay length.
Comments:
- My major concern regards the conclusions for the final section on the activity gradient. In the Introduction it is stated: "[the Bcd gradient has] an exponential AP gradient with a decay length of L ~ 20% egg‐length (EL)". While this was the initial estimate (Houchmandzadeh et al. Nature 2002), later measurements by the Gregor lab (see Supplementary Material of Liu et al. PNAS 2013) found that "The mean length constant was reduced to 16.5 {plus minus} 0.7%EL after corrections for EGFP maturation". The original measurements by Houchmandzadeh et al. had issues with background control, that also led to the longer measured decay length. In later work, Durrieu et al. MSB 2018, found a similar scale for the decay length to Liu et al. Looking at Figure 5, a value of 16.5%EL for the decay length is fully consistent with the activity and protein gradients for Bcd being similar. In short, the strength of the conclusions clearly do not match the known gradient and should be substantially toned down.
- All of the experiments are performed in a background with the hb gene present. Does this impact on the readout, as the synthetic lines are essentially competing with the wild-type genes. What controls were done to account for this?
- Further, the activity of the synthetic reporters depend on the location of insertion. Erceg et al. PLoS Genetics 2014 showed that the same synthetic enhancer can have different readout depending on its genomic location. I'm aware that the authors use a landing site that appears to replicate similar hb kinetics, but did they try random insertion or other landing site? In short, how robust are their results to the specific local genome site? This should have been tested, especially given the boldly written conclusions from the work.
- Related to the above, it's also not obvious that readout is linear - i.e. as more binding sites are added, there could be cooperativity between binding domains. This may have been accounted for in the model but it is not clear to me how.
- It would be good in the Introduction/Discussion to give a broader perspective on the advantages and disadvantages of the synthetic approach to study gene regulation. The intro only discusses Tran et al. Yet, there is a strong history of using this approach, which has also helped to reveal some of the approaches shortcoming. E.g. Gertz et al. Nature 2009 and Sharon et al. Nature Biotechnology 2012. Again, I may have missed, but from my reading I cannot see any critical analysis of the pros/cons of the synthetic approach in development. This is necessary to give readers a clearer context.
-
Reviewer #2 (Public Review):
It is known that Bicoid increases in concentration across the syncytial division cycles, the gradient length scale for Bicoid does not change, and hunchback also increases in concentration during the syncytial cycles but the sharp boundary of the hunchback gradient is constantly seen despite the change in concentration of Bicoid. This manuscript shows that by increasing the Bicoid concentration or by adding Zelda binding sites, the expression of hunchback can be recapitulated to that of a previously studied promoter for hunchback.
I have the following comments to understand the implications of the study in the context of increasing concentrations of Bicoid during the syncytial division cycles:
Bicoid itself is also increasing over the syncytial division cycles, how does this change in concentration of Bicoid …
Reviewer #2 (Public Review):
It is known that Bicoid increases in concentration across the syncytial division cycles, the gradient length scale for Bicoid does not change, and hunchback also increases in concentration during the syncytial cycles but the sharp boundary of the hunchback gradient is constantly seen despite the change in concentration of Bicoid. This manuscript shows that by increasing the Bicoid concentration or by adding Zelda binding sites, the expression of hunchback can be recapitulated to that of a previously studied promoter for hunchback.
I have the following comments to understand the implications of the study in the context of increasing concentrations of Bicoid during the syncytial division cycles:
Bicoid itself is also increasing over the syncytial division cycles, how does this change in concentration of Bicoid affect the activation of the hunchback promoter given the cooperative binding of Bicoid and Bicoid and Zelda as documented by the study?
Does the change in concentration of Bicoid across the nuclear cycles shift the gradient similar to the change in numbers of Bicoid binding sites?
The intensity is a little higher for B9 and B12 at the anterior in 2B? Is this statistically different?, is this likely to change the amount of Bicoid expression at the locus and lead to more robust activation?
Are the fraction of active loci not changing across the syncytial cycles when the concentration of Bicoid also changes and consistent with the synthetic promoters?
How do the numbers of Hb BS change the expression of Hb? H6B6 has 6 Hb BS whereas the Hb-P2 has 1? Are more controls needed to compare these 2 contexts?
Does Zelda concentration change across the syncytial division cycles? How does the change in concentration in the natural context affect the promoter activation of Hb?
Changing the dose of Bicoid shifts the boundary of hunchback expression. It would be nice to model or test this in the context of varing doses of zelda or even reason this with respect to varying doses of zelda across the syncytial division cycles.
-
Reviewer #3 (Public Review):
I think the framing could be improved to better reflect the contribution of the work. From the abstract, for example, it's unclear to me what the authors think is the most meaningful conclusion. Is it the observations about the finer details of TF regulation (bursting dynamics), the fact that Bcd is probably the sole source of "positional information" for hb-p2, that Bcd exists in active/inactive form, or the fact that an equilibrium model probably suffices to explain what we observe? The first sentence itself seems to suggest this paper will discuss "dynamic positional information", in which case it's somewhat misleading to say this kind of work is "largely unexplored"; Johannes Jaeger in particular has been a strong proponent of this view since at least 2004. On that note some particularly relevant recent …
Reviewer #3 (Public Review):
I think the framing could be improved to better reflect the contribution of the work. From the abstract, for example, it's unclear to me what the authors think is the most meaningful conclusion. Is it the observations about the finer details of TF regulation (bursting dynamics), the fact that Bcd is probably the sole source of "positional information" for hb-p2, that Bcd exists in active/inactive form, or the fact that an equilibrium model probably suffices to explain what we observe? The first sentence itself seems to suggest this paper will discuss "dynamic positional information", in which case it's somewhat misleading to say this kind of work is "largely unexplored"; Johannes Jaeger in particular has been a strong proponent of this view since at least 2004. On that note some particularly relevant recent papers in the Drosophila early embryo include:
- Jaeger and Verd (2020) Curr Topics Dev Biol
- Verd et al. (2017) PLoS Comp Biol
- Huang, Amourda, et al. and Saunders (2017) eLife
- Yang, Zhu, et al. (2020) eLife [see also the second half of Perkins (2021) PLoS Comp Biol for further discussion of that model]
Some reviews from James Briscoe also discuss this perspective.
I would also recommend modifying the title to reflect the biology found in the new results.
A major point that the authors should address is the design of the synthetic constructs. From table S1, the sites are often very closely linked (4-7 base pairs). From the footprint of these proteins, we know they can cover DNA across this size (see, https://pubmed.ncbi.nlm.nih.gov/8620846/). As such, there may be direct competition/steric hindrance (see https://pubmed.ncbi.nlm.nih.gov/28052257/). What impact does this have on their interpretations? Note also that the native enhancer has spaced sites with variable identities.
-
