Neural activity tracking identity and confidence in social information
Curation statements for this article:-
Curated by eLife

eLife assessment
The authors use an elegant design to tackle a longstanding question about the extent to which learning social information relies on specialized computational and neural mechanism. They find that learning about ostensible others is more accurate than learning about non-social objects, despite identical statistical information, and that such effects are mediated by the dmPFC and pTPJ - regions previously implicated in social cognition. While likely of interest to a broad range of social, behavioral, and cognitive neuroscientists, the work is not sufficiently framed by relevant previous research. Moreover, the difference between social (faces) and non-social (fruits) stimuli raises concerns about attentional confounds.
This article has been Reviewed by the following groups
Discuss this preprint
Start a discussion What are Sciety discussions?Listed in
- Evaluated articles (eLife)
Abstract
Humans learn about the environment either directly by interacting with it or indirectly by seeking information about it from social sources such as conspecifics. The degree of confidence in the information obtained through either route should determine the impact that it has on adapting and changing behaviour. We examined whether and how behavioural and neural computations differ during non-social learning as opposed to learning from social sources. Trial-wise confidence judgements about non-social and social information sources offered a window into this learning process. Despite matching exactly the statistical features of social and non-social conditions, confidence judgements were more accurate and less changeable when they were made about social as opposed to non-social information sources. In addition to subjective reports of confidence, differences were also apparent in the Bayesian estimates of participants’ subjective beliefs. Univariate activity in dorsomedial prefrontal cortex and posterior temporoparietal junction more closely tracked confidence about social as opposed to non-social information sources. In addition, the multivariate patterns of activity in the same areas encoded identities of social information sources compared to non-social information sources.
Article activity feed
-

-

Author Response
Reviewer #1 (Public Review):
Trudel and colleagues aimed to uncover the neural mechanisms of estimating the reliability of the information from social agents and non-social objects. By combining functional MRI with a behavioural experiment and computational modelling, they demonstrated that learning from social sources is more accurate and robust compared with that from non-social sources. Furthermore, dmPFC and pTPJ were found to track the estimated reliability of the social agents (as opposed to the non-social objects). The strength of this study is to devise a task consisting of the two experimental conditions that were matched in their statistical properties and only differed in their framing (social vs. non-social). The novel experimental task allows researchers to directly compare the learning from social and …
Author Response
Reviewer #1 (Public Review):
Trudel and colleagues aimed to uncover the neural mechanisms of estimating the reliability of the information from social agents and non-social objects. By combining functional MRI with a behavioural experiment and computational modelling, they demonstrated that learning from social sources is more accurate and robust compared with that from non-social sources. Furthermore, dmPFC and pTPJ were found to track the estimated reliability of the social agents (as opposed to the non-social objects). The strength of this study is to devise a task consisting of the two experimental conditions that were matched in their statistical properties and only differed in their framing (social vs. non-social). The novel experimental task allows researchers to directly compare the learning from social and non-social sources, which is a prominent contribution of the present study to social decision neuroscience.
Thank you so much for your positive feedback about our work. We are delighted that you found that our manuscript provided a prominent contribution to social decision neuroscience. We really appreciate your time to review our work and your valuable comments that have significantly helped us to improve our manuscript further.
One of the major weaknesses is the lack of a clear description about the conceptual novelty. Learning about the reliability/expertise of social and non-social agents has been of considerable concern in social neuroscience (e.g., Boorman et al., Neuron 2013; and Wittmann et al., Neuron 2016). The authors could do a better job in clarifying the novelty of the study beyond the previous literature.
We understand the reviewer’s comment and have made changes to the manuscript that, first, highlight more strongly the novelty of the current study. Crucially, second, we have also supplemented the data analyses with a new model-based analysis of the differences in behaviour in the social and non-social conditions which we hope makes clearer, at a theoretical level, why participants behave differently in the two conditions.
There has long been interest in investigating whether ‘social’ cognitive processes are special or unique compared to ‘non-social’ cognitive processes and, if they are, what makes them so. Differences between conditions could arise during the input stage (e.g. the type of visual input that is processed by social and non-social system), at the algorithm stage (e.g. the type of computational principles that underpin social versus non-social processes) or, even if identical algorithms are used, social and non-social processes might depend on distinct anatomical brain areas or neurons within brain areas. Here, we conducted multiple analyses (in figures 2, 3, and 4 in the revised manuscript and in Figure 2 – figure supplement 1, Figure 3 – figure supplement 1, Figure 4 – figure supplement 3, Figure 4 – figure supplement 4) that not only demonstrated basic similarities in mechanism generalised across social and non-social contexts, but also demonstrated important quantitative differences that were linked to activity in specific brain regions associated with the social condition. The additional analyses (Figure 4 – figure supplement 3, Figure 4 – figure supplement 4) show that differences are not simply a consequence of differences in the visual stimuli that are inputs to the two systems1, nor does the type of algorithm differ between conditions. Instead, our results suggest that the precise manner in which an algorithm is implemented differs when learning about social or non-social information and that this is linked to differences in neuroanatomical substrates.
The previous studies mentioned by the reviewer are, indeed, relevant ones and were, of course, part of the inspiration for the current study. However, there are crucial differences between them and the current study. In the case of the previous studies by Wittmann, the aim was a very different one: to understand how one’s own beliefs, for example about one’s performance, and beliefs about others, for example about their performance levels, are combined. Here, however, instead we were interested in the similarities and differences between social and non-social learning. It is true that the question resembles the one addressed by Boorman and colleagues in 2013 who looked at how people learned about the advice offered by people or computer algorithms but the difference in the framing of that study perhaps contributed to authors’ finding of little difference in learning. By contrast, in the present study we found evidence that people were predisposed to perceive stability in social performance and to be uncertain about non-social performance. By accumulating evidence across multiple analyses, we show that there are quantitative differences in how we learn about social versus non-social information, and that these differences can be linked to the way in which learning algorithms are implemented neurally. We therefore contend that our findings extend our previous understanding of how, in relation to other learning processes, ‘social’ learning has both shared and special features.
We would like to emphasize the way in which we have extended several of the analyses throughout the revision. The theoretical Bayesian framework has made it possible to simulate key differences in behaviour between the social and non-social conditions. We explain in our point-by-point reply below how we have integrated a substantial number of new analyses. We have also more carefully related our findings to previous studies in the Introduction and Discussion.
Introduction, page 4:
[...] Therefore, by comparing information sampling from social versus non-social sources, we address a long-standing question in cognitive neuroscience, the degree to which any neural process is specialized for, or particularly linked to, social as opposed to non-social cognition 2–9. Given their similarities, it is expected that both types of learning will depend on common neural mechanisms. However, given the importance and ubiquity of social learning, it may also be that the neural mechanisms that support learning from social advice are at least partially specialized and distinct from those concerned with learning that is guided by nonsocial sources. However, it is less clear on which level information is processed differently when it has a social or non-social origin. It has recently been argued that differences between social and non-social learning can be investigated on different levels of Marr’s information processing theory: differences could emerge at an input level (in terms of the stimuli that might drive social and non-social learning), at an algorithmic level or at a neural implementation level 7. It might be that, at the algorithmic level, associative learning mechanisms are similar across social and non-social learning 1. Other theories have argued that differences might emerge because goal-directed actions are attributed to social agents which allows for very different inferences to be made about hidden traits or beliefs 10. Such inferences might fundamentally alter learning about social agents compared to non-social cues.
Discussion, page 15:
[…] One potential explanation for the assumption of stable performance for social but not non-social predictors might be that participants attribute intentions and motivations to social agents. Even if the social and non-social evidence are the same, the belief that a social actor might have a goal may affect the inferences made from the same piece of information 10. Social advisors first learnt about the target’s distribution and accordingly gave advice on where to find the target. If the social agents are credited with goal-directed behaviour then it might be assumed that the goals remain relatively constant; this might lead participants to assume stability in the performances of social advisors. However, such goal-directed intentions might not be attributed to non-social cues, thereby making judgments inherently more uncertain and changeable across time. Such an account, focussing on differences in attribution in social settings aligns with a recent suggestion that any attempt to identify similarities or differences between social and non-social processes can occur at any one of a number of the levels in Marr’s information theory 7. Here we found that the same algorithm was able to explain social and non-social learning (a qualitatively similar computational model could explain both). However, the extent to which the algorithm was recruited when learning about social compared to non-social information differed. We observed a greater impact of uncertainty on judgments about social compared to non-social information. We have shown evidence for a degree of specialization when assessing social advisors as opposed to non-social cues. At the neural level we focused on two brain areas, dmPFC and pTPJ, that have not only been shown to carry signals associated with belief inferences about others but, in addition, recent combined fMRI-TMS studies have demonstrated the causal importance of these activity patterns for the inference process […]
Another weakness is the lack of justifications of the behavioural data analyses. It is difficult for me to understand why 'performance matching' is suitable for an index of learning accuracy. I understand the optimal participant would adjust the interval size with respect to the estimated reliability of the advisor (i.e., angular error); however, I am wondering if the optimal strategy for participants is to exactly match the interval size with the angular error. Furthermore, the definitions of 'confidence adjustment across trials' and 'learning index' look arbitrary.
First, having read the reviewer’s comments, we realise that our choice of the term ‘performance matching’ may not have been ideal as it indeed might not be the case that the participant intended to directly match their interval sizes with their estimates of advisor/predictor error. Like the reviewer, our assumption is simply that the interval sizes should change as the estimated reliability of the advisor changes and, therefore, that the intervals that the participants set should provide information about the estimates that they hold and the manner in which they evolve. On re-reading the manuscript we realised that we had not used the term ‘performance matching’ consistently or in many places in the manuscript. In the revised manuscript we have simply removed it altogether and referred to the participants’ ‘interval setting’.
Most of the initial analyses in Figure 2a-c aim to better understand the raw behaviour before applying any computational model to the data. We were interested in how participants make confidence judgments (decision-making per se), but also how they adapt their decisions with additional information (changes or learning in decision making). In the revised manuscript we have made clear that these are used as simple behavioural measures and that they will be complemented later by more analyses derived from more formal computational models.
In what we now refer to as the ‘interval setting’ analysis (Figure 2a), we tested whether participants select their interval settings differently in the social compared to non-social condition. We observe that participants set their intervals closer to the true angular error of the advisor/predictor in the social compared to the non-social condition. This observation could arise in two ways. First, it could be due to quantitative differences in learning despite general, qualitative similarity: mechanisms are similar but participants differ quantitatively in the way that they learn about non-social information and social information. Second, it could, however, reflect fundamentally different strategies. We tested basic performance differences by comparing the mean reward between conditions. There was no difference in reward between conditions (mean reward: paired t-test social vs. non-social, t(23)= 0.8, p=0.4, 95% CI= [-0.007 0.016]), suggesting that interval setting differences might not simply reflect better or worse performance in social or non-social contexts but instead might reflect quantitative differences in the processes guiding interval setting in the two cases.
In the next set of analyses, in which we compared raw data, applied a computational model, and provided a theoretical account for the differences between conditions, we suggest that there are simple quantitative differences in how information is processed in social and nonsocial conditions but that these have the important impact of making long-term representations – representations built up over a longer series of trials – more important in the social condition. This, in turn, has implications for the neural activity patterns associated with social and non-social learning. We, therefore, agree with the reviewer, that one manner of interval setting is indeed not more optimal than another. However, the differences that do exist in behaviour are important because they reveal something about the social and non-social learning and its neural substrates. We have adjusted the wording and interpretation in the revised manuscript.
Next, we analysed interval setting with two additional, related analyses: interval setting adjustment across trials and derivation of a learning index. We tested the degree to which participants adjusted their interval setting across trials and according to the prediction error (learning index, Figure f); the latter analysis is very similar to a trial-wise learning rate calculated in previous studies11. In contrast to many other studies, the intervals set by participants provide information about the estimates that they hold in a simple and direct way and enable calculation of a trial-wise learning index; therefore, we decided to call it ‘learning index’ instead of ‘learning rate’ as it is not estimated via a model applied to the data, but instead directly calculated from the data. Arguably the directness of the approach, and its lack of dependence on a specific computational model, is a strength of the analysis.
Subsequently in the manuscript, a new analysis (illustrated in new Figure 3) employs Bayesian models that can simulate the differences in the social and non-social conditions and demonstrate that a number of behavioural observations can arise simply as a result of differences in noise in each trial-wise Bayesian update (Figure 3 and specifically 3d; Figure 3 – figure supplement 1b-c). In summary, the descriptive analyses in Figure 2a-c aid an intuitive understanding of the differences in behaviour in the social and non-social conditions. We have then repeated these analyses with Bayesian models incorporating different noise levels and showed that in such a way, the differences in behaviour between social and non-social conditions can be mimicked (please see next section and manuscript for details).
We adjusted the wording in a number of sections in the revised manuscript such as in the legend of Figure 2 (figures and legend), Figure 4 (figures and legend).
Main text, page 5:
The confidence interval could be changed continuously to make it wider or narrower, by pressing buttons repeatedly (one button press resulted in a change of one step in the confidence interval). In this way participants provided what we refer to as an ’interval setting’.
We also adjusted the following section in Main text, page 6:
Confidence in the performance of social and non-social advisors
We compared trial-by-trial interval setting in relation to the social and non-social advisors/predictors. When setting the interval, the participant’s aim was to minimize it while ensuring it still encompassed the final target position; points were won when it encompassed the target position but were greater when it was narrower. A given participant’s interval setting should, therefore, change in proportion to the participant’s expectations about the predictor’s angular error and their uncertainty about those expectations. Even though, on average, social and non-social sources did not differ in the precision with which they predicted the target (Figure 2 – figure supplement 1), participants gave interval settings that differed in their relationships to the true performances of the social advisors compared to the non-social predictors. The interval setting was closer to the angular error in the social compared to the non-social sessions (Figure 2a, paired t-test: social vs. non-social, t(23)= -2.57, p= 0.017, 95% confidence interval (CI)= [-0.36 -0.4]). Differences in interval setting might be due to generally lower performance in the nonsocial compared to social condition, or potentially due to fundamentally different learning processes utilised in either condition. We compared the mean reward amounts obtained by participants in the social and non-social conditions to determine whether there were overall performance differences. There was, however, no difference in the reward received by participants in the two conditions (mean reward: paired t-test social vs. non-social, t(23)= 0.8, p=0.4, 95% CI= [-0.007 0.016]), suggesting that interval setting differences might not simply reflect better or worse performance
Discussion, page 14:
Here, participants did not match their confidence to the likely accuracy of their own performance, but instead to the performance of another social or non-social advisor. Participants used different strategies when setting intervals to express their confidence in the performances of social advisors as opposed to non-social advisors. A possible explanation might be that participants have a better insight into the abilities of social cues – typically other agents – than non-social cues – typically inanimate objects.
As the authors assumed simple Bayesian learning for the estimation of reliability in this study, the degree/speed of the learning should be examined with reference to the distance between the posterior and prior belief in the optimal Bayesian inference.
We thank the reviewer for this suggestion. We agree with the reviewer that further analyses that aim to disentangle the underlying mechanisms that might differ between both social and non-social conditions might provide additional theoretical contributions. We show additional model simulations and analyses that aim to disentangle the differences in more detail. These new results allowed clearer interpretations to be made.
In the current study, we showed that judgments made about non-social predictors were changed more strongly as a function of the subjective uncertainty: participants set a larger interval, indicating lower confidence, when they were more uncertain about the non-social cue’s accuracy to predict the target. In response to the reviewer’s comments, the new analyses were aimed at understanding under which conditions such a negative uncertainty effect might emerge.
Prior expectations of performance First, we compared whether participants had different prior expectations in the social condition compared to the non-social condition. One way to compare prior expectations is by comparing the first interval set for each advisor/predictor. This is a direct readout of the initial prior expectation with which participants approach our two conditions. In such a way, we test whether the prior beliefs before observing any social or non-social information differ between conditions. Even though this does not test the impact of prior expectations on subsequent belief updates, it does test whether participants have generally different expectations about the performance of social advisors or non-social predictors. There was no difference in this measure between social or non-social cues (Figure below; paired t-test social vs. non-social, t(23)= 0.01, p=0.98, 95% CI= [-0.067 0.68]).
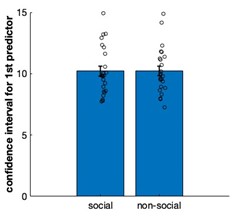
Figure. Confidence interval for the first encounter of each predictor in social and non-social conditions. There was no initial bias in predicting the performance of social or non-social predictors.
Learning across time We have now seen that participants do not have an initial bias when predicting performances in social or non-social conditions. This suggests that differences between conditions might emerge across time when encountering predictors multiple times. We tested whether inherent differences in how beliefs are updated according to new observations might result in different impacts of uncertainty on interval setting between social and non-social conditions. More specifically, we tested whether the integration of new evidence differed between social and non-social conditions; for example, recent observations might be weighted more strongly for non-social cues while past observations might be weighted more strongly for social cues. This approach was inspired by the reviewer’s comments about potential differences in the speed of learning as well as the reduction of uncertainty with increasing predictor encounters. Similar ideas were tested in previous studies, when comparing the learning rate (i.e. the speed of learning) in environments of different volatilities 12,13. In these studies, a smaller learning rate was prevalent in stable environments during which reward rates change slower over time, while higher learning rates often reflect learning in volatile environments so that recent observations have a stronger impact on behaviour. Even though most studies derived these learning rates with reinforcement learning models, similar ideas can be translated into a Bayesian model. For example, an established way of changing the speed of learning in a Bayesian model is to introduce noise during the update process14. This noise is equivalent to adding in some of the initial prior distribution and this will make the Bayesian updates more flexible to adapt to changing environments. It will widen the belief distribution and thereby make it more uncertain. Recent information has more weight on the belief update within a Bayesian model when beliefs are uncertain. This increases the speed of learning. In other words, a wide distribution (after adding noise) allows for quick integration of new information. On the contrary, a narrow distribution does not integrate new observations as strongly and instead relies more heavily on previous information; this corresponds to a small learning rate. So, we would expect a steep decline of uncertainty to be related to a smaller learning index while a slower decline of uncertainty is related to a larger learning index. We hypothesized that participants reduce their uncertainty quicker when observing social information, thereby anchoring more strongly on previous beliefs instead of integrating new observations flexibly. Vice versa, we hypothesized a less steep decline of uncertainty when observing non-social information, indicating that new information can be flexibly integrated during the belief update (new Figure 3a).
We modified the original Bayesian model (Figure 2d, Figure 2 – figure supplement 2) by adding a uniform distribution (equivalent to our prior distribution) to each belief update – we refer to this as noise addition to the Bayesian model14,21 . We varied the amount of noise between δ = [0,1], while δ= 0 equals the original Bayesian model and δ= 1 represents a very noisy Bayesian model. The uniform distribution was selected to match the first prior belief before any observation was made (equation 2). This δ range resulted in a continuous increase of subjective uncertainty around the belief about the angular error (Figure 3b-c). The modified posterior distribution denoted as 𝑝′(σ x) was derived at each trial as follows:
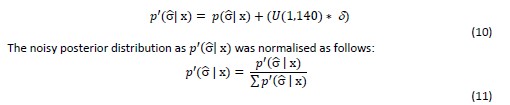
We applied each noisy Bayesian model to participants’ choices within the social and nonsocial condition.
The addition of a uniform distribution changed two key features of the belief distribution: first, the width of the distribution remains larger with additional observations, thereby making it possible to integrate new observations more flexibly. To show this more clearly, we extracted the model-derived uncertainty estimate across multiple encounters of the same predictor for the original model and the fully noisy Bayesian model (Figure 3 – figure supplement 1). The model-derived ‘uncertainty estimate’ of a noisy Bayesian model decays more slowly compared to the ‘uncertainty estimate’ of the original Bayesian model (upper panel). Second, the model-derived ‘accuracy estimate’ reflects more recent observations in a noisy Bayesian model compared to the ‘accuracy estimate’ derived from the original Bayesian model, which integrates past observations more strongly (lower panel). Hence, as mentioned beforehand, a rapid decay of uncertainty implies a small learning index; or in other words, stronger integration of past compared to recent observations.
In the following analyses, we tested whether an increasingly noisy Bayesian model mimics behaviour that is observed in the non-social compared to social condition. For example, we tested whether an increasingly noisy Bayesian model also exhibits a strongly negative ‘predictor uncertainty’ effect on interval setting (Figure 2e). In such a way, we can test whether differences in noise in the updating process of a Bayesian model might reproduce important qualitative differences in learning-related behaviour seen in the social and nonsocial conditions.
We used these modified Bayesian models to simulate trial-wise interval setting for each participant according to the observations they made when selecting a particular advisor or non-social cue. We simulated interval setting at each trial and examined whether an increase in noise produced model behaviours that resembled participant behaviour patterns observed in the non-social condition as opposed to social condition. At each trial, we used the accuracy estimate (Methods, equation 6) – which represents a subjective belief about a single angular error -- to derive an interval setting for the selected predictor. To do so, we first derived the point-estimate of the belief distribution at each trial (Methods, equation 6) and multiplied it with the size of one interval step on the circle. The step size was derived by dividing the circle size by the maximum number of possible steps. Here is an example of transforming an accuracy estimate into an interval: let’s assume the belief about the angular error at the current trial is 50 (Methods, equation 6). Now, we are trying to transform this number into an interval for the current predictor on a given trial. To obtain the size of one interval step, the circle size (360 degrees) is divided by the maximum number of interval steps (40 steps; note, 20 steps on each side), which results in nine degrees that represents the size of one interval step. Next, the accuracy estimate in radians (0,87) is multiplied by the step size in radians (0,1571) resulting in an interval of 0,137 radians or 7,85 degrees. The final interval size would be 7,85.
Simulating Bayesian choices in that way, we repeated the behavioural analyses (Figure 2b,e,f) to test whether intervals derived from more noisy Bayesian models mimic intervals set by participants in the non-social condition: greater changes in interval setting across trials (Figure 3 – figure supplement 1b), a negative ‘predictor uncertainty' effect on interval setting (Figure 3 – figure supplement 1c), and a higher learning index (Figure 3d).
First, we repeated the most crucial analysis -- the linear regression analysis (Figure 2e) and hypothesized that intervals that were simulated from noisy Bayesian models would also show a greater negative ‘predictor uncertainty’ effect on interval setting. This was indeed the case: irrespective of social or non-social conditions, the addition of noise (increased weighting of the uniform distribution in each belief update) led to an increasingly negative ‘predictor uncertainty’ effect on confidence judgment (new Figure 3d). In Figure 3d, we show the regression weights (y-axis) for the ‘predictor uncertainty’ on confidence judgment with increasing noise (x-axis). This result is highly consistent with the idea that that in the non-social condition the manner in which task estimates are updated is more uncertain and more noisy. By contrast, social estimates appear relatively more stable, also according to this new Bayesian simulation analysis.
This new finding extends the results and suggests a formal computational account of the behavioural differences between social and non-social conditions. Increasing the noise of the belief update mimics behaviour that is observed in the non-social condition: an increasingly negative effect of ‘predictor uncertainty’ on confidence judgment. Noteworthily, there was no difference in the impact that the noise had in the social and non-social conditions. This was expected because the Bayesian simulations are blind to the framing of the conditions. However, it means that the observed effects do not depend on the precise sequence of choices that participants made in these conditions. It therefore suggests that an increase in the Bayesian noise leads to an increasingly negative impact of ‘predictor uncertainty’ on confidence judgments irrespective of the condition. Hence, we can conclude that different degrees of uncertainty within the belief update is a reasonable explanation that can underlie the differences observed between social and non-social conditions.
Next, we used these simulated confidence intervals and repeated the descriptive behavioural analyses to test whether interval settings that were derived from more noisy Bayesian models mimic behavioural patterns observed in non-social compared to social conditions. For example, more noise in the belief update should lead to more flexible integration of new information and hence should potentially lead to a greater change of confidence judgments across predictor encounters (Figure 2b). Further, a greater reliance on recent information should lead to prediction errors more strongly in the next confidence judgment; hence, it should result in a higher learning index in the non-social condition that we hypothesize to be perceived as more uncertain (Figure 2f). We used the simulated confidence interval from Bayesian models on a continuum of noise integration (i.e. different weighting of the uniform distribution into the belief update) and derived again both absolute confidence change and learning indices (Figure 3 – figure supplement 1b-c).
‘Absolute confidence change’ and ‘learning index’ increase with increasing noise weight, thereby mimicking the difference between social and non-social conditions. Further, these analyses demonstrate the tight relationship between descriptive analyses and model-based analyses. They show that a noise in the Bayesian updating process is a conceptual explanation that can account for both the differences in learning and the difference in uncertainty processing that exist between social and non-social conditions. The key insight conveyed by the Bayesian simulations is that a wider, more uncertain belief distribution changes more quickly. Correspondingly, in the non-social condition, participants express more uncertainty in their confidence estimate when they set the interval, and they also change their beliefs more quickly as expressed in a higher learning index. Therefore, noisy Bayesian updating can account for key differences between social and non-social condition.
We thank the reviewer for making this point, as we believe that these additional analyses allow theoretical inferences to be made in a more direct manner; we think that it has significantly contributed towards a deeper understanding of the mechanisms involved in the social and non-social conditions. Further, it provides a novel account of how we make judgments when being presented with social and non-social information.
We made substantial changes to the main text, figures and supplementary material to include these changes:
Main text, page 10-11 new section:
The impact of noise in belief updating in social and non-social conditions
So far, we have shown that, in comparison to non-social predictors, participants changed their interval settings about social advisors less drastically across time, relied on observations made further in the past, and were less impacted by their subjective uncertainty when they did so (Figure 2). Using Bayesian simulation analyses, we investigated whether a common mechanism might underlie these behavioural differences. We tested whether the integration of new evidence differed between social and non-social conditions; for example, recent observations might be weighted more strongly for non-social cues while past observations might be weighted more strongly for social cues. Similar ideas were tested in previous studies, when comparing the learning rate (i.e. the speed of learning) in environments of different volatilities12,13. We tested these ideas using established ways of changing the speed of learning during Bayesian updates14,21. We hypothesized that participants reduce their uncertainty quicker when observing social information. Vice versa, we hypothesized a less steep decline of uncertainty when observing non-social information, indicating that new information can be flexibly integrated during the belief update (Figure 5a).
We manipulated the amount of uncertainty in the Bayesian model by adding a uniform distribution to each belief update (Figure 3b-c) (equation 10,11). Consequently, the distribution’s width increases and is more strongly impacted by recent observations (see example in Figure 3 – figure supplement 1). We used these modified Bayesian models to simulate trial-wise interval setting for each participant according to the observations they made by selecting a particular advisor in the social condition or other predictor in the nonsocial condition. We simulated confidence intervals at each trial. We then used these to examine whether an increase in noise led to simulation behaviour that resembled behavioural patterns observed in non-social conditions that were different to behavioural patterns observed in the social condition.
First, we repeated the linear regression analysis and hypothesized that interval settings that were simulated from noisy Bayesian models would also show a greater negative ‘predictor uncertainty’ effect on interval setting resembling the effect we had observed in the nonsocial condition (Figure 2e). This was indeed the case when using the noisy Bayesian model: irrespective of social or non-social condition, the addition of noise (increasing weight of the uniform distribution to each belief update) led to an increasingly negative ‘predictor uncertainty’ effect on confidence judgment (new Figure 3d). The absence of difference between the social and non-social conditions in the simulations, suggests that an increase in the Bayesian noise is sufficient to induce a negative impact of ‘predictor uncertainty’ on interval setting. Hence, we can conclude that different degrees of noise in the updating process are sufficient to cause differences observed between social and non-social conditions. Next, we used these simulated interval settings and repeated the descriptive behavioural analyses (Figure 2b,f). An increase in noise led to greater changes of confidence across time and a higher learning index (Figure 3 – figure supplement 1b-c). In summary, the Bayesian simulations offer a conceptual explanation that can account for both the differences in learning and the difference in uncertainty processing that exist between social and non-social conditions. The key insight conveyed by the Bayesian simulations is that a wider, more uncertain belief distribution changes more quickly. Correspondingly, in the non-social condition, participants express more uncertainty in their confidence estimate when they set the interval, and they also change their beliefs more quickly. Therefore, noisy Bayesian updating can account for key differences between social and non-social condition.
Methods, page 23 new section:
Extension of Bayesian model with varying amounts of noise
We modified the original Bayesian model (Figure 2d, Figure 2 – figure supplement 2) to test whether the integration of new evidence differed between social and non-social conditions; for example, recent observations might be weighted more strongly for non-social cues while past observations might be weighted more strongly for social cues. [...] To obtain the size of one interval step, the circle size (360 degrees) is divided by the maximum number of interval steps (40 steps; note, 20 steps on each side), which results in nine degrees that represents the size of one interval step. Next, the accuracy estimate in radians (0,87) is multiplied by the step size in radians (0,1571) resulting in an interval of 0,137 radians or 7,85 degrees. The final interval size would be 7,85.
We repeated behavioural analyses (Figure 2b,e,f) to test whether confidence intervals derived from more noisy Bayesian models mimic behavioural patterns observed in the nonsocial condition: greater changes of confidence across trials (Figure 3 – figure supplement 1b), a greater negative ‘predictor uncertainty' on confidence judgment (Figure 3 – figure supplement 1c) and a greater learning index (Figure 3d).
Discussion, page 14: […] It may be because we make just such assumptions that past observations are used to predict performance levels that people are likely to exhibit next 15,16. An alternative explanation might be that participants experience a steeper decline of subjective uncertainty in their beliefs about the accuracy of social advice, resulting in a narrower prior distribution, during the next encounter with the same advisor. We used a series of simulations to investigate how uncertainty about beliefs changed from trial to trial and showed that belief updates about non-social cues were consistent with a noisier update process that diminished the impact of experiences over the longer term. From a Bayesian perspective, greater certainty about the value of advice means that contradictory evidence will need to be stronger to alter one’s beliefs. In the absence of such evidence, a Bayesian agent is more likely to repeat previous judgments. Just as in a confirmation bias 17, such a perspective suggests that once we are more certain about others’ features, for example, their character traits, we are less likely to change our opinions about them.
Reviewer #2 (Public Review):
Humans learn about the world both directly, by interacting with it, and indirectly, by gathering information from others. There has been a longstanding debate about the extent to which social learning relies on specialized mechanisms that are distinct from those that support learning through direct interaction with the environment. In this work, the authors approach this question using an elegant within-subjects design that enables direct comparisons between how participants use information from social and non-social sources. Although the information presented in both conditions had the same underlying structure, participants tracked the performance of the social cue more accurately and changed their estimates less as a function of prediction error. Further, univariate activity in two regions-dmPFC and pTPJ-tracked participants' confidence judgments more closely in the social than in the non-social condition, and multivariate patterns of activation in these regions contained information about the identity of the social cues.
Overall, the experimental approach and model used in this paper are very promising. However, after reading the paper, I found myself wanting additional insight into what these condition differences mean, and how to place this work in the context of prior literature on this debate. In addition, some additional analyses would be useful to support the key claims of the paper.
We thank the reviewer for their very supportive comments. We have addressed their points below and have highlighted changes in our manuscript that we made in response to the reviewer’s comments.
(1) The framing should be reworked to place this work in the context of prior computational work on social learning. Some potentially relevant examples:
- Shafto, Goodman & Frank (2012) provide a computational account of the domainspecific inductive biases that support social learning. In brief, what makes social learning special is that we have an intuitive theory of how other people's unobservable mental states lead to their observable actions, and we use this intuitive theory to actively interpret social information. (There is also a wealth of behavioral evidence in children to support this account; for a review, see Gweon, 2021).
- Heyes (2012) provides a leaner account, arguing that social and non-social learning are supported by a common associative learning mechanism, and what distinguishes social from non-social learning is the input mechanism. Social learning becomes distinctively "social" to the extent that organisms are biased or attuned to social information.
I highlight these papers because they go a step beyond asking whether there is any difference between mechanisms that support social and nonsocial learning-they also provide concrete proposals about what that difference might be, and what might be shared. I would like to see this work move in a similar direction.
References
(In the interest of transparency: I am not an author on these papers.)Gweon, H. (2021). Inferential social learning: how humans learn from others and help others learn. PsyArXiv. https://doi.org/10.31234/osf.io/8n34t
Heyes, C. (2012). What's social about social learning?. Journal of Comparative Psychology, 126(2), 193.
Shafto, P., Goodman, N. D., & Frank, M. C. (2012). Learning from others: The consequences of psychological reasoning for human learning. Perspectives on Psychological Science, 7(4), 341-351.
Thank you for this suggestion to expand our framing. We have now made substantial changes to the Discussion and Introduction to include additional background literature, the relevant references suggested by the reviewer, addressing the differences between social and non-social learning. We further related our findings to other discussions in the literature that argue that differences between social and non-social learning might occur at the level of algorithms (the computations involved in social and non-social learning) and/or implementation (the neural mechanisms). Here, we describe behaviour with the same algorithm (Bayesian model), but the weighing of uncertainty on decision-making differs between social and non-social contexts. This might be explained by similar ideas put forward by Shafto and colleagues (2012), who suggest that differences between social and non-social learning might be due to the attribution of goal-directed intention to social agents, but not non-social cues. Such an attribution might lead participants to assume that advisor performances will be relatively stable under the assumption that they should have relatively stable goal-directed intentions. We also show differences at the implementational level in social and non-social learning in TPJ and dmPFC.
Below we list the changes we have made to the Introduction and Discussion. Further, we would also like to emphasize the substantial extension of the Bayesian modelling which we think clarifies the theoretical framework used to explain the mechanisms involved in social and non-social learning (see our answer to the next comments below).
Introduction, page 4:
[...]
Therefore, by comparing information sampling from social versus non-social sources, we address a long-standing question in cognitive neuroscience, the degree to which any neural process is specialized for, or particularly linked to, social as opposed to non-social cognition 2–9. Given their similarities, it is expected that both types of learning will depend on common neural mechanisms. However, given the importance and ubiquity of social learning, it may also be that the neural mechanisms that support learning from social advice are at least partially specialized and distinct from those concerned with learning that is guided by nonsocial sources.However, it is less clear on which level information is processed differently when it has a social or non-social origin. It has recently been argued that differences between social and non-social learning can be investigated on different levels of Marr’s information processing theory: differences could emerge at an input level (in terms of the stimuli that might drive social and non-social learning), at an algorithmic level or at a neural implementation level 7. It might be that, at the algorithmic level, associative learning mechanisms are similar across social and non-social learning 1. Other theories have argued that differences might emerge because goal-directed actions are attributed to social agents which allows for very different inferences to be made about hidden traits or beliefs 10. Such inferences might fundamentally alter learning about social agents compared to non-social cues.
Discussion, page 15:
[…] One potential explanation for the assumption of stable performance for social but not non-social predictors might be that participants attribute intentions and motivations to social agents. Even if the social and non-social evidence are the same, the belief that a social actor might have a goal may affect the inferences made from the same piece of information 10. Social advisors first learnt about the target’s distribution and accordingly gave advice on where to find the target. If the social agents are credited with goal-directed behaviour then it might be assumed that the goals remain relatively constant; this might lead participants to assume stability in the performances of social advisors. However, such goal-directed intentions might not be attributed to non-social cues, thereby making judgments inherently more uncertain and changeable across time. Such an account, focussing on differences in attribution in social settings aligns with a recent suggestion that any attempt to identify similarities or differences between social and non-social processes can occur at any one of a number of the levels in Marr’s information theory 7. Here we found that the same algorithm was able to explain social and non-social learning (a qualitatively similar computational model could explain both). However, the extent to which the algorithm was recruited when learning about social compared to non-social information differed. We observed a greater impact of uncertainty on judgments about social compared to non-social information. We have shown evidence for a degree of specialization when assessing social advisors as opposed to non-social cues. At the neural level we focused on two brain areas, dmPFC and pTPJ, that have not only been shown to carry signals associated with belief inferences about others but, in addition, recent combined fMRI-TMS studies have demonstrated the causal importance of these activity patterns for the inference process […]
(2) The results imply that dmPFC and pTPJ differentiate between learning from social and non-social sources. However, more work needs to be done to rule out simpler, deflationary accounts. In particular, the condition differences observed in dmPFC and pTPJ might reflect low-level differences between the two conditions. For example, the social task could simply have been more engaging to participants, or the social predictors may have been more visually distinct from one another than the fruits.
We understand the reviewer’s concern regarding low-level distinctions between the social and non-social condition that could confound for the differences in neural activation that are observed between conditions in areas pTPJ and dmPFC. From the reviewer’s comments, we understand that there might be two potential confounders: first, low-level differences such that stimuli within one condition might be more distinct to each other compared to the relative distinctiveness between stimuli within the other condition. Therefore, simply the greater visual distinctiveness of stimuli in one condition than another might lead to learning differences between conditions. Second, stimuli in one condition might be more engaging and potentially lead to attentional differences between conditions. We used a combination of univariate analyses and multivariate analyses to address both concerns.
Analysis 1: Univariate analysis to inspect potential unaccounted variance between social and non-social condition
First, we used the existing univariate analysis (exploratory MRI whole-brain analysis, see Methods) to test for neural activation that covaried with attentional differences – or any other unaccounted neural difference -- between conditions. If there were neural differences between conditions that we are currently not accounting for with the parametric regressors that are included in the fMRI-GLM, then these differences should be captured in the constant of the GLM model. For example, if there are attentional differences between conditions, then we could expect to see neural differences between conditions in areas such as inferior parietal lobe (or other related areas that are commonly engaged during attentional processes).
Importantly, inspection of the constant of the GLM model should capture any unaccounted differences, whether they are due to attention or alternative processes that might differ between conditions. When inspecting cluster-corrected differences in the constant of the fMRI-GLM model during the setting of the confidence judgment, there were no clustersignificant activation that was different between social and non-social conditions (Figure 4 – figure supplement 4a; results were familywise-error cluster-corrected at p<0.05 using a cluster-defining threshold of z>2.3). For transparency, we show the sub-threshold activation map across the whole brain (z > 2) for the ‘constant’ contrasted between social and nonsocial condition (i.e. constant, contrast: social – non-social).
For transparency we additionally used an ROI-approach to test differences in activation patterns that correlated with the constant during the confidence phase – this means, we used the same ROI-approach as we did in the paper to avoid any biased test selection. We compared activation patterns between social and non-social conditions in the same ROI as used before; dmPFC (MNI-coordinate [x/y/z: 2,44,36] 16), bilateral pTPJ (70% probability anatomical mask; for reference see manuscript, page 23) and additionally compared activation patterns between conditions in bilateral IPLD (50% probability anatomical mask, 20). We did not find significantly different activation patterns between social and non-social conditions in any of these areas: dmPFC (confidence constant; paired t-test social vs nonsocial: t(23) = 0.06, p=0.96, [-36.7, 38.75]), bilateral TPJ (confidence constant; paired t-test social vs non-social: t(23) = -0.06, p=0.95, [-31, 29]), bilateral IPLD (confidence constant; paired t-test social vs non-social: t(23) = -0.58, p=0.57, [-30.3 17.1]).
There were no meaningful activation patterns that differed between conditions in either areas commonly linked to attention (eg IPL) or in brain areas that were the focus of the study (dmPFC and pTPJ). Activation in dmPFC and pTPJ covaried with parametric effects such as the confidence that was set at the current and previous trial, and did not correlate with low-level differences such as attention. Hence, these results suggest that activation between conditions was captured better by parametric regressors such as the trial-wise interval setting, i.e. confidence, and are unlikely to be confounded by low-level processes that can be captured with univariate neural analyses.
Analysis 2: RSA to test visual distinctiveness between social and non-social conditions
We addressed the reviewer’s other comment further directly by testing whether potential differences between conditions might arise due to a varying degree of visual distinctiveness in one stimulus set compared to the other stimulus set. We used RSA analysis to inspect potential differences in early visual processes that should be impacted by greater stimulus similarity within one condition. In other words, we tested whether the visual distinctiveness of one stimuli set was different to the visual distinctiveness of the other stimuli set. We used RSA analysis to compare the Exemplar Discriminability Index (EDI) between conditions in early visual areas. We compared the dissimilarity of neural activation related to the presentation of an identical stimulus across trials (diagonal in RSA matrix) with the dissimilarity in neural activation between different stimuli across trials (off-diagonal in RSA matrix). If stimuli within one stimulus set are very similar, then the difference between the diagonal and off-diagonal should be very small and less likely to be significant (i.e. similar diagonal and off-diagonal values). In contrast, if stimuli within one set are very distinct from each other, then the difference between the diagonal and off-diagonal should be large and likely to result in a significant EDI (i.e. different diagonal and off-diagonal values) (see Figure 4g for schematic illustration). Hence, if there is a difference in the visual distinctiveness between social and non-social conditions, then this difference should result in different EDI values for both conditions – hence, visual distinctiveness between the stimuli set can be tested by comparing the EDI values between conditions within the early visual processing. We used a Harvard-cortical ROI mask based on bilateral V1. Negative EDI values indicate that the same exemplars are represented more similarly in the neural V1 pattern than different exemplars. This analysis showed that there was no significant difference in EDI between conditions (Figure 4 – figure supplement 4b; EDI paired sample t-test: t(23) = -0.16, p=0.87, 95% CI [-6.7 5.7]).
We have further replicated results in V1 with a whole-brain searchlight analysis, averaging across both social and non-social conditions.
In summary, by using a combination of univariate and multivariate analyses, we could test whether neural activation might be different when participants were presented with a facial or fruit stimuli and whether these differences might confound observed learning differences between conditions. We did not find meaningful neural differences that were not accounted for with the regressors included in the GLM. Further, we did not find differences in the visual distinctiveness between the stimuli sets. Hence, these control analyses suggest that differences between social and non-social conditions might not arise because of differences in low-level processes but are instead more likely to develop when learning about social or non-social information.
Moreover, we also examined behaviourally whether participants differed in the way they approached social and non-social condition. We tested whether there were initial biases prior to learning, i.e. before actually receiving information from either social or non-social information sources. Therefore, we tested whether participants have different prior expecations about the performance of social compared to non-social predictors. We compared the confidence judgments at the first trial of each predictor. We found that participants set confidence intervals very similarly in social and non-social conditions (Figure below). Hence, it did not seem to be the case that differences between conditions arose due to low level differences in stimulus sets or prior differences in expectations about performances of social compared to non-social predictors. However, we can show that differences between conditions are apparent when updating one’s belief about social advisors or non-social cues and as a consequence, in the way that confidence judgments are set across time.
Figure. Confidence interval for the first encounter of each predictor in social and non-social conditions. There was no initial bias in predicting the performance of social or non-social predictors.
Main text page 13:
[… ]
Additional control analyses show that neural differences between social and non-social conditions were not due to the visually different set of stimuli used in the experiment but instead represent fundamental differences in processing social compared to non-social information (Figure 4 – figure supplement 4). These results are shown in ROI-based RSA analysis and in whole-brain searchlight analysis. In summary, in conjunction, the univariate and multivariate analyses demonstrate that dmPFC and pTPJ represent beliefs about social advisors that develop over a longer timescale and encode the identities of the social advisors.References
- Heyes, C. (2012). What’s social about social learning? Journal of Comparative Psychology 126, 193–202. 10.1037/a0025180.
- Chang, S.W.C., and Dal Monte, O. (2018). Shining Light on Social Learning Circuits. Trends in Cognitive Sciences 22, 673–675. 10.1016/j.tics.2018.05.002.
- Diaconescu, A.O., Mathys, C., Weber, L.A.E., Kasper, L., Mauer, J., and Stephan, K.E. (2017). Hierarchical prediction errors in midbrain and septum during social learning. Soc Cogn Affect Neurosci 12, 618–634. 10.1093/scan/nsw171.
- Frith, C., and Frith, U. (2010). Learning from Others: Introduction to the Special Review Series on Social Neuroscience. Neuron 65, 739–743. 10.1016/j.neuron.2010.03.015.
- Frith, C.D., and Frith, U. (2012). Mechanisms of Social Cognition. Annu. Rev. Psychol. 63, 287–313. 10.1146/annurev-psych-120710-100449.
- Grabenhorst, F., and Schultz, W. (2021). Functions of primate amygdala neurons in economic decisions and social decision simulation. Behavioural Brain Research 409, 113318. 10.1016/j.bbr.2021.113318.
- Lockwood, P.L., Apps, M.A.J., and Chang, S.W.C. (2020). Is There a ‘Social’ Brain? Implementations and Algorithms. Trends in Cognitive Sciences, S1364661320301686. 10.1016/j.tics.2020.06.011.
- Soutschek, A., Ruff, C.C., Strombach, T., Kalenscher, T., and Tobler, P.N. (2016). Brain stimulation reveals crucial role of overcoming self-centeredness in self-control. Sci. Adv. 2, e1600992. 10.1126/sciadv.1600992.
- Wittmann, M.K., Lockwood, P.L., and Rushworth, M.F.S. (2018). Neural Mechanisms of Social Cognition in Primates. Annu. Rev. Neurosci. 41, 99–118. 10.1146/annurev-neuro080317-061450.
- Shafto, P., Goodman, N.D., and Frank, M.C. (2012). Learning From Others: The Consequences of Psychological Reasoning for Human Learning. Perspect Psychol Sci 7, 341– 351. 10.1177/1745691612448481.
- McGuire, J.T., Nassar, M.R., Gold, J.I., and Kable, J.W. (2014). Functionally Dissociable Influences on Learning Rate in a Dynamic Environment. Neuron 84, 870–881. 10.1016/j.neuron.2014.10.013.
- Behrens, T.E.J., Woolrich, M.W., Walton, M.E., and Rushworth, M.F.S. (2007). Learning the value of information in an uncertain world. Nature Neuroscience 10, 1214– 1221. 10.1038/nn1954.
- Meder, D., Kolling, N., Verhagen, L., Wittmann, M.K., Scholl, J., Madsen, K.H., Hulme, O.J., Behrens, T.E.J., and Rushworth, M.F.S. (2017). Simultaneous representation of a spectrum of dynamically changing value estimates during decision making. Nat Commun 8, 1942. 10.1038/s41467-017-02169-w.
- Allenmark, F., Müller, H.J., and Shi, Z. (2018). Inter-trial effects in visual pop-out search: Factorial comparison of Bayesian updating models. PLoS Comput Biol 14, e1006328. 10.1371/journal.pcbi.1006328.
- Wittmann, M., Trudel, N., Trier, H.A., Klein-Flügge, M., Sel, A., Verhagen, L., and Rushworth, M.F.S. (2021). Causal manipulation of self-other mergence in the dorsomedial prefrontal cortex. Neuron.
- Wittmann, M.K., Kolling, N., Faber, N.S., Scholl, J., Nelissen, N., and Rushworth, M.F.S. (2016). Self-Other Mergence in the Frontal Cortex during Cooperation and Competition. Neuron 91, 482–493. 10.1016/j.neuron.2016.06.022.
- Kappes, A., Harvey, A.H., Lohrenz, T., Montague, P.R., and Sharot, T. (2020). Confirmation bias in the utilization of others’ opinion strength. Nat Neurosci 23, 130–137. 10.1038/s41593-019-0549-2.
- Trudel, N., Scholl, J., Klein-Flügge, M.C., Fouragnan, E., Tankelevitch, L., Wittmann, M.K., and Rushworth, M.F.S. (2021). Polarity of uncertainty representation during exploration and exploitation in ventromedial prefrontal cortex. Nat Hum Behav. 10.1038/s41562-020-0929-3.
- Yu, Z., Guindani, M., Grieco, S.F., Chen, L., Holmes, T.C., and Xu, X. (2022). Beyond t test and ANOVA: applications of mixed-effects models for more rigorous statistical analysis in neuroscience research. Neuron 110, 21–35. 10.1016/j.neuron.2021.10.030.
- Mars, R.B., Jbabdi, S., Sallet, J., O’Reilly, J.X., Croxson, P.L., Olivier, E., Noonan, M.P., Bergmann, C., Mitchell, A.S., Baxter, M.G., et al. (2011). Diffusion-Weighted Imaging Tractography-Based Parcellation of the Human Parietal Cortex and Comparison with Human and Macaque Resting-State Functional Connectivity. Journal of Neuroscience 31, 4087– 4100. 10.1523/JNEUROSCI.5102-10.2011.
- Yu, A.J., and Cohen, J.D. Sequential effects: Superstition or rational behavior? 8.
- Nili, H., Wingfield, C., Walther, A., Su, L., Marslen-Wilson, W., and Kriegeskorte, N. (2014). A Toolbox for Representational Similarity Analysis. PLoS Comput Biol 10, e1003553. 10.1371/journal.pcbi.1003553.
- Lockwood, P.L., Wittmann, M.K., Nili, H., Matsumoto-Ryan, M., Abdurahman, A., Cutler, J., Husain, M., and Apps, M.A.J. (2022). Distinct neural representations for prosocial and self-benefiting effort. Current Biology 32, 4172-4185.e7. 10.1016/j.cub.2022.08.010.
-
eLife assessment
The authors use an elegant design to tackle a longstanding question about the extent to which learning social information relies on specialized computational and neural mechanism. They find that learning about ostensible others is more accurate than learning about non-social objects, despite identical statistical information, and that such effects are mediated by the dmPFC and pTPJ - regions previously implicated in social cognition. While likely of interest to a broad range of social, behavioral, and cognitive neuroscientists, the work is not sufficiently framed by relevant previous research. Moreover, the difference between social (faces) and non-social (fruits) stimuli raises concerns about attentional confounds.
-
Reviewer #1 (Public Review):
Trudel and colleagues aimed to uncover the neural mechanisms of estimating the reliability of the information from social agents and non-social objects. By combining functional MRI with a behavioural experiment and computational modelling, they demonstrated that learning from social sources is more accurate and robust compared with that from non-social sources. Furthermore, dmPFC and pTPJ were found to track the estimated reliability of the social agents (as opposed to the non-social objects).
The strength of this study is to devise a task consisting of the two experimental conditions that were matched in their statistical properties and only differed in their framing (social vs. non-social). The novel experimental task allows researchers to directly compare the learning from social and non-social sources, …
Reviewer #1 (Public Review):
Trudel and colleagues aimed to uncover the neural mechanisms of estimating the reliability of the information from social agents and non-social objects. By combining functional MRI with a behavioural experiment and computational modelling, they demonstrated that learning from social sources is more accurate and robust compared with that from non-social sources. Furthermore, dmPFC and pTPJ were found to track the estimated reliability of the social agents (as opposed to the non-social objects).
The strength of this study is to devise a task consisting of the two experimental conditions that were matched in their statistical properties and only differed in their framing (social vs. non-social). The novel experimental task allows researchers to directly compare the learning from social and non-social sources, which is a prominent contribution of the present study to social decision neuroscience.
One of the major weaknesses is the lack of a clear description about the conceptual novelty. Learning about the reliability/expertise of social and non-social agents has been of considerable concern in social neuroscience (e.g., Boorman et al., Neuron 2013; and Wittmann et al., Neuron 2016). The authors could do a better job in clarifying the novelty of the study beyond the previous literature.
Another weakness is the lack of justifications of the behavioural data analyses. It is difficult for me to understand why 'performance matching' is suitable for an index of learning accuracy. I understand the optimal participant would adjust the interval size with respect to the estimated reliability of the advisor (i.e., angular error); however, I am wondering if the optimal strategy for participants is to exactly match the interval size with the angular error. Furthermore, the definitions of 'confidence adjustment across trials' and 'learning index' look arbitrary.
As the authors assumed simple Bayesian learning for the estimation of reliability in this study, the degree/speed of the learning should be examined with reference to the distance between the posterior and prior belief in the optimal Bayesian inference.
-
Reviewer #2 (Public Review):
Humans learn about the world both directly, by interacting with it, and indirectly, by gathering information from others. There has been a longstanding debate about the extent to which social learning relies on specialized mechanisms that are distinct from those that support learning through direct interaction with the environment. In this work, the authors approach this question using an elegant within-subjects design that enables direct comparisons between how participants use information from social and non-social sources. Although the information presented in both conditions had the same underlying structure, participants tracked the performance of the social cue more accurately and changed their estimates less as a function of prediction error. Further, univariate activity in two regions-dmPFC and …
Reviewer #2 (Public Review):
Humans learn about the world both directly, by interacting with it, and indirectly, by gathering information from others. There has been a longstanding debate about the extent to which social learning relies on specialized mechanisms that are distinct from those that support learning through direct interaction with the environment. In this work, the authors approach this question using an elegant within-subjects design that enables direct comparisons between how participants use information from social and non-social sources. Although the information presented in both conditions had the same underlying structure, participants tracked the performance of the social cue more accurately and changed their estimates less as a function of prediction error. Further, univariate activity in two regions-dmPFC and pTPJ-tracked participants' confidence judgments more closely in the social than in the non-social condition, and multivariate patterns of activation in these regions contained information about the identity of the social cues.
Overall, the experimental approach and model used in this paper are very promising. However, after reading the paper, I found myself wanting additional insight into what these condition differences mean, and how to place this work in the context of prior literature on this debate. In addition, some additional analyses would be useful to support the key claims of the paper.
(1) The framing should be reworked to place this work in the context of prior computational work on social learning. Some potentially relevant examples:
- Shafto, Goodman & Frank (2012) provide a computational account of the domain-specific inductive biases that support social learning. In brief, what makes social learning special is that we have an intuitive theory of how other people's unobservable mental states lead to their observable actions, and we use this intuitive theory to actively interpret social information. (There is also a wealth of behavioral evidence in children to support this account; for a review, see Gweon, 2021).
- Heyes (2012) provides a leaner account, arguing that social and non-social learning are supported by a common associative learning mechanism, and what distinguishes social from non-social learning is the input mechanism. Social learning becomes distinctively "social" to the extent that organisms are biased or attuned to social information.I highlight these papers because they go a step beyond asking whether there is any difference between mechanisms that support social and nonsocial learning-they also provide concrete proposals about what that difference might be, and what might be shared. I would like to see this work move in a similar direction.
(2) The results imply that dmPFC and pTPJ differentiate between learning from social and non-social sources. However, more work needs to be done to rule out simpler, deflationary accounts. In particular, the condition differences observed in dmPFC and pTPJ might reflect low-level differences between the two conditions. For example, the social task could simply have been more engaging to participants, or the social predictors may have been more visually distinct from one another than the fruits.
References
(In the interest of transparency: I am not an author on these papers.)Gweon, H. (2021). Inferential social learning: how humans learn from others and help others learn. PsyArXiv. https://doi.org/10.31234/osf.io/8n34t
Heyes, C. (2012). What's social about social learning?. Journal of Comparative Psychology, 126(2), 193.
Shafto, P., Goodman, N. D., & Frank, M. C. (2012). Learning from others: The consequences of psychological reasoning for human learning. Perspectives on Psychological Science, 7(4), 341-351.
-
