A mechano-osmotic feedback couples cell volume to the rate of cell deformation
Curation statements for this article:-
Curated by eLife

Evaluation Summary:
The paper by Venkova et al. is a comprehensive study of mammalian cell volume dynamics during the common cellular process of adhesion and spreading on a flat substrate, osmotic changes, and mechanical confinement. The paper reveals a complex interplay between cell water/ion regulation, cytoskeletal processes, and mechanical deformation of the cell. The topic is important in cell physiology and should be of considerable interest to cell biologists, mechanobiologists and biophysicists.
(This preprint has been reviewed by eLife. We include the public reviews from the reviewers here; the authors also receive private feedback with suggested changes to the manuscript. Reviewer #1 agreed to share their name with the authors.)
This article has been Reviewed by the following groups
Discuss this preprint
Start a discussion What are Sciety discussions?Listed in
- Evaluated articles (eLife)
Abstract
Mechanics has been a central focus of physical biology in the past decade. In comparison, how cells manage their size is less understood. Here, we show that a parameter central to both the physics and the physiology of the cell, its volume, depends on a mechano-osmotic coupling. We found that cells change their volume depending on the rate at which they change shape, when they spontaneously spread or when they are externally deformed. Cells undergo slow deformation at constant volume, while fast deformation leads to volume loss. We propose a mechanosensitive pump and leak model to explain this phenomenon. Our model and experiments suggest that volume modulation depends on the state of the actin cortex and the coupling of ion fluxes to membrane tension. This mechano-osmotic coupling defines a membrane tension homeostasis module constantly at work in cells, causing volume fluctuations associated with fast cell shape changes, with potential consequences on cellular physiology.
Article activity feed
-

-

Author Response:
Reviewer #1:
The paper uses a microfluidic-based method of cell volume measurement to examine single cell volume dynamics during cell spreading and osmotic shocks. The paper successfully shows that the cell volume is largely maintained during cell spreading, but small volume changes depend on the rate of cell deformation during spreading, and cell ionic homeostasis. Specifically, the major conclusion that there is a mechano-osmotic coupling between cell shape and cell osmotic regulation, I think, is correct. Moreover, the observation that fast deforming cell has a larger volume change is informative.
The authors examined a large number of conditions and variables. It's a paper rich in data and general insights. The detailed mathematical model, and specific conclusions regarding the roles of ion channels and …
Author Response:
Reviewer #1:
The paper uses a microfluidic-based method of cell volume measurement to examine single cell volume dynamics during cell spreading and osmotic shocks. The paper successfully shows that the cell volume is largely maintained during cell spreading, but small volume changes depend on the rate of cell deformation during spreading, and cell ionic homeostasis. Specifically, the major conclusion that there is a mechano-osmotic coupling between cell shape and cell osmotic regulation, I think, is correct. Moreover, the observation that fast deforming cell has a larger volume change is informative.
The authors examined a large number of conditions and variables. It's a paper rich in data and general insights. The detailed mathematical model, and specific conclusions regarding the roles of ion channels and cytoskeleton, I believe, could be improved with further considerations.
We thank the referee for the nice comment on our work and for the detailed suggestions for improving it.
Major points of consideration are below.
- It would be very helpful if there is a discussion or validation of the FXm method accuracy. During spreading, the cell volume change is at most 10%. Is the method sufficiently accurate to consider 5-10% change? Some discussion about this would be useful for the reader.
This is an important point and we are sorry if it was not made clear in our initial manuscript. We have now made it more clear in the text (p. 4 and Figure S1E and S1F).
The important point is that the absolute accuracy of the volume measure is indeed in the 5 to 10% range, but the relative precision (repeated measures on the same cell) is much higher, rather in the 1% range, as detailed below based on experimental measures.
- Accuracy of absolute volume measurements. The accuracy of the absolute measure of the volume depends on several parameters which can vary from one experiment to the other: the exact height of the chamber, and the biological variability form one batch of cell to another (we found that the distribution of volumes in a population of cultured cells depends strongly on the details of the culture – seeding density, substrate, etc... - which we normalized as much as possible to reduce this variability, as described in previous articles, e.g. see2). To estimate this variability overall, the simplest is to compare the average volume of the cell population in different experiments, carried out in different chambers and on different days.
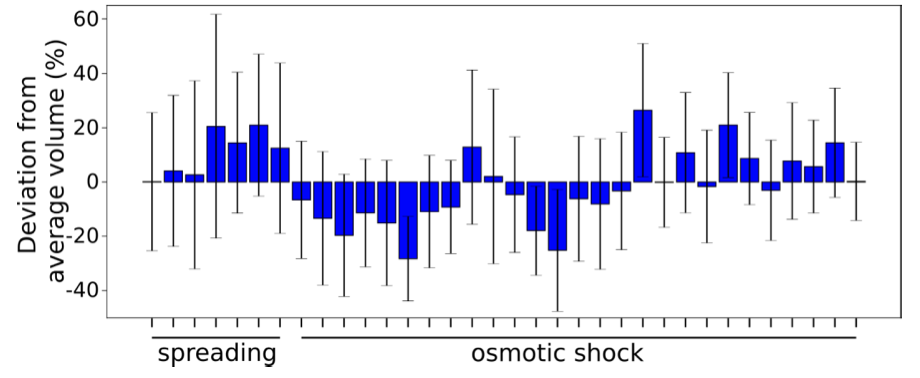
Graph showing the initial average volume of cells +/- STD for 7 spreading experiments and 27 osmotic shock experiments, expressed as a % deviation from the average volume over all the experiments.
The average deviation is of 10.9 +/- 8%
- Precision of relative volume measurements. When the same cell is imaged several times in a time-lapse experiment, as it is spreading on a substrate, or as it is swelling or shrinking during an osmotic shock, most of the variability occurring from one experiment to another does not apply. To experimentally assess the precision of the measure, we performed high time resolution (one image every 30 ms) volume measurements of 44 spread cells during 9 s. During this period of time, the volume of the cell should not change significantly, thus giving the precision of the measure.
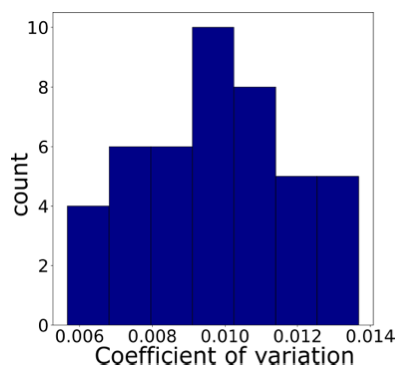
Graph showing the coefficient of variation of the volume (STD/mean) for each individual cell (n=44) across the almost 300 frames of the movie. This shows that on average the precision of volume measurements for the same cell is 0.97±0.21%. In addition, if more precision was needed, averaging several consecutive measures can further reduce the noise, a method which is very commonly used but that we did not have to apply to our dataset.
We have included these results in the revised manuscript, since they might help the reader to estimate what can be obtained from this method of volume measurement. We also point the reviewer to previous research articles using this method and showing both population averages and time-lapse data2–8 . Another validation of our volume measurement method comes from the relative volume changes in response to osmotic shock (Ponder’s relation) measured with FXm, which gave results very similar to the numbers of previously published studies. We actually performed these experiments to validate our method, since the results are not novel.
- The role of cell active contraction (myosin dynamics) is completely neglected. The membrane tether tension results, LatA and Y-compound results all indicate that there is a large influence of myosin contraction during cell spreading. I think most would not be surprised by this. But the model has no contribution from cortical/cytoskeletal active stress. The authors are correct that the osmotic pressure is much larger than hydraulic pressure, which is related to active contraction. But near steady state volume, the osmotic pressure difference must be equal to hydraulic pressure difference, as demanded by thermodynamics. Therefore, near equilibrium they must be close to each other in magnitude. During cell spreading, water dynamics is near equilibrium (given the magnitude of volume change), and therefore is it conceptually correct to neglect myosin active contraction? BTW, 1 solute model does not imply equal osmolarity between cytoplasm and external media. 1 solute model with active contraction was considered before, e.g., ref. 17 and Tao, et al, Biophys. J. 2015, and the steady state solution gives hydraulic pressure difference equal to osmotic pressure difference.
This is an excellent point raised by the referee. We have two types of answers for this. First an answer from an experimental point of view, which shows that acto-myosin contractility does not seem to play a direct role in the control of the cell volume, at least in the cells we used here. Based on these results we then propose a theoretical reason why this is the case. It contrasts with the view proposed in the articles mentioned by the referee for a reason which is not coming from the physical principles, with which we fully agree, but from the actual numbers, available in the literature, of the amount of the various types of osmolytes inside the cell. We give these points in more details below and we hope they will convince the referee. We also now mention them explicitly in the main text of the article (p. 6-7, Figure S3F) and in the Supplementary file with the model.
A. Experimental results
To test the effect of acto-myosin contraction on cell volume, we performed two experiments:
- We measured the volume of same cell before and after treatment with the Rho kinase ROCK inhibitor Y-27632, which decreases cortical contractility. The experiment was performed on cells plated on poly-L-Lysin (PLL), like osmotic shock experiments, a substrate on which cells adhere, allowing the change of solution, but do not spread and remain rounded. This allowed us to evaluate the effect of the drug. Cells were plated on PLL-coated glass. The change of medium itself (with control medium) induced a change of volume of less than 2%, similar to control osmotic shock experiments (maybe due to shear stress). When the cells were treated with Y-27, the change of volume was similar to the change with the control medium (now commented in the text p. 6-7, Figure S3F). To make the analysis more complete, we distinguished the cells that remained round throughout the experiment from the cells which slightly spread, since spreading could have an effect on volume. Indeed we observed that treatment with Y-27 induced more cells to spread (Figure S3F), probably because the cortex was less tensed, allowing the adhesive forces on PLL to induce more spreading9. Nevertheless, the spreading remained rather slow and the volume change of cells treated or not with Y-27 was not significantly different. This shows that, in the absence of fast spreading induced by Y-27, the reduction of contractility per se does not have any effect on the cell volume.
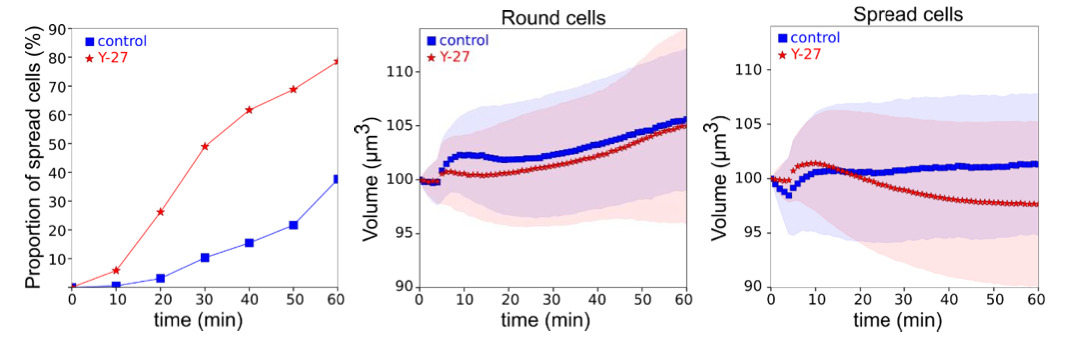
Graphs showing proportion of cells that spread during the experiments (left); average relative volume of round (middle) and spread (right) control (N=3, n=77) and Y-27 treated cells (N=4, N=297).
- To evaluate the impact of a reduction of contractility in the total absence of adhesion, we measured the average volume of control cells versus cells which have been pretreated with Y-27, plated on a non-adhesive substrate (PLL-PEG treatment). This experiment showed that the volume of the cells evolved similarly in time for both conditions, proving that contractility per se has no effect on the cell volume or cell growth, in the absence of spreading.
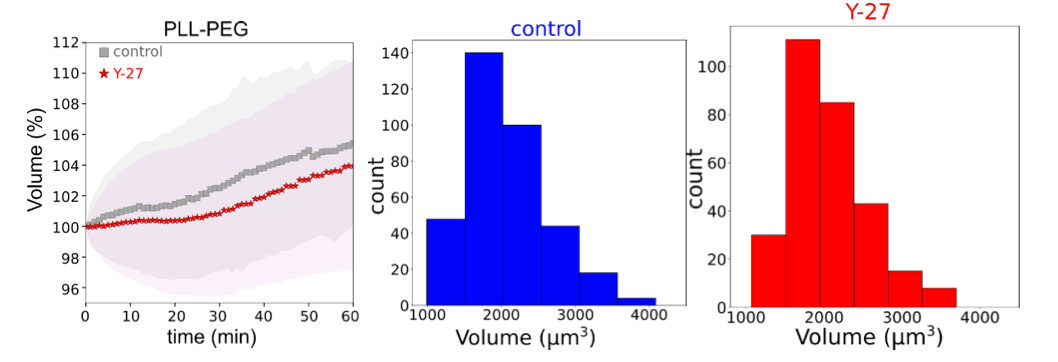
Graphs showing average relative volume of control (N=5, n=354) and Y-27 (N=3, n=292) treated cells plated on PLL-PEG (left); distributions of initial volume for control (middle) and Y-27 treated cells (right) represented on the left graph.
Taken together these results show that inhibition of contractility per se does not significantly affect cell volume. It thus confirms our interpretation of our results on cell spreading that reduction of contractility has an effect on cell volume, specifically in the context of cell spreading, primarily because it affects the spreading speed.
B. Theoretical interpretation
In accordance with our experiments, in our model, the effect of contractility is implicitly included in the model because it modulates the spreading dynamics, which is an input to the model, i.e. through the parameters tau_a and A_0.
We do not include the effect of contractility directly in the water transport equation because our quantitative estimates support that the contribution of the hydrostatic pressure to the volume (or the volume change) is negligible in comparison to the osmotic pressure, and this even for small variation near the steady-state volume. The main important point is that the concentration of ions inside the cell is actually much lower than outside of the cell10,11. The difference is about 100 mM and corresponds mostly to nonionic small trapped osmolytes, such as metabolites12. The osmotic pressure corresponding to this is about 10^5 Pa. Taking the cortical tension to be of order of 1 mN/m and cell size to be about ten microns we get a hydrostatic pressure difference of about 100 Pa due to cortical tension. A significant change in cell volume, of the order observed during cell spreading (let’s consider a ten percent decrease) will increase the osmotic pressure of the trapped nonionic osmolytes by 10^4 Pa (their number in the cell remaining identical). For this osmotic pressure to be balanced by an increase in the hydrostatic pressure, the cortical tension would need to increase by a factor of 100, which we consider to be unrealistic. Therefore, we find it reasonable to ignore the contribution of the hydrostatic pressure difference in the water flux equation. It is also consistent with the novel experiments presented above which show that inhibition of cortical contractility changes the cells volume below what can be detected by our measures (thus likely at maximum in the 1% range). This is now explained in the main text and Supplementary file.
Regarding our minimal model required to define cell volume, the reason why we believe one solute model is not sufficient is fundamentally the same as above: the concentration of trapped osmolytes is comparable to the total osmolarity, which means that their contribution to the total osmotic pressure cannot be discarded. Secondly, within the simplest one solute model, the pump and leak dynamics fixes in inner osmolytes concentration but does not involve the actual cell size. The most natural term that depends on the size is the Laplace pressure (inversely proportional to the cell size in a spherical cell model). But as discussed above, this term may only permit osmotic pressure differences of the order of 100 Pa, corresponding to an osmolytes concentration difference of the order of 0.1 mM. That is only a tiny fraction of the external medium osmolarity, which is about 300 mM. Such a model could thus only work for extremely fine tuning of the pump and leak rates to values with less than about 1% variation. Furthermore, such a model could not explain finite volume changes upon osmotic shocks without involving huge (100-fold) cell surface tension variations, as discussed above. For these reasons, we believe that the one-solute model is not appropriate to describe our experiments, and we feel that a trapped population of nonionic osmolytes is needed to balance the osmolarity difference created by the solute pump and leak.
In the revised version of the manuscript, we have now added a section in Supplementary file and in the main text, explaining in more detail this approximation.
- The authors considered the role of Na, K, and Cl in the model, and used pharmacological inhibitors of NHE exchanger. I think this part of the experiments and model are somewhat weak. I am not sure the conclusions drawn are robust. First there are many ion channels/pumps in regulating Na, K and Cl. The most important of which is NaK exchanger. NHE also involves H, and this is not in the model. The ion flux expressions in the model are also problematic. The authors correctly includes voltage and concentration dependences, but used a constant active term S_i in SM eq. 3 for active pumping. I am not sure this is correct. Ion pump fluxes have been studied and proposed expressions based on experimental data exist. A study of Na, K, Cl dynamics, and membrane voltage on cell volume dynamics was published in Yellen et al, Biophys. J. 2018. In that paper, they used different expressions based on previously proposed flux expressions. It might be correct that in small concentration differences, their expressions can be linearized or approximated to achieve similar expressions as here. But this point should be considered more carefully.
We thank the reviewer for this comment. Indeed, we have not well justified our use of the NHE inhibitor EIPA. Our aim was not to directly affect the major ion pumps involved in volume regulation (which would indeed rather be the Na+/K+ exchanger), because that would likely strongly impact the initial volume of the cell and not only the volume response to spreading, making the interpretation more difficult. We based our choice on previous publication, e.g.13, showing that EIPA inhibited the main fast volume changes previously reported for cultured cells: it was shown to inhibit volume loss in spreading cells, as well as mitotic cell swelling14,15. Using EIPA, we also found that, while the initial volume was only slightly affected, the volume loss was completely abolished even in fast spreading cells (Y-27 and EIPA combined treatment, Figure S5H). This clearly proves that the volume loss behavior can be abolished, without changing the speed of spreading, which was our main aim with this experiment.
The most direct effect of inhibiting NHE exchangers is to change the cell pH16,17, which, given the low number of H protons in the cell (negligible contribution to cells osmotic pressure), cannot affect the cell volume directly. A well-studied mechanism through which proton transport can have indirect effect on cell volume is through the effect of pH on ion transporters or due to the coupling between NHE and HCO3/Cl exchanger. The latter case is well studied in the literature18. In brief, the flux of proton out of the cell through the NHE due to Na gradient leads to an outflux of HC03 and an influx of Cl. The change in Cl concentration will have an effect on the osmolarity and cell volume.
We thus performed hyperosmotic shocks with this drug and we found that, as expected, it had no effect on the immediate volume change (the Ponder’s relation), but affected the rate of volume recovery (combined with cell growth). Overall, the cells treated with EIPA showed a faster volume increase, which is what is expected if active pumping rate is reduced. This is in contrast with the above mentioned mechanism of volume regulation which will to lead to a reduced volume recovery of EIPA treated cells. This leads us to conclude that there is potentially another effect of NHE perturbation. Changing the pH will have a large impact on the functioning of many other processes, in particular, it can have an effect on ion transport16. Overall, the cells treated with EIPA showed a faster volume increase, which is what is expected if active pumping rate is reduced.
On the model side, the referee correctly points out that there are many ion transporters that are known to play a role in volume regulation which are not included in Eq. 3. In the revised manuscript we now start with a more general ion transport equation. We show that the main equation (Eq.1 - or Supplementary file Eq.13) relating volume change to tension is not affected by this generalization. This is because we consider only the linear relation between the small changes in volume and tension. We note that the generic description of the PML (Supplementary file Eqs.1-6) can be seen as general and does not require the pump and channel rates to be constant; both \Lambda_i and S_i can be a function of potential and ion concentration along with membrane tension. It is only later in the analysis that we do make the assumption that these parameters only depend on tension. This point is now made clear in the Supplementary file.
There is a huge body of work both theoretical and experimental in which the effect of different ion transporters on cell volume is analyzed. The aim of this work is not to provide an analysis of cell volume and the effect of various co-transporters but is rather limited to understanding the coupling between cell spreading, surface tension and cell volume.
To analytically estimate the sign of the mechano-osmotic coupling parameter alpha we use a minimal model. For this we indeed take the pumps and channels to be constant. As it is again a perturbative expansion around the steady state concentration, electric potential, and volume, the expression of alpha can be easily computed for a model with more general ion transporters. This generalization will come at the cost of additional parameters in the alpha expression. We decided to keep the simpler transport model, the goal of this estimate is merely to show that the sign of alpha is not a given and depends on relative values of parameters. Even for the simple model we present, the sign of alpha could be changed by varying parameters within reasonable ranges.
Given these points, and the clarification of the reasons to use EIPA in our experiments, a full mechanistic explanation of the effect of this drug is beyond the scope of this work. Because of this we are not analyzing the effect of EIPA on the model parameter alpha in detail. We now clarified our interpretation of these results in the main text of the article.
Reviewer #2:
The work by Venkova et al. addresses the role of plasma membrane tension in cell volume regulation. The authors study how different processes that exert mechanical stress on cells affect cell volume regulation, including cell spreading, cell confinement and osmotic shock experiments. They use live cell imaging, FXm (cell volume) and AFM measurements and perform a comparative approach using different cell lines. As a key result the authors find that volume regulation is associated with cell spreading rate rather than absolute spreading area. Pharmacological assays further identified Arp2/3 and NHE1 as molecular regulators of volume loss during cell spreading. The authors present a modified mechano-osmotic pump and leak model (PLM) based on the assumption of a mechanosensitive regulation of ion flux that controls cell volume.
This work presents interesting data and theoretical modelling that contribute new insight into the mechanisms of cell volume regulation.
We thank the referee for the nice comments on our work. We really appreciate the effort (s)he made to help us improve our article, including the careful inspection of the figures. We think our work is much improved thanks to his/her input.
Reviewer #3:
The study by Venkova and co-workers studies the coupling between cell volume and the osmotic balance of the cell. Of course, a lot of work as already been done on this subject, but the main specific contribution of this work is to study the fast dynamics of volume changes after several types of perturbations (osmotic shocks, cell spreading, and cell compression). The combination of volume dynamics at very high time resolution, and the robust fits obtained from an adapted Pump and Leak Model (PLM) makes the article a step-forward in our understanding of how cell volume is regulated during cell deformations. The authors clearly show that:
-The rate at which cell deforms directly impacts the volume change
-Below a certain deformation rate (either by cell spreading or external compression), the cells adapt fast enough not to change their volume. The plot dV/dt vs dA/dt shows a clear proportionality relation.
-The theoretical description of volume change dynamics with the extended PLM makes the overall conclusions very solid.
Overall the paper is very well written, contains an impressive amount of quantitative data, comparing several cell types and physiological and artificial conditions.
We thank the referee for the positive comment on our work.
My main concern about this study is related to the role of membrane tension. In the PLM model, the coupling of cell osmosis to cell deformation is made through the membrane-tension dependent activity of ion channels. While the role of ion channels is extensively tested, it brings some surprising results. Moreover, the tension is measured only at fixed time points, and the comparison to theoretical predictions is not always as convincing as expected: when comparing fig 6I and 6J, I see that predictions shows that EIPA (+ or - Y27), CK-666 (+ or - Y27) and Y27 alone should have lower tension than in the control conditions, and this is clearly not the case in fig 6J. But I would not like to emphasize too much on those discrepancies, as the drugs in the real case must have broad effects that may not be directly comparable to the theory.
We apologize for the mislabeling of the Figure 6I (now Figure 5I). This plot shows the theoretical estimate for the difference in tension (in the units of homeostatic tension) between the case when the cell loses its volume upon spreading (as observed in experiments) compared to the hypothetical situation when the cell does not lose volume upon spreading (alpha = 0). The positive value of the tension difference predicts that the cell tension would have been higher if the cell were not losing volume upon spreading, which is the case for the treatments with EIPA and CK-666 (+ Y27) and corresponds to what we found experimentally.
It thus matches our experimental observations for drug treatments which reduce or abolish the volume loss during spreading and correspond to higher tether force only at short time.
We have corrected the figure and figure legend and explained it better in the text.
But I wonder if the authors would have a better time showing that the dynamics of tension are as predicted by theory in the first place, as comparing theoretical predictions with experiments using drugs with pleiotropic effects may be hazardous.
Actually, a recent publication (https://doi.org/10.1101/2021.01.22.427801) shows that tension follows volume changes during osmotic shocks, and overall find the same dynamics of volume changes than in this manuscript. I am thus wondering if the authors could use the same technique than describe in this paper (FLIM of flipper probe) in order to study the dynamics of tension in their system, or at least refer to this paper in order to support their claim that tension is the coupling factor between volume and deformation.
As was suggested by the referee, we tried to use the FLIPPER probe. We first tried to reproduce osmotic shock experiments adding to the HeLa cells 4% of PEG400 (+~200 mOsm) or 50% of H20 (-~170 mOsm) and measuring the average probe lifetime before and after the shock. We found significantly lower probe lifetime for hyperosmotic condition compared with control, and non-significant, but slightly higher lifetime for hypoosmotic shock. The magnitude of lifetime changes was comparable with the study cited by the reviewer, but the quality of our measures did not allow us to have a better resolution. Next we measured average lifetime for control and CK-666+Y-27 treated cells 30 min and 3 h after plating, because we have highest tether force values for CK-666+Y-27 at 30 min. We did not see a change in lifetime in control cells between 30 min and 3 h (which also did not see with the tether pulling). Cells treated with CK-666+Y-27 showed a slightly lower lifetime values than control cells, but both 30 min and 3 h after plating, which means that it did not correspond to the transient effect of fast spreading but probably rather to the effect of the drugs on the measure.
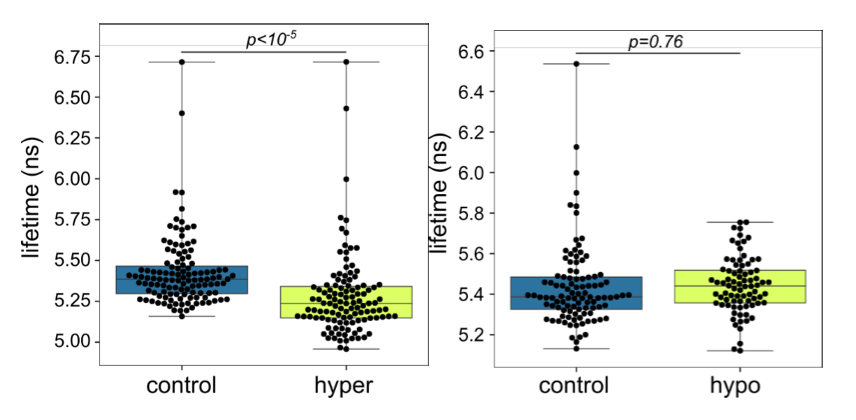
Graph showing FLIPPER lifetime before and after osmotic shock for HeLa cells plated on PLL- coated substrate. Left: control (N=3, n=119) and hyperosmotic shock (N=3, n=115); Right: control (N=3, n=101) and hypoosmotic shock (N=3, n=80). p-value are obtained by t-test.
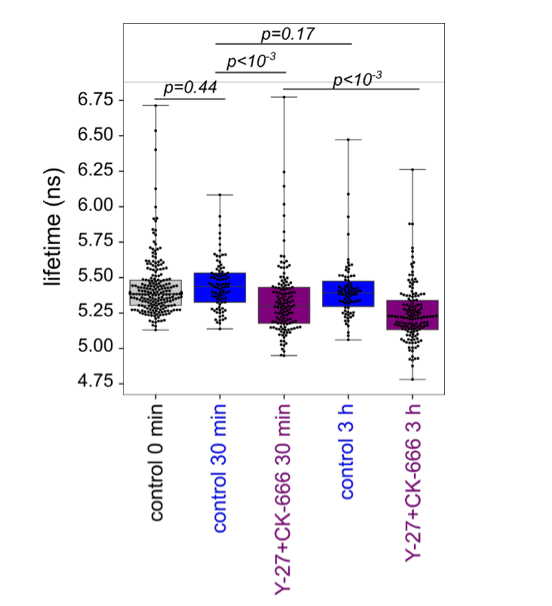
Graph showing FLIPPER lifetime for control just after the plating on PLL-coated glass (the same data for control shown at the previous graph), 30 min (control: N=3, n=88; Y-27+CK-666: N=3, n=130) and 3 h (control: N=3, n=78; Y-27+CK-666: N=3, n=142) after plating on fibronectin-coated glass. p-value are obtained by t-test.
Because the cell to cell variability might mask the trend of single cell changes in lifetime during spreading, we also tried to follow the lifetime of individual cells every 5 min along the spreading. Most illuminated cells did not spread, while cells in non-illuminated fields of view spread well, suggesting that even with an image every 5 minutes and the lowest possible illumination, the imaging was too toxic to follow cell spreading in time. We could obtain measures for a few cells, which did not show any particular trend, but their spreading was not normal. So we cannot really conclude much from these experiments.
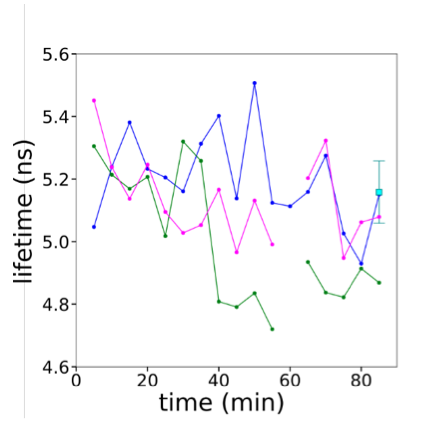
Graph showing FLIPPER lifetime changes for 3 individual cells plated on fibronectin-coated glass (shown in blue, magenta and green) and average lifetime of cells from non-illuminated field (cyan, n=7)
Our conclusions are the following:
We are able to visualize some change in the lifetime of the probe for osmotic shock experiments, similar to the published results, but with a rather large cell to cell variability.
The spreading experiments comparing 30 minutes and 3 hours, in control or drug treated cells did not reproduce the results we observed with tether pulling, with a global effect of the drugs on the measures at both 30 min and 3 hours.
Following single cells in time led to too much toxicity and prevented normal spreading.
We think that this technology, which is still in its early developments, especially in terms of the microscope setting that has to be used (and we do not have it in our Institute, so we had to go on a platform in another institute with limited time to experiment), cannot be implemented in the frame of the revision of this article to provide reliable results. We thus consider that these experiments are for further development of the work and are out of the scope of this study. It would be very interesting to study in details the comparison between the oldest and more established method of tether pulling and the novel method of the FLIPPER probe, during cell spreading and in other contexts. To our knowledge this has never been done so far, so it is not in the frame of this study that we can do it. It is not clear from the literature that the two methods would measure the same thing in all conditions even if they might match in some.
-
Evaluation Summary:
The paper by Venkova et al. is a comprehensive study of mammalian cell volume dynamics during the common cellular process of adhesion and spreading on a flat substrate, osmotic changes, and mechanical confinement. The paper reveals a complex interplay between cell water/ion regulation, cytoskeletal processes, and mechanical deformation of the cell. The topic is important in cell physiology and should be of considerable interest to cell biologists, mechanobiologists and biophysicists.
(This preprint has been reviewed by eLife. We include the public reviews from the reviewers here; the authors also receive private feedback with suggested changes to the manuscript. Reviewer #1 agreed to share their name with the authors.)
-
Reviewer #1 (Public Review):
The paper uses a microfluidic-based method of cell volume measurement to examine single cell volume dynamics during cell spreading and osmotic shocks. The paper successfully shows that the cell volume is largely maintained during cell spreading, but small volume changes depend on the rate of cell deformation during spreading, and cell ionic homeostasis. Specifically, the major conclusion that there is a mechano-osmotic coupling between cell shape and cell osmotic regulation, I think, is correct. Moreover, the observation that fast deforming cell has a larger volume change is informative.
The authors examined a large number of conditions and variables. It's a paper rich in data and general insights. The detailed mathematical model, and specific conclusions regarding the roles of ion channels and cytoskeleton, …
Reviewer #1 (Public Review):
The paper uses a microfluidic-based method of cell volume measurement to examine single cell volume dynamics during cell spreading and osmotic shocks. The paper successfully shows that the cell volume is largely maintained during cell spreading, but small volume changes depend on the rate of cell deformation during spreading, and cell ionic homeostasis. Specifically, the major conclusion that there is a mechano-osmotic coupling between cell shape and cell osmotic regulation, I think, is correct. Moreover, the observation that fast deforming cell has a larger volume change is informative.
The authors examined a large number of conditions and variables. It's a paper rich in data and general insights. The detailed mathematical model, and specific conclusions regarding the roles of ion channels and cytoskeleton, I believe, could be improved with further considerations.
Major points of consideration are below.
It would be very helpful if there is a discussion or validation of the FXm method accuracy. During spreading, the cell volume change is at most 10%. Is the method sufficiently accurate to consider 5-10% change? Some discussion about this would be useful for the reader.
The role of cell active contraction (myosin dynamics) is completely neglected. The membrane tether tension results, LatA and Y-compound results all indicate that there is a large influence of myosin contraction during cell spreading. I think most would not be surprised by this. But the model has no contribution from cortical/cytoskeletal active stress. The authors are correct that the osmotic pressure is much larger than hydraulic pressure, which is related to active contraction. But near steady state volume, the osmotic pressure difference must be equal to hydraulic pressure difference, as demanded by thermodynamics. Therefore, near equilibrium they must be close to each other in magnitude. During cell spreading, water dynamics is near equilibrium (given the magnitude of volume change), and therefore is it conceptually correct to neglect myosin active contraction? BTW, 1 solute model does not imply equal osmolarity between cytoplasm and external media. 1 solute model with active contraction was considered before, e.g., ref. 17 and Tao, et al, Biophys. J. 2015, and the steady state solution gives hydraulic pressure difference equal to osmotic pressure difference.
The authors considered the role of Na, K, and Cl in the model, and used pharmacological inhibitors of NHE exchanger. I think this part of the experiments and model are somewhat weak. I am not sure the conclusions drawn are robust. First there are many ion channels/pumps in regulating Na, K and Cl. The most important of which is NaK exchanger. NHE also involves H, and this is not in the model. The ion flux expressions in the model are also problematic. The authors correctly includes voltage and concentration dependences, but used a constant active term S_i in SM eq. 3 for active pumping. I am not sure this is correct. Ion pump fluxes have been studied and proposed expressions based on experimental data exist. A study of Na, K, Cl dynamics, and membrane voltage on cell volume dynamics was published in Yellen et al, Biophys. J. 2018. In that paper, they used different expressions based on previously proposed flux expressions. It might be correct that in small concentration differences, their expressions can be linearized or approximated to achieve similar expressions as here. But this point should be considered more carefully.
-
Reviewer #2 (Public Review):
The work by Venkova et al. addresses the role of plasma membrane tension in cell volume regulation. The authors study how different processes that exert mechanical stress on cells affect cell volume regulation, including cell spreading, cell confinement and osmotic shock experiments. They use live cell imaging, FXm (cell volume) and AFM measurements and perform a comparative approach using different cell lines. As a key result the authors find that volume regulation is associated with cell spreading rate rather than absolute spreading area. Pharmacological assays further identified Arp2/3 and NHE1 as molecular regulators of volume loss during cell spreading. The authors present a modified mechano-osmotic pump and leak model (PLM) based on the assumption of a mechanosensitive regulation of ion flux that …
Reviewer #2 (Public Review):
The work by Venkova et al. addresses the role of plasma membrane tension in cell volume regulation. The authors study how different processes that exert mechanical stress on cells affect cell volume regulation, including cell spreading, cell confinement and osmotic shock experiments. They use live cell imaging, FXm (cell volume) and AFM measurements and perform a comparative approach using different cell lines. As a key result the authors find that volume regulation is associated with cell spreading rate rather than absolute spreading area. Pharmacological assays further identified Arp2/3 and NHE1 as molecular regulators of volume loss during cell spreading. The authors present a modified mechano-osmotic pump and leak model (PLM) based on the assumption of a mechanosensitive regulation of ion flux that controls cell volume.
This work presents interesting data and theoretical modelling that contribute new insight into the mechanisms of cell volume regulation.
-
Reviewer #3 (Public Review):
The study by Venkova and co-workers studies the coupling between cell volume and the osmotic balance of the cell. Of course, a lot of work as already been done on this subject, but the main specific contribution of this work is to study the fast dynamics of volume changes after several types of perturbations (osmotic shocks, cell spreading, and cell compression). The combination of volume dynamics at very high time resolution, and the robust fits obtained from an adapted Pump and Leak Model (PLM) makes the article a step-forward in our understanding of how cell volume is regulated during cell deformations. The authors clearly show that:
-The rate at which cell deforms directly impacts the volume change
-Below a certain deformation rate (either by cell spreading or external compression), the cells adapt fast …
Reviewer #3 (Public Review):
The study by Venkova and co-workers studies the coupling between cell volume and the osmotic balance of the cell. Of course, a lot of work as already been done on this subject, but the main specific contribution of this work is to study the fast dynamics of volume changes after several types of perturbations (osmotic shocks, cell spreading, and cell compression). The combination of volume dynamics at very high time resolution, and the robust fits obtained from an adapted Pump and Leak Model (PLM) makes the article a step-forward in our understanding of how cell volume is regulated during cell deformations. The authors clearly show that:
-The rate at which cell deforms directly impacts the volume change
-Below a certain deformation rate (either by cell spreading or external compression), the cells adapt fast enough not to change their volume. The plot dV/dt vs dA/dt shows a clear proportionality relation.
-The theoretical description of volume change dynamics with the extended PLM makes the overall conclusions very solid.
Overall the paper is very well written, contains an impressive amount of quantitative data, comparing several cell types and physiological and artificial conditions.
My main concern about this study is related to the role of membrane tension. In the PLM model, the coupling of cell osmosis to cell deformation is made through the membrane-tension dependent activity of ion channels. While the role of ion channels is extensively tested, it brings some surprising results. Moreover, the tension is measured only at fixed time points, and the comparison to theoretical predictions is not always as convincing as expected: when comparing fig 6I and 6J, I see that predictions shows that EIPA (+ or - Y27), CK-666 (+ or - Y27) and Y27 alone should have lower tension than in the control conditions, and this is clearly not the case in fig 6J. But I would not like to emphasize too much on those discrepancies, as the drugs in the real case must have broad effects that may not be directly comparable to the theory.
But I wonder if the authors would have a better time showing that the dynamics of tension are as predicted by theory in the first place, as comparing theoretical predictions with experiments using drugs with pleiotropic effects may be hazardous.
Actually, a recent publication (https://doi.org/10.1101/2021.01.22.427801) shows that tension follows volume changes during osmotic shocks, and overall find the same dynamics of volume changes than in this manuscript. I am thus wondering if the authors could use the same technique than describe in this paper (FLIM of flipper probe) in order to study the dynamics of tension in their system, or at least refer to this paper in order to support their claim that tension is the coupling factor between volume and deformation.
-
