Hepatic MIR20B promotes nonalcoholic fatty liver disease by suppressing PPARA
Curation statements for this article:-
Curated by eLife

Evaluation Summary:
The manuscript by Lee et al. provides mechanistic insight into the regulatory role of micro RNAs in modulating nuclear receptor expression and function. This is likely to have a high impact on the field as nuclear receptor regulation of metabolic disease is well established, however, the molecular mechanisms governing this process still remains unknown largely. Lee et al.'s manuscript provides a molecular target (miR-20b) that holds therapeutic potential in improving hepatic steatosis.
(This preprint has been reviewed by eLife. We include the public reviews from the reviewers here; the authors also receive private feedback with suggested changes to the manuscript. Reviewer #2 agreed to share their name with the authors.)
This article has been Reviewed by the following groups
Discuss this preprint
Start a discussion What are Sciety discussions?Listed in
- Evaluated articles (eLife)
Abstract
Non-alcoholic fatty liver disease (NAFLD) is characterized by excessive lipid accumulation and imbalances in lipid metabolism in the liver. Although nuclear receptors (NRs) play a crucial role in hepatic lipid metabolism, the underlying mechanisms of NR regulation in NAFLD remain largely unclear.
Methods:
Using network analysis and RNA-seq to determine the correlation between NRs and microRNA in human NAFLD patients, we revealed that MIR20B specifically targets PPARA. MIR20B mimic and anti- MIR20B were administered to human HepG2 and Huh-7 cells and mouse primary hepatocytes as well as high-fat diet (HFD)- or methionine-deficient diet (MCD)-fed mice to verify the specific function of MIR20B in NAFLD. We tested the inhibition of the therapeutic effect of a PPARα agonist, fenofibrate, by Mir20b and the synergic effect of combination of fenofibrate with anti- Mir20b in NAFLD mouse model.
Results:
We revealed that MIR20B specifically targets PPARA through miRNA regulatory network analysis of nuclear receptor genes in NAFLD. The expression of MIR20B was upregulated in free fatty acid (FA)-treated hepatocytes and the livers of both obesity-induced mice and NAFLD patients. Overexpression of MIR20B significantly increased hepatic lipid accumulation and triglyceride levels. Furthermore, MIR20B significantly reduced FA oxidation and mitochondrial biogenesis by targeting PPARA . In Mir20b -introduced mice, the effect of fenofibrate to ameliorate hepatic steatosis was significantly suppressed. Finally, inhibition of Mir20b significantly increased FA oxidation and uptake, resulting in improved insulin sensitivity and a decrease in NAFLD progression. Moreover, combination of fenofibrate and anti- Mir20b exhibited the synergic effect on improvement of NAFLD in MCD-fed mice.
Conclusions:
Taken together, our results demonstrate that the novel MIR20B targets PPARA , plays a significant role in hepatic lipid metabolism, and present an opportunity for the development of novel therapeutics for NAFLD.
Funding:
This research was funded by Korea Mouse Phenotyping Project (2016M3A9D5A01952411), the National Research Foundation of Korea (NRF) grant funded by the Korea government (2020R1F1A1061267, 2018R1A5A1024340, NRF-2021R1I1A2041463, 2020R1I1A1A01074940, 2016M3C9A394589324), and the Future-leading Project Research Fund (1.210034.01) of UNIST.
Article activity feed
-

-

Author Response:
Reviewer #1:
Lee et al. identify miR-20b as a molecular regulator of hepatic lipid metabolism through the post-transcriptional regulation of the nuclear receptor PPAR alpha. Through mechanistic studies the authors identified the 3'UTR of PPARa as a direct target for miR-20b regulation of expression. The experiments are well controlled and the study provides deep mechanistic insight into the miR-20b/PPARa circuit in modulating hepatic lipid metabolism. Furthermore, the authors provide evidence that targeting the miR-20b pathway to enhance PPARa activation via synthetic ligand fenofibrate. The studies provide much needed mechanistic insight into molecular regulators of hepatic lipid metabolism in response to nutrient stress such as high fat diet. While this is a detailed and thorough assessment of this pathway, there …
Author Response:
Reviewer #1:
Lee et al. identify miR-20b as a molecular regulator of hepatic lipid metabolism through the post-transcriptional regulation of the nuclear receptor PPAR alpha. Through mechanistic studies the authors identified the 3'UTR of PPARa as a direct target for miR-20b regulation of expression. The experiments are well controlled and the study provides deep mechanistic insight into the miR-20b/PPARa circuit in modulating hepatic lipid metabolism. Furthermore, the authors provide evidence that targeting the miR-20b pathway to enhance PPARa activation via synthetic ligand fenofibrate. The studies provide much needed mechanistic insight into molecular regulators of hepatic lipid metabolism in response to nutrient stress such as high fat diet. While this is a detailed and thorough assessment of this pathway, there are several issues that were identified in the review of this article outlined below:
- The authors state there is no off target expression of miR-20b in adipose tissue in their over expression experiments. However, per figure 4 supplement 1, EpiWAT has increased expression over controls in HFD fed conditions. Furthermore, figure 4 supplement 2 shows a functional difference in EpiWAT weight in HFD where miR-20b treated mice have higher fat weight. The authors need at the least to discuss the potential role of adipose tissue in promoting their observed phenotype.
This is a good point. We increased the number of samples and carefully analyzed the changes of both the expression of Mir20b and the weight of epididymal adipose tissue. We observed that slight increase of Mir20b expression in epididymal adipose tissue of AAV- miR20b HFD-fed mice compared to AAV-control NCD-fed mice, not HFD-fed mice. The expression of Mir20b in adipose tissue of between AAV-control HFD and AAV-Mir20b HFD mice was not significantly changed (Figure 5-figure supplement 1).
We have revised the text and added the discussion about the potential role of adipose tissue (page 25-26, line 582-594). Hepatic steatosis could be affected by adipose tissue through free fatty acid (FFA) release and hepatic uptake of circulating FFAs (Rasineni et al., 2021). Our results showed that the epididymal adipose tissue of HFD-fed mice was enlarged upon AAV-Mir20b treatment; however, the serum FFA levels in these mice were comparable to those in mice treated with the AAV-Control (Figure 5-figure supplement 4B)). Of note, the expression of genes related to lipolysis did not change in adipose tissues, and that of hepatic FA transporter, CD36, was decreased by AAV-Mir20b treatment (Figure 5Q and Figure 5-figure supplement 4A). In addition, excess hepatic triglycerides (TGs) are secreted as very low density lipoproteins (VLDLs), and the secretion rate increases with the TG level (Fabbrini et al., 2008). VLDLs deliver TGs from the liver to adipose tissue and contributes expansion of adipose tissue (Chiba et al., 2003). Together, these reports suggest that adipose tissue is also remodeled by the liver in HFD-fed mice and non-alcoholic fatty liver disease (NAFLD) patients. Therefore, the levels of hepatic TGs are unlikely affected by epididymal adipose tissue, and the increase in fat content (Figure 5-figure supplement 3) may be a consequence of increased hepatic TG levels.
- Figure 5 shows anti-miR-20b essentially restores PPARa expression. However, the rescue effects in terms of body weight, liver triglycerides and liver damage are only modestly improved. The authors need to discuss this modest effect and potentially offer alternative mechanisms aside from PPARa as the physiological target.
Previously, we introduced AAV treatment after four weeks of high fat diet (HFD) feeding. Anti-Mir20b treatment significantly changed the expression of PPARA; however, the effect on the pathophysiological properties of the liver was significant but modest. We thought that this was because there was not enough time to make a proper impact on the liver. Thus, to maximize the effect of ani-Mir20b, the AAV was administered when the HFD was started. The new results showed more significant effects of anti-Mir20b (Figure 6).
We also observed that other nuclear receptors, such as RORA, RORC, and THRB, could be potential targets of MIR20B (Figure 2H and Figure 2-figure supplement 3). However, in the patient data, there was no significant correlation between the expression of those nuclear receptors and that of MIR20B. In addition, among the candidate targets, only PPARA was selected as an overlapped predicted target of MIR20B by various miRNA target prediction programs, including miRDB, picTAR, TargetSCAN, and miRmap (Figure 2J, Figure 2-figure supplement 2). Consistent with these results, we observed that Ppara, not other nuclear receptors, is the target gene of MiR20b in both AAV-Mir20b and AAV-anti- Mir20b mice (Figure 5-figure supplement 2, Figure 6-figure supplement 2). Thus, we focused on PPARA as a MIR20B target in NAFLD.
- The authors performed experiments with mutated 3'UTR of PPARa and show mutated PPARa is refractory to regulation by miR-20b. However, the authors provide no functional evidence that mutating the 3'UTR of PPARa elicits changes in hepatic lipid metabolism. Discussion of this point is needed at the minimal.
Thank you for your comment. To provide functional evidence, we tried to establish the PPARA 3’UTR mutation knock-in (KI) system in cells. However, we could not succeed because of technical difficulties and time constraints. Alternatively, we introduced the wild type PPARA open reading frame (ORF) followed by either the wild type (WT) or mutant (Mut) 3’UTR of PPARA in HepG2 cells, and analyzed the importance of the 3’UTR of PPARA. As shown in Figure 2-figure supplement 5C, MIR20B significantly suppressed the expression of PPARA and its target genes in PPARA-3’UTR WT expressing cells. Furthermore, Oil Red O staining showed that MIR20B expression increased the intracellular lipid content in these cells (Figure 2-figure supplement 5B). However, MIR20B did not have an effect on either the expression of PPARA and its target genes or intracellular lipid content in PPARA-3’UTR Mut expressing cells (Figure 2-figure supplement 5C, D). We have added the new results in page 17-18, line 350-359 and Figure 2-figure supplement 5.
Reviewer #2:
- In the experiments depicted in Figures 1D and E, did OA treatment of HepG2 and/or Huh-7 cells produce a reduction in the levels of mRNA encoding PPARalpha (or PPARalpha protein levels) in concordance with the shown rise in mRNA for miR-20b?
Thank you for your question. The samples used in Figure 1C–E were also analyzed to observe the changes in the expression of PPARA (Figure 2-figure supplement 4A–C). In each sample, the increase in MIR20B expression resulting from oleic acid (OA) treatment and HFD was accompanied by a reduction in the levels of PPARA mRNA.
- Moreover, Figure 1 shows a fuller landscape of the transcriptional impact of microRNAs in context of obese livers in mice and human. Given this, what made miR20-b more interesting than, for example, miR106a, miR-17, or others that also appear to be robustly regulated? Why focus on miR20b?
This is a very good point. In the analysis of the regulatory network, other miRNAs including MIR129 and MIR106A appeared to possibly regulate nuclear receptors in NAFLD. We further confirmed the relationship between candidate miRNAs and NAFLD progression in patient samples. As shown in the revised Figure 1B, we observed that the expression of MIR20B was more robustly and significantly changed with NAFLD progression than that of MIR129 and MIR106a. This tendency was also confirmed in other experiments using OA- treated HepG2 and Huh7 cells or HFD-fed mice (Figure 1-figure supplement 4). Thus, we focused on the role of MIR20B in NAFLD. Nevertheless, we do not rule out the possibility that other miRNAs may be involved in NAFLD progression. Subsequent studies may uncover the roles of other miRNAs in liver physiology.
- What does the rank and p-value exactly represent in tabular part of Figure 1A? This is very unclear as shown, including the figure legend.
The p-values in the table of Figure 1A were obtained from the hypergeometric distribution used for testing the enrichment of downregulated nuclear receptors among the targets of a miRNA. In other words, they indicate the probability of having downregulated nuclear receptors among the miRNA targets. They were calculated by the following equation:
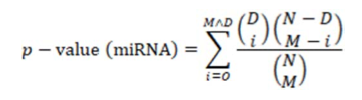
where N is the total number of genes analyzed, M is the number of candidate target genes of the miRNA, D is the downregulated NR genes, and O is the observed overlap between miRNA targets and the downregulated NR genes as described in the Materials and Methods (page 9, line 155-157). The ranks in the table were determined according to the p-value. The legend of Figure 1A has been modified as follows:
“Figure 1. MIR20B expression is significantly increased in the livers of dietary and genetic obese mice and humans. (A) The miRNA regulatory networks for NR genes downregulated in the transcriptome of NAFLD patients. The adjusted p-values in the table represent the enrichment of miRNA targets in the downregulated NR genes (hypergeometric distribution).”
- Figure 1, supplement 1 shows characteristics of patients involved in data for Figure 1, etc. This shows that the normal patients are younger than the other two groups, the M-F ratio is not identical (more female in the normal group), and the total cholesterol levels are not well matched either. What other parameters are available? Hemoglobin A1c? Fasting glucose? In the end, we need to know that the groups, apart from the severity of NAFLD and NASH, were well matched. Given the small size of each group (n = only 4-5, this matching is critical to avoid confounding of the relationship between miR-20b, PPARalpha, and NAFLD/NASH progression.
Thank you for your comment. Accordingly, we have included the patient information in a table (Figure 1-figure supplement 1A, B). To increase the statistical power and prevent confounding effects, we increased the number of samples and tried to match them to compare age, weight, and male/female ratio between the groups. Due to the limited number of patient samples, the cohorts could not be perfectly matched. Nevertheless, there were no significant differences in age and male/female ratio among the three groups. Specifically, serum AST, ALT, and fasting glucose levels were significantly increased with progression from normal to non-alcoholic steatohepatitis (NASH), but total cholesterol was comparable as previously reported (Chung et al., 2020). We have revised the text in page 7-8, line 118- 130.
- The title of Figure 2 relates to PPARalpha. However, in Figure 2G, it is clear that several NRs are downregulated by miR20b overexpression in cells. Although the paper focuses on PPARalpha, should the authors not explore at least some of the other hits to ensure that the impact of PPARalpha is of particular importance vs. others?
This is a good point. We also observed that other nuclear receptors, such as RORA, RORC, and THRB, could be potential targets of MIR20B (Figure 2H and Figure 2-figure supplement 3). However, in the patient data, there was no significant correlation between the expression of those nuclear receptors and that of MIR20B. In addition, among the candidate targets, only PPARA was selected as an overlapped predicted target of MIR20B by various miRNA target prediction programs, including miRDB, picTAR, TargetSCAN, and miRmap (Figure 2J, Figure 2-figure supplement 2). Consistent with these results, we observed that PPARA, not other nuclear receptors is the target gene of MIR20B in both AAV-Mir20b and AAV-anti-Mir20b mice (Figure 5-figure supplement 2, Figure 6-figure supplement 2). Thus, we focused on PPARA as a MIR20B target in NAFLD.
- In Figure 3, the data show, presumably, that OA induces miR20b, which then represses PPARalpha and, in turn, CD36 downstream of PPARalpha. If this is the case, then how does OA continue to get into the cells? Once CD36 expression falls dramatically, doesn't the key OA uptake mechanism fall with it? Then, does the induction of miR20b abate? Or, does FATP6 or another uptake mechanism account for OA entry into these cells?
This is a good point. FA uptake was decreased by overexpression of MIR20B, and was accompanied by a considerable decrease in CD36 expression (Figure 4B, J). However, other lipid transporters such as FATPs were not significantly altered (Figure 4-figure supplement 5), suggesting that FA uptake is continued by these transporters. The expression of CD36 is relatively low in normal hepatocytes, and the molecule may not be the primary fatty acid transporter in these cells (Wilson et al., 2016). Furthermore, the decrease in FA uptake upon CD36 KO is modest even during a HFD (Wilson et al., 2016). In addition, we observed that the expression of MIR20B is induced and increased for up to 24 h by OA treatment. This is followed by a slight decrease, remaining at a constant elevated level (Figure 4-figure supplement 6). Together, the findings indicated that other fatty acid transporters contributing to FA uptake account for the entry of OA into cells. We have added these discussion in page 25, line 571-581.
- Similarly, what happens to AGPAT, GPAT, and DGAT expression in context of OA treatment and modulation of miR20b? Does the capacity of the cell to store OA in the form of triglyceride inside of lipid droplets change, so that the amount of free OA or oleyl-CoA inside the cell rises? Could this impact the transcriptional phenotype?
This is a very good point. Accordingly, we analyzed the transcriptional phenotype in the context of OA treatment and modulation of MIR20B. The expression of glycerolipid synthetic genes, including AGPATs, GPATs, and DGATs, was increased by OA treatment, but MIR20B overexpression did not influence the expression of lipogenic genes except for that of DGAT1. However, treatment with anti-MIR20B significantly reduced the expression of glycerolipid synthetic genes, including GPATs and DGATs, under OA treatment (Figure 4C, N). These results suggested that MIR20B is necessary but not sufficient to induce the expression of glycerolipid synthetic genes under OA treatment. We have shown that OA induces the expression of MIR20B (Figure 1C), which can explain why MIR20B overexpression did not show an additional enhancement under OA treatment. The increase in DGAT1 expression induced by MIR20B might contribute to the increase in TG formation and capacity to store OA. This could change the flux of oleyl-CoA to TG synthesis, not β-oxidation with reduced expression of lipid oxidation-associated genes (Figure 4B). Thus, we can expect that the decrease in OA uptake and increase in TG formation induced by MIR20B resulted in reduced amounts of OA or oleyl-CoA inside the cell. However, as lipid consumption through FA oxidation is decreased by MIR20B, free OA or oleyl-CoA might be maintained at a stably increased level compared to that of OA-untreated MIR NC or MIR20B condition, and the impact of the changes in OA or oleyl-CoA levels on the transcriptional phenotype might not be significant as found in a constant elevated level of MIR20B by OA (Figure 4-figure supplement 6). We have added these results in Figure 4C and the Discussion (page 26, line 595-610). Due to technical constraints, we could not measure the amounts of free OA and oleyl-CoA.
- In Figure 3P, would the impact of anti-miR on the effect of OA on FASN be lost in PPARalpha KO cells? This would really test the functional relevance of the purported transcriptional hierarchy.
Thank you for your valuable comment. We tested the impact of anti-MIR20B treatment on OA-treated PPARA knock-down (KD) cells, not KO cells, due to technical constraints. PPARA KD cells showed a significant decrease in PPARA expression. As shown in Figure 4- figure supplement 4I, anti-MIR20B treatment enhanced the expression of PPARA but did not have a significant effect on fatty acid synthase (FASN) expression in both control and PPARA KD cells. In addition, PPARA KD did not affect FASN expression. The expression patterns of PPARα target genes differ between mice and humans. FASN is regulated by PPARα in mice, but this is unclear in humans (Rakhshandehroo, Hooiveld, Muller, & Kersten, 2009; Rakhshandehroo, Knoch, Muller, & Kersten, 2010). Moreover, fenofibrate, a PPARα agonist, reduces the expression of FASN in methionine choline-deficient (MCD)-fed mice (Cui et al., 2021). Here, we used human HepG2 cells to investigate the effect of OA and MIR20B. It is plausible that FASN might not be regulated by PPARα in our system. We have added these results in Figure 4-figure supplement 4I.
- The authors should really at least perform a bulk RNAseq analysis to confirm the similarity of the effect of miR20b or anti-miR seen in cells, at the mouse or human liver tissue level. As it is, they only look at 3 FAOX genes, 2 FA uptake associated genes, and 2 FA synthesis genes. This is not very comprehensive as a validation of the in vitro data, although it is intriguing. Or, at the very least, look at a large validated set of PPARalpha target genes in vivo.
Thank you for your comment. Accordingly, we selected PPARα target genes altered by MIR20B in OA-treated cells (Figure 4-figure supplement 1A, B), and then examined the hepatic expression of PPARα target genes in HFD-fed mice treated with MIR20B or anti- MIR20B (Figure 5R and 6R). The expression of most PPARα target genes was decreased by OA treatment and the HFD, and MIR20B treatment further reduced their expression. In contrast, anti-MIR20B treatment rescued the reduced expression of PPARα target genes under OA treatment and the HFD. These results suggested that MIR20B suppresses PPARA in vivo, which is consistent with the results from cells. We have added these results in Figure 4-figure supplement 1A, B, Figure 5R, and Figure 6R.
- Notably, the figures in general do NOT show individual data points. This is the standard for visual display, rather than bar graphs with simple SEM bars.
Thank you for your comment. We have revised the graphs to include individual data points.
- The in vivo data (e.g. Figure 4) are very low n values. Augmenting this would add confidence to the data. As an example, of inconsistencies potentially stemming from very low n, the liver weights (Figure 4F) are not very different across groups, although the triglyceride levels in the livers (Figure 4H) are more than twice as high. The images of liver specimens shown as examples (Figure 4F) are also more dramatic than the weights would indicate. Note also that the body weights of the mice (Figure 4C) are different as well, and this alone could explain the livers being modestly heavier. Indeed, the extent of body weight excess mirrors the extent of liver weight excess, suggesting that the entire animal may be larger across multiple metabolic tissues including adipose. This is proven in Figure 4D, where the fat mass looks to be larger as well. To this end, Figure 4 supplement 2 shows multiple tissue weights to be increased in this model, suggesting that specificity for hepatic steatosis may be low.
Thank you for your comment. Accordingly, we conducted additional in vivo experiments with larger n values (n = 10). Then, we replaced the liver images with more representative ones. AAV-Mir20b robustly induced the hepatic expression of Mir20b and significantly increased the liver weight and hepatic TG levels (Figure 5F, 5I). In the liver of normal human, intrahepatic TGs do not exceed 5 % of the liver weight (Fabbrini & Magkos, 2015). In our results, TG levels were increased more than three times by the HFD, but the impact on liver weight was limited, as TGs did not account for more than 10 % of the liver weight (Figure 5I). Excess hepatic TGs are secreted as very low density lipoproteins (VLDLs), and the secretion rate increases with the TG level (Fabbrini et al., 2008). VLDLs deliver TGs from the liver to adipose tissue and other metabolic tissues (Heeren & Scheja, 2021). The excess hepatic TGs induced by MiR20b were presumably transferred to epididymal adipose tissue, contributing to the increase in adipose tissue weight, while inguinal and brown adipose tissues were not significantly affected by MiR20b (Figure 5-figure supplement 3). Together, the fat mass measured by EchoMRI included intrahepatic and adipose TGs, and mirrored the increases shown in Figure 5D. In addition, MiR20b induced the expression of hepatic DGAT1, which could explain increased TG secretion through VLDLs (Figure 4C) (Alves- Bezerra & Cohen, 2017; Liang et al., 2004).
Conversely, the supply of FFAs from adipose tissue might have contributed to hepatic steatosis. However, we observed that there were no significant changes in the expression of Mir20b and lipolytic genes in adipose tissue (Figure 5-figure supplement 4A). Furthermore, the serum FFA levels in the AAV-Control and AAV-Mir20b groups under the HFD were comparable (Figure 5-figure supplement 4B). These findings suggested that increased intrahepatic TG levels constituted the specific and primary effect of AAV-Mir20b.
- In figure 5 S1, the anti-miR20b substantially reduces the weights of multiple tissues in mice fed a HFD, given this, why does overall body weight (figure 5c) show such a modest difference. Figure 5 E and F also suggest that the overall weights would have been lower than shown in Figure 5C. In the end, instead of bar graphs of the final weights, the entire weight curve for the mice fed the HFD should have been shown.
Thank you for your comment. To make our results more robust, we increased the sample size (n = 10). Moreover, we provided the entire weight curve and revised the results (Figure 6C). AAV-anti-Mir20b treatment significantly reduced the liver weight (Figure 6F). The weight of adipose tissue, including epididymal white adipose tissue (EpiWAT), tended to decrease; however, the difference was not significant (Figure 6-figure supplement 3). As indicated in a previous question (#11), the change in hepatic TG levels could affect the weight of other tissues. In our revised Figure 6C, we show that the overall weight change might be higher than the sum of weight change of specific metabolic tissues, such as the liver and adipose tissues.
- How well were the NAFLD vs. normal GSE individuals matched? This is very important, since PPARalpha emerges from comparing these data sets. Matching is very important to make sure that the differences in NR expression does not stem from a confound that went along win parallel with the NAFLD cohort vs. the normal GSE cohort.
This is a very good point. PPARA emerged from regulatory network analysis (Figure 1A) and was selected as target of MIR20B through the analysis of RNA-seq data from MIR20B- overexpressing HepG2 cells (Figure 2). By constructing a regulatory network in NAFLD patients, we determined that MIR20B is responsible for NR regulation in NAFLD. As shown in Figure 1A, we analyzed the differential expression of NR in NAFLD using public GSE data (GSE130970) consisting of patients with NAFLD and age- and weight-matched normal controls (Hoang et al., 2019). To verify the expression of MIR20B, we assessed the miRNA levels in another non-coding RNA GSE dataset (GSE40744) in the original manuscript (previous Figure 1B). However, in the process of reviewing GSE40744 patients’ information with physicians, we found that some of the patients were virus-infected. Thus, we removed the data from GSE40744 and truly apologize for the confusion.
In the revised manuscript (page 16 line 303-304), we examined the expression of MIR20B and other candidate miRNAs such as MIR129 and MIR219A in patient samples from the Asan Medical Center (Seoul, Republic of Korea), who were diagnosed by pathologists and age- and weight-matched. As shown in Figure 1B, MIR20B is one of the main miRNAs involved in NAFLD progression. In addition, the expression of PPARA was significantly negatively correlated with that of MIR20B (Figure 2-figure supplement 3).
Reviewer #3:
In this manuscript, Le et al. use an elegant combination of cultured cells, patient samples, and mouse models to show that miR-20b promotes non-alcoholic fatty liver disease (NAFLD) by suppressing PPAR-alpha. The authors show that miR-20b inhibits PPAR-gamma expression, resulting in reduced fatty acid oxidation, decreased mitochondrial biogenesis, and increased hepatocyte lipid accumulation both in vitro and in vivo. Inhibition of miR-20b in mouse NAFLD models leads to increased PPAR-gamma, reduced hepatic lipid accumulation, decreased inflammation, and improved glucose tolerance. Overall, the data are well-controlled and support the authors' conclusions.
Strengths:
- In Figure 1, the authors show miR-20b is increased in NAFLD patients, mouse obesity/NAFLD models, and cultured liver cancer cells treated with oleic acid (OA). The use of multiple complementary approaches is very powerful, although more information regarding the diagnoses in the 13 patient samples would be helpful (see below).
Thank you for your comment. Accordingly, we have included the patient information in a table (Figure 1-figure supplement 1A, B). To increase the statistical power and prevent confounding effects, we increased the number of samples and tried to match them to compare age, weight, and male/female ratio between the groups. Due to the limited number of patient samples, the cohorts could not be perfectly matched. Nevertheless, there were no significant differences in age and male/female ratio among the three groups. Specifically, serum AST, ALT, and fasting glucose levels were significantly increased with progression from normal to non-alcoholic steatohepatitis (NASH), but total cholesterol was comparable as previously reported (Chung et al., 2020). We have revised the text in page 7-8, line 118- 130.
- In Figure 2, the authors show that PPAR-alpha is a direct target of miR-20b. These data include a luciferase reporter assay regulated by the 3'UTR of PPAR-alpha. Importantly, when the 3'UTR is mutated, suppression of luciferase expression by miR-20b is no longer observed. The authors use multiple different algorithms to predict miR-20b targets, look for overlap, and then confirm PPAR-alpha as the most important "hit" in vitro.
- Figure 3 highlights changes in fatty acid metabolism in HepG2 cells transfected with miR-20b, miR-NC, or anti-miR-20b and treated with oleic acid. Figure 3, supplement 4 shows that anti-miR-20b can alleviate OA-induced hepatic steatosis in both HepG2 cells and primary hepatocytes. The use of another (primary) cell line here is important, because HepG2 is a liver cancer cell line, and metabolic changes in HepG2 cells might not be representative of non-neoplastic hepatocytes.
- In Figure 4, the authors show that miR-20b promotes hepatic steatosis, increases liver weight, increases liver injury markers, and impairs glucose tolerance and insulin sensitivity in HFD-fed mice. Conversely, anti-miR-20b inhibits hepatic steatosis, decreases liver weight and liver injury markers, and improves glucose tolerance and insulin sensitivity in HFD-fed mice (Figure 5). Anti-miR-20b also inhibits hepatic steatosis and fibrosis and decreases liver injury markers in MCD-fed mice (Figure 8). These in vivo studies provide excellent support for the authors' hypothesis regarding the role of miR-20b in promoting fatty liver disease. The liver readily takes up small nucleic acids, including miRs and anti-miRs. Thus, the possibility of using anti-miR-20b as a therapeutic for fatty liver disease is intriguing, and supported by these experiments.
- In Figure 6, in HepG2 cells, the authors demonstrate that PPAR-alpha overexpression (or to a lesser extent fenofibrate treatment) is able to rescue the transcriptional effects of miR-20b overexpression. Conversely, siPPAR-alpha can rescue the transcriptional effects of anti-miR-20b. Similar results are shown in Figure 7-fenofibrate is able to at least partially suppress some of the metabolic phenotypes that are exacerbated by miR-20b overexpression in HFD-fed mice (the decreased lean/BW ratio, elevated fasting glucose, some transcriptional changes). Again, it is nice to see that the in vitro data is supported by in vivo results.
Thank you for your comments.
Weaknesses:
- In Figure 3, figure supplement 2, it seems the effects of miR-20b overexpression in primary hepatocytes may be a bit overstated. While it does seem that miR-20b enhances the accumulation of fat in primary hepatocytes upon OA treatment, miR-20b overexpression alone does not seem to have significant effects on steatosis (A), cholesterol (B), or triglycerides (C).
Thank you for your comment. We have revised the text; “Unlike in HepG2 cells (Figure 2A-C), MIR20B alone did not induce lipid accumulation in primary hepatocytes without OA treatment, but MIR20B significantly increased lipid accumulation in the presence of OA (Figure 4-figure supplement 2)” (page 19, line 383-385). “Figure 4-figure supplement 2. MIR20B enhances lipid accumulation in primary hepatocytes under OA-treatment” (the title of Figure 4-figure supplement 2)
- Histologic analysis of mouse liver samples by a pathologist is lacking. In Figure 4, is there increased inflammation and/or fibrosis with miR-20b overexpression, or just increased steatosis? In Figure 4 and Figure 8, it would be helpful if steatosis, fibrosis, and inflammation were quantified/scored histologically.
Thank you for your comment. Accordingly, we have conducted histological analysis and measured the NAFLD activity score (NAS) and fibrosis score by a pathologist. We have added the scoring graphs in Figure 5H, 6H, 7H, 8I, 8J, 9G, and 9H. In Figure 5G and 5H, AAV-Mir20b significantly increased steatosis but the increase of inflammation was not significant under the HFD; However, AAV-anti-Mir20b significantly decreased steatosis and inflammation, fibrosis under the MCD (Figure 8H-J). In addition, the combination of AAV-anti- Mir20b with fenofibrate significantly alleviated steatosis, inflammation, and fibrosis compared to AAV-Control under the MCD (Figure 9F-H).
- The effects of anti-miR-20b on hepatic triglycerides and inflammatory markers in vivo are modest (Figures 5 and 8). Perhaps an enhancement could be seen by combining anti-miR-20b with fenofibrate. While the authors show that fenofibrate's effects are suppressed with miR-20b overexpression, they don't examine what happens when fenofibrate is combined with anti-miR-20b. To me, this experiment is critical to determine if PPAR-alpha activity could be further maximized to combat NAFLD (beyond what is seen with fenofibrate alone).
This is a very good point. Accordingly, we performed a new experiment in which fenofibrate was combined with anti-Mir20b to treat MCD-fed mice. The combination showed further improvements compared with those obtained by fenofibrate treatment alone. The results have been described in page 23-24, line 518-536.
“Recently, drug development strategies for NAFLD/NASH are moving toward combination therapies (Dufour, Caussy, & Loomba, 2020). However, the efficacy of developing drugs, including fenofibrate, against NAFLD/NASH is limited (Fernandez-Miranda et al., 2008). Thus, we tested whether the combination of anti-Mir20b and fenofibrate would improve NAFLD in MCD-fed mice. The levels of hepatic Mir20b were reduced after administration of AAV-anti-Mir20b in MCD-fed mice compared to those in mice administered with AAV-Control, and this reduction was also observed after fenofibrate treatment (Figure 9A). Interestingly, the combination of AAV-anti-Mir20b and fenofibrate increased the levels of PPARα to a greater extent than AAV-Mir20b alone (Figure 9B, C). AAV-anti-Mir20b or fenofibrate administration significantly reduced the liver weight and hepatic TG levels, and co- administration further reduced hepatic steatosis (Figure 9D, E). Histological sections showed that the combination of AAV-anti-Mir20b and fenofibrate improved NAFLD, as evidenced by the effects on both lipid accumulation and fibrosis in the liver (Figure 9F-H). Consistently, the levels of AST and ALT were significantly lower after combined treatment with AAV-anti- Mir20b and fenofibrate than after a single treatment (Figure 9I, J). In addition, the expression of genes related to hepatic inflammation, such as Tnf and Il6 (Figure 9K), and fibrosis, such as Acta2, Col1a1, Fn, and Timp1, (Figure 9L), was further decreased by the combination of AAV-anti-Mir20b and fenofibrate. These results suggest that AAV-anti-Mir20b may increase the efficacy of fenofibrate, especially its effect on fibrosis, and provide a more effective option for improving NAFLD/NASH."
-
Evaluation Summary:
The manuscript by Lee et al. provides mechanistic insight into the regulatory role of micro RNAs in modulating nuclear receptor expression and function. This is likely to have a high impact on the field as nuclear receptor regulation of metabolic disease is well established, however, the molecular mechanisms governing this process still remains unknown largely. Lee et al.'s manuscript provides a molecular target (miR-20b) that holds therapeutic potential in improving hepatic steatosis.
(This preprint has been reviewed by eLife. We include the public reviews from the reviewers here; the authors also receive private feedback with suggested changes to the manuscript. Reviewer #2 agreed to share their name with the authors.)
-
Reviewer #1 (Public Review):
Lee et al. identify miR-20b as a molecular regulator of hepatic lipid metabolism through the post-transcriptional regulation of the nuclear receptor PPAR alpha. Through mechanistic studies the authors identified the 3'UTR of PPARa as a direct target for miR-20b regulation of expression. The experiments are well controlled and the study provides deep mechanistic insight into the miR-20b/PPARa circuit in modulating hepatic lipid metabolism. Furthermore, the authors provide evidence that targeting the miR-20b pathway to enhance PPARa activation via synthetic ligand fenofibrate. The studies provide much needed mechanistic insight into molecular regulators of hepatic lipid metabolism in response to nutrient stress such as high fat diet. While this is a detailed and thorough assessment of this pathway, there are …
Reviewer #1 (Public Review):
Lee et al. identify miR-20b as a molecular regulator of hepatic lipid metabolism through the post-transcriptional regulation of the nuclear receptor PPAR alpha. Through mechanistic studies the authors identified the 3'UTR of PPARa as a direct target for miR-20b regulation of expression. The experiments are well controlled and the study provides deep mechanistic insight into the miR-20b/PPARa circuit in modulating hepatic lipid metabolism. Furthermore, the authors provide evidence that targeting the miR-20b pathway to enhance PPARa activation via synthetic ligand fenofibrate. The studies provide much needed mechanistic insight into molecular regulators of hepatic lipid metabolism in response to nutrient stress such as high fat diet. While this is a detailed and thorough assessment of this pathway, there are several issues that were identified in the review of this article outlined below:
The authors state there is no off target expression of miR-20b in adipose tissue in their over expression experiments. However, per figure 4 supplement 1, EpiWAT has increased expression over controls in HFD fed conditions. Furthermore, figure 4 supplement 2 shows a functional difference in EpiWAT weight in HFD where miR-20b treated mice have higher fat weight. The authors need at the least to discuss the potential role of adipose tissue in promoting their observed phenotype.
Figure 5 shows anti-miR-20b essentially restores PPARa expression. However, the rescue effects in terms of body weight, liver triglycerides and liver damage are only modestly improved. The authors need to discuss this modest effect and potentially offer alternative mechanisms aside from PPARa as the physiological target.
The authors performed experiments with mutated 3'UTR of PPARa and show mutated PPARa is refractory to regulation by miR-20b. However, the authors provide no functional evidence that mutating the 3'UTR of PPARa elicits changes in hepatic lipid metabolism. Discussion of this point is needed at the minimal.
-
Reviewer #2 (Public Review):
In the experiments depicted in Figures 1D and E, did OA treatment of HepG2 and/or Huh-7 cells produce a reduction in the levels of mRNA encoding PPARalpha (or PPARalpha protein levels) in concordance with the shown rise in mRNA for miR-20b?
Moreover, Figure 1 shows a fuller landscape of the transcriptional impact of microRNAs in context of obese livers in mice and human. Given this, what made miR20-b more interesting than, for example, miR106a, miR-17, or others that also appear to be robustly regulated? Why focus on miR20b?
What does the rank and p-value exactly represent in tabular part of Figure 1A? This is very unclear as shown, including the figure legend.
Figure 1, supplement 1 shows characteristics of patients involved in data for Figure 1, etc. This shows that the normal patients are younger than the …
Reviewer #2 (Public Review):
In the experiments depicted in Figures 1D and E, did OA treatment of HepG2 and/or Huh-7 cells produce a reduction in the levels of mRNA encoding PPARalpha (or PPARalpha protein levels) in concordance with the shown rise in mRNA for miR-20b?
Moreover, Figure 1 shows a fuller landscape of the transcriptional impact of microRNAs in context of obese livers in mice and human. Given this, what made miR20-b more interesting than, for example, miR106a, miR-17, or others that also appear to be robustly regulated? Why focus on miR20b?
What does the rank and p-value exactly represent in tabular part of Figure 1A? This is very unclear as shown, including the figure legend.
Figure 1, supplement 1 shows characteristics of patients involved in data for Figure 1, etc. This shows that the normal patients are younger than the other two groups, the M-F ratio is not identical (more female in the normal group), and the total cholesterol levels are not well matched either. What other parameters are available? Hemoglobin A1c? Fasting glucose? In the end, we need to know that the groups, apart from the severity of NAFLD and NASH, were well matched. Given the small size of each group (n = only 4-5, this matching is critical to avoid confounding of the relationship between miR-20b, PPARalpha, and NAFLD/NASH progression.
The title of Figure 2 relates to PPARalpha. However, in Figure 2G, it is clear that several NRs are downregulated by miR20b overexpression in cells. Although the paper focuses on PPARalpha, should the authors not explore at least some of the other hits to ensure that the impact of PPARalpha is of particular importance vs. others?
In Figure 3, the data show, presumably, that OA induces miR20b, which then represses PPARalpha and, in turn, CD36 downstream of PPARalpha. If this is the case, then how does OA continue to get into the cells? Once CD36 expression falls dramatically, doesn't the key OA uptake mechanism fall with it? Then, does the induction of miR20b abate? Or, does FATP6 or another uptake mechanism account for OA entry into these cells?
Similarly, what happens to AGPAT, GPAT, and DGAT expression in context of OA treatment and modulation of miR20b? Does the capacity of the cell to store OA in the form of triglyceride inside of lipid droplets change, so that the amount of free OA or oleyl-CoA inside the cell rises? Could this impact the transcriptional phenotype?
In Figure 3P, would the impact of anti-miR on the effect of OA on FASN be lost in PPARalpha KO cells? This would really test the functional relevance of the purported transcriptional hierarchy.
The authors should really at least perform a bulk RNAseq analysis to confirm the similarity of the effect of miR20b or anti-miR seen in cells, at the mouse or human liver tissue level. As it is, they only look at 3 FAOX genes, 2 FA uptake associated genes, and 2 FA synthesis genes. This is not very comprehensive as a validation of the in vitro data, although it is intriguing. Or, at the very least, look at a large validated set of PPARalpha target genes in vivo.
Notably, the figures in general do NOT show individual data points. This is the standard for visual display, rather than bar graphs with simple SEM bars.
The in vivo data (e.g. Figure 4) are very low n values. Augmenting this would add confidence to the data. As an example, of inconsistencies potentially stemming from very low n, the liver weights (Figure 4F) are not very different across groups, although the triglyceride levels in the livers (Figure 4H) are more than twice as high. The images of liver specimens shown as examples (Figure 4F) are also more dramatic than the weights would indicate. Note also that the body weights of the mice (Figure 4C) are different as well, and this alone could explain the livers being modestly heavier. Indeed, the extent of body weight excess mirrors the extent of liver weight excess, suggesting that the entire animal may be larger across multiple metabolic tissues including adipose. This is proven in Figure 4D, where the fat mass looks to be larger as well. To this end, Figure 4 supplement 2 shows multiple tissue weights to be increased in this model, suggesting that specificity for hepatic steatosis may be low.
In figure 5 S1, the anti-miR20b substantially reduces the weights of multiple tissues in mice fed a HFD, given this, why does overall body weight (figure 5c) show such a modest difference. Figure 5 E and F also suggest that the overall weights would have been lower than shown in Figure 5C. In the end, instead of bar graphs of the final weights, the entire weight curve for the mice fed the HFD should have been shown.
How well were the NAFLD vs. normal GSE individuals matched? This is very important, since PPARalpha emerges from comparing these data sets. Matching is very important to make sure that the differences in NR expression does not stem from a confound that went along win parallel with the NAFLD cohort vs. the normal GSE cohort.
-
Reviewer #3 (Public Review):
In this manuscript, Le et al. use an elegant combination of cultured cells, patient samples, and mouse models to show that miR-20b promotes non-alcoholic fatty liver disease (NAFLD) by suppressing PPAR-alpha. The authors show that miR-20b inhibits PPAR-gamma expression, resulting in reduced fatty acid oxidation, decreased mitochondrial biogenesis, and increased hepatocyte lipid accumulation both in vitro and in vivo. Inhibition of miR-20b in mouse NAFLD models leads to increased PPAR-gamma, reduced hepatic lipid accumulation, decreased inflammation, and improved glucose tolerance. Overall, the data are well-controlled and support the authors' conclusions.
Strengths:
In Figure 1, the authors show miR-20b is increased in NAFLD patients, mouse obesity/NAFLD models, and cultured liver cancer cells treated with …
Reviewer #3 (Public Review):
In this manuscript, Le et al. use an elegant combination of cultured cells, patient samples, and mouse models to show that miR-20b promotes non-alcoholic fatty liver disease (NAFLD) by suppressing PPAR-alpha. The authors show that miR-20b inhibits PPAR-gamma expression, resulting in reduced fatty acid oxidation, decreased mitochondrial biogenesis, and increased hepatocyte lipid accumulation both in vitro and in vivo. Inhibition of miR-20b in mouse NAFLD models leads to increased PPAR-gamma, reduced hepatic lipid accumulation, decreased inflammation, and improved glucose tolerance. Overall, the data are well-controlled and support the authors' conclusions.
Strengths:
In Figure 1, the authors show miR-20b is increased in NAFLD patients, mouse obesity/NAFLD models, and cultured liver cancer cells treated with oleic acid (OA). The use of multiple complementary approaches is very powerful, although more information regarding the diagnoses in the 13 patient samples would be helpful (see below).
In Figure 2, the authors show that PPAR-alpha is a direct target of miR-20b. These data include a luciferase reporter assay regulated by the 3'UTR of PPAR-alpha. Importantly, when the 3'UTR is mutated, suppression of luciferase expression by miR-20b is no longer observed. The authors use multiple different algorithms to predict miR-20b targets, look for overlap, and then confirm PPAR-alpha as the most important "hit" in vitro.
Figure 3 highlights changes in fatty acid metabolism in HepG2 cells transfected with miR-20b, miR-NC, or anti-miR-20b and treated with oleic acid. Figure 3, supplement 4 shows that anti-miR-20b can alleviate OA-induced hepatic steatosis in both HepG2 cells and primary hepatocytes. The use of another (primary) cell line here is important, because HepG2 is a liver cancer cell line, and metabolic changes in HepG2 cells might not be representative of non-neoplastic hepatocytes.
In Figure 4, the authors show that miR-20b promotes hepatic steatosis, increases liver weight, increases liver injury markers, and impairs glucose tolerance and insulin sensitivity in HFD-fed mice. Conversely, anti-miR-20b inhibits hepatic steatosis, decreases liver weight and liver injury markers, and improves glucose tolerance and insulin sensitivity in HFD-fed mice (Figure 5). Anti-miR-20b also inhibits hepatic steatosis and fibrosis and decreases liver injury markers in MCD-fed mice (Figure 8). These in vivo studies provide excellent support for the authors' hypothesis regarding the role of miR-20b in promoting fatty liver disease. The liver readily takes up small nucleic acids, including miRs and anti-miRs. Thus, the possibility of using anti-miR-20b as a therapeutic for fatty liver disease is intriguing, and supported by these experiments.
In Figure 6, in HepG2 cells, the authors demonstrate that PPAR-alpha overexpression (or to a lesser extent fenofibrate treatment) is able to rescue the transcriptional effects of miR-20b overexpression. Conversely, siPPAR-alpha can rescue the transcriptional effects of anti-miR-20b. Similar results are shown in Figure 7-fenofibrate is able to at least partially suppress some of the metabolic phenotypes that are exacerbated by miR-20b overexpression in HFD-fed mice (the decreased lean/BW ratio, elevated fasting glucose, some transcriptional changes). Again, it is nice to see that the in vitro data is supported by in vivo results.
Weaknesses:
In Figure 3, figure supplement 2, it seems the effects of miR-20b overexpression in primary hepatocytes may be a bit overstated. While it does seem that miR-20b enhances the accumulation of fat in primary hepatocytes upon OA treatment, miR-20b overexpression alone does not seem to have significant effects on steatosis (A), cholesterol (B), or triglycerides (C).
Histologic analysis of mouse liver samples by a pathologist is lacking. In Figure 4, is there increased inflammation and/or fibrosis with miR-20b overexpression, or just increased steatosis? In Figure 4 and Figure 8, it would be helpful if steatosis, fibrosis, and inflammation were quantified/scored histologically.
The effects of anti-miR-20b on hepatic triglycerides and inflammatory markers in vivo are modest (Figures 5 and 8). Perhaps an enhancement could be seen by combining anti-miR-20b with fenofibrate. While the authors show that fenofibrate's effects are suppressed with miR-20b overexpression, they don't examine what happens when fenofibrate is combined with anti-miR-20b. To me, this experiment is critical to determine if PPAR-alpha activity could be further maximized to combat NAFLD (beyond what is seen with fenofibrate alone).
-
