Intracerebral mechanisms explaining the impact of incidental feedback on mood state and risky choice
Curation statements for this article:-
Curated by eLife

Evaluation Summary:
This study uses intracranial EEG to explore links between broad-band gamma oscillations and mood, and their impact on decisions. While the results are potentially interesting, additional details and analyses are necessary to show that results are not driven by confounds. In addition, there is about a major concern that statistics are performed across electrodes instead of across subjects.
(This preprint has been reviewed by eLife. We include the public reviews from the reviewers here; the authors also receive private feedback with suggested changes to the manuscript. The reviewers remained anonymous to the authors.)
This article has been Reviewed by the following groups
Discuss this preprint
Start a discussion What are Sciety discussions?Listed in
- Evaluated articles (eLife)
Abstract
Identifying factors whose fluctuations are associated with choice inconsistency is a major issue for rational decision theory. Here, we investigated the neuro-computational mechanisms through which mood fluctuations may bias human choice behavior. Intracerebral EEG data were collected in a large group of subjects (n=30) while they were performing interleaved quiz and choice tasks that were designed to examine how a series of unrelated feedbacks affect decisions between safe and risky options. Neural baseline activity preceding choice onset was confronted first to mood level, estimated by a computational model integrating the feedbacks received in the quiz task, and then to the weighting of option attributes, in a computational model predicting risk attitude in the choice task. Results showed that (1) elevated broadband gamma activity (BGA) in the ventromedial prefrontal cortex (vmPFC) and dorsal anterior insula (daIns) was respectively signaling periods of high and low mood, (2) increased vmPFC and daIns BGA respectively promoted and tempered risk taking by overweighting gain vs. loss prospects. Thus, incidental feedbacks induce brain states that correspond to different moods and bias the evaluation of risky options. More generally, these findings might explain why people experiencing positive (or negative) outcome in some part of their life tend to expect success (or failure) in any other.
Article activity feed
-

-

Author Response
Reviewer #1 (Public Review)
The documented findings may be explained by the artifact of task design and the way the signals were calculated: The vmPFC was the only ROI for which a positive correlation was found between BGA and mood rating and TML. Instead, most other regions showed negative correlation (inlc da-Insula, dorsolateral prefrontal cortex, the visual cortex, the motor cortex, the dorsomedial premotor cortex, the ventral somatosensory cortex, and the ventral inferior parietal lobule). This can be purely an artifact of task itself: In 25% of mood rating trials, subjects were presented with a question. They had to move the cursor from left (very bad) to the right (very good) along a continuous visual analog scale (100 steps) with left and right-hand response buttons. They even got a warning if they were slow. …
Author Response
Reviewer #1 (Public Review)
The documented findings may be explained by the artifact of task design and the way the signals were calculated: The vmPFC was the only ROI for which a positive correlation was found between BGA and mood rating and TML. Instead, most other regions showed negative correlation (inlc da-Insula, dorsolateral prefrontal cortex, the visual cortex, the motor cortex, the dorsomedial premotor cortex, the ventral somatosensory cortex, and the ventral inferior parietal lobule). This can be purely an artifact of task itself: In 25% of mood rating trials, subjects were presented with a question. They had to move the cursor from left (very bad) to the right (very good) along a continuous visual analog scale (100 steps) with left and right-hand response buttons. They even got a warning if they were slow. In 75% of trials, subjects saw none of this and the screen was just blank and the subjects rested.”
- First of all, it is unclear if the 25% and 75% trials were mixed. I am assuming that they were not mixed as that could represent a fundamental mistake. The manuscript gives me the impression that this was not done (please clarify).
If by 25% and 75% trials the Reviewer means rating and no-rating trials then yes, they were intermixed (following on Vinckier et al. 2018). As explained in the initial manuscript, mood was rated every 3-7 trials (for a total of 25% of trials), and we used a computational model to interpolate mood (i.e., theoretical mood level) for the trials in between. This was implemented to avoid sampling mood systematically after every feedback and to test whether vmPFC and daIns represents mood continuously or just when it must be rated. We do not see how this could represent a fundamental mistake. Note that the associations between BGA and mood hold whether we use only rating trials, or only no-rating trials, or both types of trials.
To better explain how ratings and feedbacks were distributed across trials, we have added a supplementary figure that shows a representative example (Figure S1). This plot shows that ratings were collected independently of whether subjects were in high- or low-mood episodes. In other words, the alternance between rating and no-rating trials was orthogonal to the alternance between low- and high-mood episodes.
- Assuming that they were not mixed and we are seeing the data from 75% of trials only. These trials would trigger increased BGA activity in the default mode areas such as the vmPFC, and opposite patterns in the salience, visual and motor areas. Hence the opposite correlations. The authors should just plot BGA activity across regions during rest trials and see if this was the case. That would provide a whole different interpretation.
Even if there were opposite correlations induced by the alternance between rating and no-rating trials, they would be orthogonal to mood fluctuations induced by positive and negative feedbacks. There is no way these putative opposite correlations could confound the correlation between BGA and mood, when restricted for instance to rating trials only. Anyway, what data show is not an opposite correlation between vmPFC and daIns (see figure R1 below) but that these two regions, when included as competing regressors in a same model, are both significant predictors of mood level. This could not be the case if vmPFC and daIns activities were just mirror reflections of a same factor (alternance of rating and no-rating trials).
We agree on the argument that performing a task may activate (increase BGA in) the daIns and deactivate (decrease BGA in) the vmPFC, but this average level of activity is not relevant for our study, which explores trial-to-trial fluctuations. It would only be problematic if the alternance between rating and no-rating trials was 1) correlated to mood levels and 2) inducing (anti)correlations between vmPFC and daIns BGA. The first assumption is false by construction of the design, as explained above, and the second assumption is empirically false, as shown below by the absence of correlation between daIns and vmPFC BGA. For each trial, we averaged BGA during the pre-stimulus time window (-4 to 0s) and tested the correlation between all possible pairs of vmPFC and daIns recording sites implanted in a same subject (n = 247 pairs of recording sites from 18 subjects). We observed no reliable correlation between the two brain regions, whether including only rest (no-rating) trials, only rating trials, or all trials together (see figure R1 below). On the contrary, the positive correlation between mood and vmPFC, as well as the negative correlation between mood and daIns, was observed in all cases (whether considering rest, rating, or all trials together).
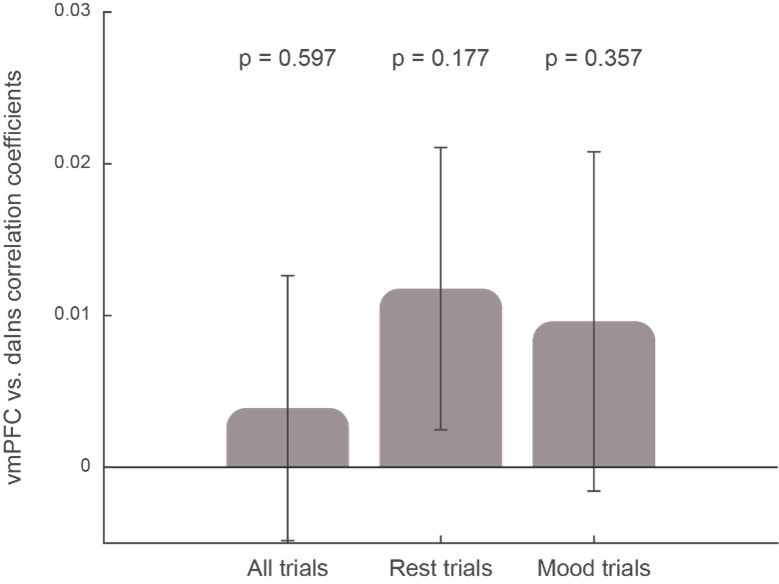
Figure R1: Correlation between vmPFC and daIns activities. Bars show the correlation coefficients, averaged across pairs of recording sites, obtained when including all trials, only rest trials (no rating), or only mood-rating trials. The p-values were obtained using a two-sided, one-sample Student’s t-test on Fisher-transformed correlation coefficients. Note that performing the same analysis across subjects (instead of recording sites) yields the same result.
- In addition, it is entirely unclear how the BGA in a given electrode was plotted. How is BGA normalized for each electrode? What is baseline here? Without understanding what baseline was used for this normalization, it is hard to follow the next section about the impact of the intracerebral activity on decision-making.
The normalization we used is neutral to the effect of interest. Details of BGA computation are given in the Methods section (lines 746-751):
“For each frequency band, this envelope signal (i.e., time varying amplitude) was divided by its mean across the entire recording session and multiplied by 100. This yields instantaneous envelope values expressed in percentage (%) of the mean. Finally, the envelope signals computed for each consecutive frequency band were averaged together to provide a single time series (the broadband gamma envelope) across the entire session. By construction, the mean value of that time series across the recording session is equal to 100.”
Then, BGA was simply z-scored over trials for every recording site. Thus, there was no baseline correction in the sense that there was no subtraction of pre-stimulus activity. We agree this would have been problematic, since we were precisely interested in the information carried by pre-stimulus activity. By z-scoring, we took as reference the mean activity over all trials.
We added the following sentence in the Methods section (lines 755-756):
“BGA was normalized for each recording site by z-scoring across trials.”
- line 237: how was the correction for multiple comparisons done? Subject by subject, ROI by ROI, electrode by electrode? Please clarify.
The correction for multiple comparisons was done using a classic cluster-based permutation test (Maris & Ostenweld, 2007, J. Neurosci. Methods) performed at the level of ROI.
We have updated the section detailing this method in the manuscript (lines 807-818), as follows:
“For each ROI, a t-value was computed across all recording sites of the given ROI for each time point of the baseline window (-4 to 0 s before choice onset), independently of subject identity, using two-sided, one-sample, Student’s t-tests. For all GLMs, the statistical significance of each ROI was assessed through permutation tests. First, the pairing between responses and predictors across trials was shuffled randomly 300 times for each recording site. Second, we performed 60,000 random combinations of all contacts in a ROI, drawn from the 300 shuffles calculated previously for each site. The maximal cluster-level statistics (the maximal sum of t-values over contiguous time points exceeding a significance threshold of 0.05) were extracted for each combination to compute a “null” distribution of effect size across a time window from -4 to 0 s before choice onset (the baseline corresponding to the rest or mood assessment period). The p-value of each cluster in the original (non-shuffled) data was finally obtained by computing the proportion of clusters with higher statistics in the null distribution, and reported as the “cluster-level corrected” p-value (pcorr).”
Reviewer #2 (Public Review)
“This study used intracranial EEG to explore links between broad-band gamma oscillations and mood, and their impact on decisions. The topic is interesting and important. A major strength is the use of intracranial EEG (iEEG) techniques, which allowed the authors to obtain electrical signals directly from deep brain areas involved in decision making. With its precise temporal resolution, iEEG allowed the authors to study activity in specific frequency bands. While the results are potentially interesting, one major concern with the analysis procedure-specifically grouping of all data across all subjects and performing statistics across electrodes instead of across subjects-reduces enthusiasm for these findings. There is also a question about how mood impacts attentional state, which has already been shown to impact baseline (pre-stimulus) broad band gamma.”
Major comments
1)The number of subjects with contacts in vmPFC, daIns, and both vmPFC and daIns should be stated in the manuscript so the reader doesn't have to refer to the supplementary table to find this information.
These details have been added to the Results section (lines 236-242 and 258-262), as follows:
“The vmPFC (n = 91 sites from 20 subjects) was the only ROI for which we found a positive correlation (Figure 2b; Source data 1; Table S2) between BGA and both mood rating (best cluster: -1.37 to -1.04 s, sum(t(90)) = 122.3, pcorr = 0.010) and TML (best cluster: -0.57 to -0.13 s, sum(t(90)) = 132.4, pcorr = 8.10-3). Conversely, we found a negative correlation in a larger brain network encompassing the daIns (n = 86 sites from 28 subjects, Figure 2b; Source data 1; Table S2), in which BGA was negatively associated with both mood rating (best cluster: -3.36 to -2.51 s, sum(t(85)) = -325.8, pcorr < 1.7.10-5) and TML (best cluster: -3.13 to -2.72 s, sum(t(85)) = -136.4, pcorr = 9.10-3). (…) In order to obtain the time course of mood expression in the two ROIs (Figure 2c), we performed regressions between TML and BGA from all possible pairs of vmPFC and daIns recording sites recorded in a same subject (n = 247 pairs of recording sites from 18 subjects, see Methods) and tested the regression estimates across pairs within each ROI at each time point.”
- Effects shown in figs 2 and 3 are combined across subjects. We don't know the effective sample size for the comparisons being made, and the effects shown could be driven by just a few subjects. If the authors compute trial-wise regressions between mood and BGA for each subject, and then perform the statistics across subjects instead of across electrodes, do these results still pan out?
Yes, we have redone the analyses at the group level to get statistics across subjects (see response to essential revisions). All main results remained significant or borderline. In these group-level random-effect analyses, data points are subject-wise BGA averaged across recording sites (within the temporal cluster identified with the fixed-effect approach). We have incorporated these analyses into the manuscript as a supplementary table (Table S4). However, these statistics across subjects are less standard in the field of electrophysiology, as they are both underpowered and unadjusted for sampling bias (because the same weight is given to subjects with 1 or 10 recording sites in the ROI), so we prefer to keep the usual statistics across recording sites in the main text.
These analyses have been incorporated into the Results section (lines 355-357), as follows:
“We also verified that the main findings of this study remained significant (or borderline) when using group-level random-effects analyses (Table S4, see methods), even if this approach is underpowered and unadjusted for sampling bias (some subjects having very few recording sites in the relevant ROI).”
The methods section has also been edited, as follows (lines 831-835):
“To test the association between BGA and mood, TML or choice at the group level (using random-effects analyses), we performed the same linear regression as described in the electrophysiological analyses section on BGA averaged over the best time cluster (identified by the fixed-effects approach) and across all recording sites of a given subjects located in the relevant ROI. We then conducted a two-sided, one-sample Student's t-test on the resulting regression estimates (Table S4).”
- Furthermore, how many of the subjects show statistically significant regressions between BGA and mood at any electrode? For example, the error bars in fig 2b are across electrodes. How would this figure look if error bars indicated variance across subjects instead?
Depending on the metrics (mood rating or theoretical mood level), statistically significant regressions between BGA and mood was observed in 4 to 6 subjects for the vmPFC and 5 to 9 subjects in the daIns. We provide these numbers to satisfy the Reviewer’s request, but we do not see what statistical inference they could inform (inferences based on number of data points above and below significance threshold are clearly wrong). To satisfy the other request, we have reproduced below Fig. 2B with error bars indicating variance across subjects and not recording sites (Figure R2). Again, to make an inference about a neural representation at the population level, the relevant samples are recording sites, not subjects. All monkey electrophysiology studies base their inferences on the variance across neurons (typically coming from 2 or 3 monkeys pooled together).
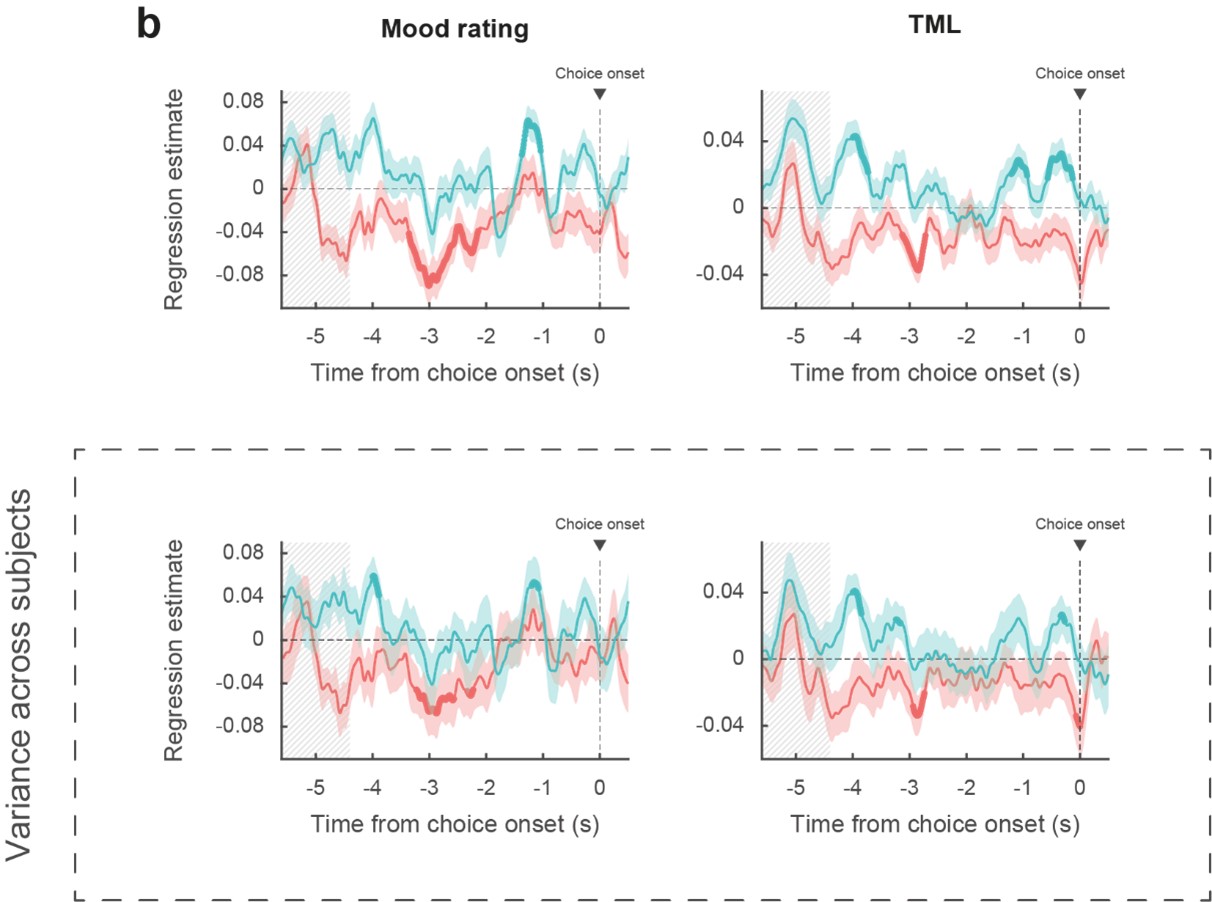
Figure R2: Reproduction of Figure 2B with lower panels indicating mean and variance across subjects instead of recording sites (upper panels). Blue: vmPFC, red: daIns. Bold lines indicate significant clusters (p < 0.05).
- In panel f, we can see that a large number of sites in both ROIs show correlations in the opposite direction to the reported effects. How can this be explained? How do these distributions of effects in electrodes correspond to distributions of effects in individual subjects?
In our experience, this kind of pattern is observed in any biological dataset, so we do not understand what the Reviewer wants us to explain. It is simply the case for any significant effect across samples, the distribution would include some samples with effects in the opposite direction. If there were no effects in the opposite direction, nobody would need statistics to know whether the observed distribution is different from the null distribution. In our case, the variability might have arisen from different sources of noise (in mood estimate, in BGA recording, in stochastic fluctuations of pre-stimulus activity, in the link between mood and BGA that may be depends on unknown factors, etc.) This variability has been typically masked because until recently, effects of interest were plotted as means with error bars. The variability is more apparent when plotting individual samples, as we did. It is visually amplified by the fact that outliers are as salient as data points close to the mean, which are way more numerous but superimposed. We have replotted below the panel f with data points being subjects instead of recording sites (Figure R3).
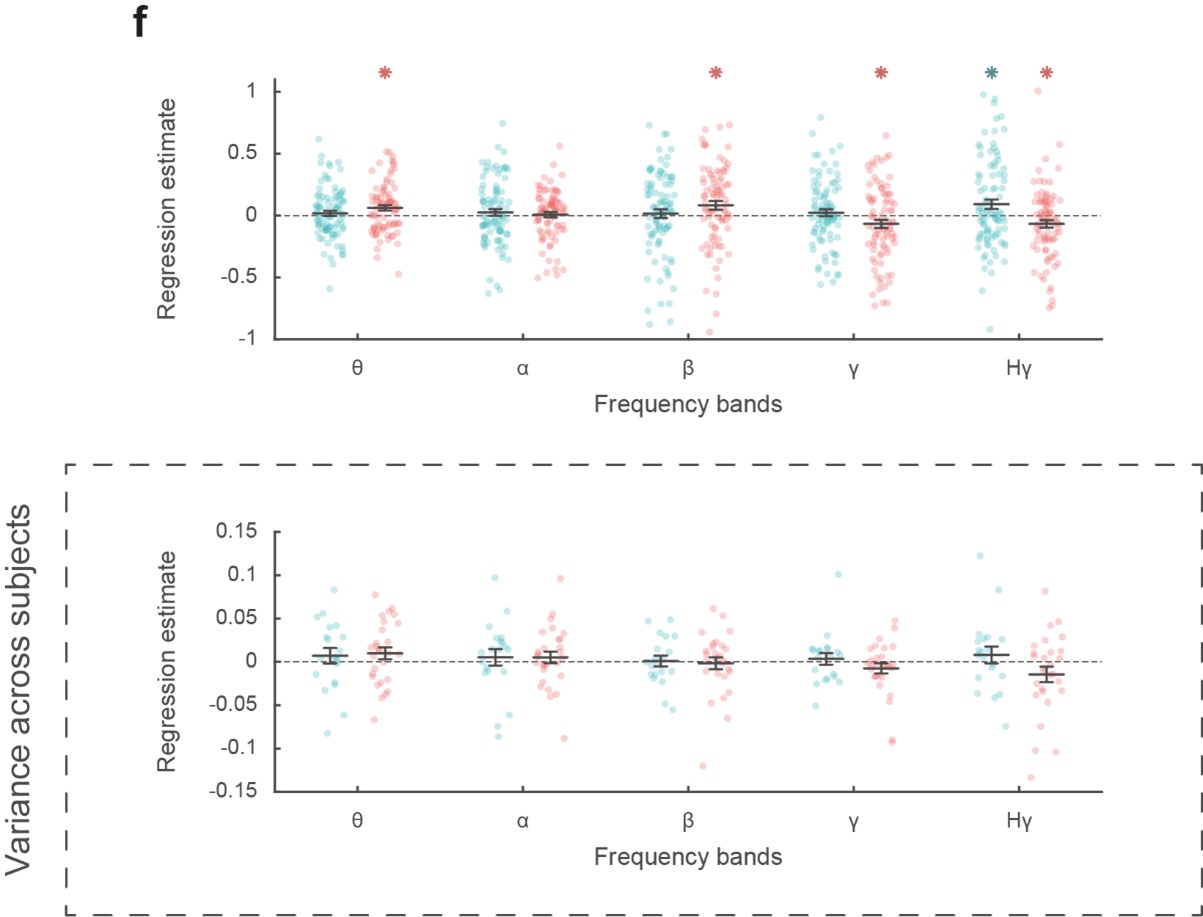
Figure R3: Reproduction of Figure 2F with lower panels showing the distribution, of regression estimates over subjects instead of recording sites (upper panels). Blue: vmPFC, red: daIns. Note that this is the only analysis which failed to reach significance using a group-level random-effect approach. This is not surprising as this approach is underpowered (perhaps in particular for this analysis over a [-4 to 0 s] pre-choice time window) and unadjusted for sampling bias (some subjects having very few recording sites in the relevant ROI).
- Baseline (pre-stimulus) gamma amplitudes have been shown to be related to attentional states. Could these effects be driven by attention rather than mood? The relationship between mood and decisions may be more complex than the authors describe, and could impact other cognitive factors such as attention, which have already been shown to impact baseline broad-band gamma.
We agree with the Reviewer that the relationships between mood and decisions are certainly more complex in reality than in our model, which is obviously a simplification, as any model is. We also acknowledge that pre-stimulus gamma activity is modulated by fluctuations in attention. However, what was measured and related to BGA in our study is mood level, so it remains unclear what reason could support the claim that the effects may have been driven by attention. A global shift in attentional state (like being more vigilant when in a good or bad mood) would not explain the specific effects we observed (making more or less risky choices). If the Reviewer means that subjects might have paid more attention to gain prospects when in a good mood, and to loss prospects when in a bad mood, then we agree this is a possibility. Note however that the difference between this scenario and our description of the results (subjects put more weight on gain/loss prospect when in a good/bad mood) would be quite subtle. We have nevertheless incorporated this nuance in the discussion (lines 494-496):
“This result makes the link with the idea that we may see a glass half-full or half-empty when we are in a good or bad mood, possibly because we pay more attention to positive or negative aspects.”
- The authors used a bipolar montage reference. Would it be possible that effects in low frequencies are dampened because of the bipolar reference instead of common average reference?
This is unlikely, because the use of a common average reference montage has been shown to significantly increase the number of channels exhibiting task-related high-frequency activity (BGA), but not the number of channels exhibiting task-related low-frequency activity (see Li et al., 2018, Figure 5A-B). In addition, using a monopolar configuration would also have the disadvantage of significantly increasing the correlations between channels (compared to a bipolar montage). This would have therefore artificially induced task-related effects in other channels due to volume conduction effects (Li et al., 2018; Mercier et al., 2017).
Reviewer #3 (Public Review):
In this interesting paper, Cecchi et al. collected intracerebral EEG data from patients performing decision-making tasks in order to study how patient's trial-by-trial mood fluctuations affect their neural computation underlying risky choices. They found that the broadband gamma activity in vmPFC and dorsal anterior Insula (daIns) are distinctively correlated with the patient's mood and their choice. I found the results very interesting. This study certainly will be an important contribution to cognitive and computational neuroscience, especially how the brain may encode mood and associate it to decisions.
Major comments
- The authors showed that the mood is positively correlated in vmPFC on high mood trials alone and negatively correlated daIns in low mood trials alone. This is interesting. But those are the trials in which these regions' activity predict choice (using the residual of choice model fit)?
This is an excellent point. The intuition of Reviewer 3 was correct. To test it, we performed a complementary analysis in which we regressed choice (model fit residuals) against BGA, separately for low vs. high mood trials (median-split). This analysis revealed that in the vmPFC, BGA during high mood trials positively predicted choices whereas in the daIns, BGA during low mood trials negatively predicted choices.
We have added the following paragraph in the Results section (lines 328-337):
“Taken together, these results mean that vmPFC and daIns baseline BGA not only express mood in opposite fashion, but also had opposite influence on upcoming choice. To clarify which trials contributed to the significant association between choice and BGA, we separately regressed the residuals of choice model fit against BGA across either high- or low-mood trials (median split on TML; Figure 3b). In the vmPFC, regression estimates were significantly positive for high-mood trials only (high TML = 0.06 ± 0.01, t(90) = 5.64, p = 2.10-7; two-sided, one-sample, Student’s t-test), not for low-mood trials. Conversely, in the daIns, regression estimates only reached significance for low-mood trials (low TML = -0.05 ± 0.01, t(85) = -4.63, p = 1.10-5), not for high-mood trials. This double dissociation suggests that the vmPFC positively predicts choice when mood gets better than average, and the daIns negatively predicts choice when mood gets worse than average.”
Also, Figure 3 has been modified accordingly.
- It would be helpful to see how high-mood trials and low-mood trials are distributed. Are they clustered or more intermixed?
We thank the Reviewer for the suggestion. To provide a more detailed view on how feedback history shaped mood ratings and TML, we added a supplementary figure that shows a representative example (Figure S1).
- I am not sure how I should reconcile the above finding of the correlation between mood and BGA on high-mood vs. low-mood trials, and the results about how high vs. low baseline BGA predict choice. I may have missed something related to this in the discussion section, but could you clarify?
Following the Reviewer’s suggestion, we now demonstrate that the vmPFC positively predicts choice when mood gets better than average, and the daIns negatively predicts choice when mood gets worse than average (see response to first point).
To clarify this, we have added the following paragraph in the discussion (lines 461-469), and a schematic figure summarizing the main findings (Figure 4).
“Choice to accept or reject the challenge in our task was significantly modulated by the three attributes displayed on screen: gain prospect (in case of success), loss prospect (in case of failure) and difficulty of the challenge. We combined the three attributes using a standard expected utility model and examined the residuals after removing the variance explained by the model. Those residuals were significantly impacted by mood level, meaning that on top of the other factors, good / bad mood inclined subjects to accept / reject the challenge. The same was true for neural correlates of mood: higher baseline BGA in the vmPFC / daIns was both predicted by good / bad mood and associated to higher accept / reject rates, relative to predictions of the choice model. Thus, different mood levels might translate into different brain states that predispose subjects to make risky or safe decisions (Figure 4).”
-
Evaluation Summary:
This study uses intracranial EEG to explore links between broad-band gamma oscillations and mood, and their impact on decisions. While the results are potentially interesting, additional details and analyses are necessary to show that results are not driven by confounds. In addition, there is about a major concern that statistics are performed across electrodes instead of across subjects.
(This preprint has been reviewed by eLife. We include the public reviews from the reviewers here; the authors also receive private feedback with suggested changes to the manuscript. The reviewers remained anonymous to the authors.)
-
Reviewer #1 (Public Review):
Investigators assumed that our mood fluctuations could be predictive of risky versus non-risky choices we make. Hence, they aimed to understand the neural basis for "mood" fluctuations that could explain why there is behavioral variability. The main tenet of the authors' current work is that behavioral variation can be explained by changes in neural signals in different regions of the human brain. Here, they report findings of fluctuations in two areas of the brain that correlate with mood fluctuations in opposite directions.
A number of methodological issues need to be resolved:
The documented findings may be explained by the artifact of task design and the way the signals were calculated: The vmPFC was the only ROI for which a positive correlation was found between BGA and mood rating and TML. Instead, …
Reviewer #1 (Public Review):
Investigators assumed that our mood fluctuations could be predictive of risky versus non-risky choices we make. Hence, they aimed to understand the neural basis for "mood" fluctuations that could explain why there is behavioral variability. The main tenet of the authors' current work is that behavioral variation can be explained by changes in neural signals in different regions of the human brain. Here, they report findings of fluctuations in two areas of the brain that correlate with mood fluctuations in opposite directions.
A number of methodological issues need to be resolved:
The documented findings may be explained by the artifact of task design and the way the signals were calculated: The vmPFC was the only ROI for which a positive correlation was found between BGA and mood rating and TML. Instead, most other regions showed negative correlation (inlc da-Insula, dorsolateral prefrontal cortex, the visual cortex, the motor cortex, the dorsomedial premotor cortex, the ventral somatosensory cortex, and the ventral inferior parietal lobule). This can be purely an artifact of task itself: In 25% of mood rating trials, subjects were presented with a question. They had to move the cursor from left (very bad) to the right (very good) along a continuous visual analog scale (100 steps) with left and right-hand response buttons. They even got a warning if they were slow.
In 75% of trials, subjects saw none of this and the screen was just blank and the subjects rested. First of all it is unclear if the 25% and 75% trials were mixed. I am assuming that they were not mixed as that could represent a fundamental mistake. The manuscript gives me the impression that this was not done (please clarify). Assuming that they were not mixed and we are seeing the data from 75% of trials only. These trials would trigger increased BGA activity in the default mode areas such as the vmPFC, and opposite patterns in the salience, visual and motor areas. Hence the opposite correlations.
The authors should just plot BGA activity across regions during rest trials and see if this was the case. That would provide a whole different interpretation.
In addition, it is entirely unclear how the BGA in a given electrode was plotted. How is BGA normalized for each electrode? What is baseline here? Without understanding what baseline was used for this normalization, it is hard to follow the next section about the impact of the intracerebral activity on decision-making.
Line 237: how was the correction for multiple comparisons done? Subject by subject, ROI by ROI, electrode by electrode? Please clarify.
-
Reviewer #2 (Public Review):
This study used intracranial EEG to explore links between broad-band gamma oscillations and mood, and their impact on decisions. The topic is interesting and important. A major strength is the use of intracranial EEG (iEEG) techniques, which allowed the authors to obtain electrical signals directly from deep brain areas involved in decision making. With its precise temporal resolution, iEEG allowed the authors to study activity in specific frequency bands. While the results are potentially interesting, one major concern with the analysis procedure-specifically grouping of all data across all subjects and performing statistics across electrodes instead of across subjects-reduces enthusiasm for these findings. There is also a question about how mood impacts attentional state, which has already been shown to …
Reviewer #2 (Public Review):
This study used intracranial EEG to explore links between broad-band gamma oscillations and mood, and their impact on decisions. The topic is interesting and important. A major strength is the use of intracranial EEG (iEEG) techniques, which allowed the authors to obtain electrical signals directly from deep brain areas involved in decision making. With its precise temporal resolution, iEEG allowed the authors to study activity in specific frequency bands. While the results are potentially interesting, one major concern with the analysis procedure-specifically grouping of all data across all subjects and performing statistics across electrodes instead of across subjects-reduces enthusiasm for these findings. There is also a question about how mood impacts attentional state, which has already been shown to impact baseline (pre-stimulus) broad band gamma.
Major comments:
The number of subjects with contacts in vmPFC, daIns, and both vmPFC and daIns should be stated in the manuscript so the reader doesn't have to refer to the supplementary table to find this information.
Effects shown in figs 2 and 3 are combined across subjects. We don't know the effective sample size for the comparisons being made, and the effects shown could be driven by just a few subjects. If the authors compute trial-wise regressions between mood and BGA for each subject, and then perform the statistics across subjects instead of across electrodes, do these results still pan out?
Furthermore, how many of the subjects show statistically significant regressions between BGA and mood at any electrode? For example, the error bars in fig 2b are across electrodes. How would this figure look if error bars indicated variance across subjects instead?
In panel f, we can see that a large number of sites in both ROIs show correlations in the opposite direction to the reported effects. How can this be explained? How do these distributions of effects in electrodes correspond to distributions of effects in individual subjects?
Baseline (pre-stimulus) gamma amplitudes have been shown to be related to attentional states. Could these effects be driven by attention rather than mood? The relationship between mood and decisions may be more complex than the authors describe, and could impact other cognitive factors such as attention, which have already been shown to impact baseline broad-band gamma.
The authors used a bipolar montage reference. Would it be possible that effects in low frequencies are dampened because of the bipolar reference instead of common average reference?
-
Reviewer #3 (Public Review):
In this interesting paper, Cecchi et al. collected intracerebral EEG data from patients performing decision-making tasks in order to study how patient's trial-by-trial mood fluctuations affect their neural computation underlying risky choices. They found that the broadband gamma activity in vmPFC and dorsal anterior Insula (daIns) are distinctively correlated with the patient's mood and their choice.
I found the results very interesting. This study certainly will be an important contribution to cognitive and computational neuroscience, especially how the brain may encode mood and associate it to decisions.
Questions:
The authors showed that the mood is positively correlated in vmPFC on high mood trials alone and negatively correlated daIns in low mood trials alone. This is interesting. But those are the …
Reviewer #3 (Public Review):
In this interesting paper, Cecchi et al. collected intracerebral EEG data from patients performing decision-making tasks in order to study how patient's trial-by-trial mood fluctuations affect their neural computation underlying risky choices. They found that the broadband gamma activity in vmPFC and dorsal anterior Insula (daIns) are distinctively correlated with the patient's mood and their choice.
I found the results very interesting. This study certainly will be an important contribution to cognitive and computational neuroscience, especially how the brain may encode mood and associate it to decisions.
Questions:
The authors showed that the mood is positively correlated in vmPFC on high mood trials alone and negatively correlated daIns in low mood trials alone. This is interesting. But those are the trials in which these regions' activity predict choice (using the residual of choice model fit)?
It would be helpful to see how high-mood trials and low-mood trials are distributed. Are they clustered or more intermixed?
I am not sure how I should reconcile the above finding of the correlation between mood and BGA on high-mood vs. low-mood trials, and the results about how high vs. low bassline BGA predict choice. I may have missed something related to this in the discussion section, but could you clarify?
-
