UP-DOWN states and ripples differentially modulate membrane potential dynamics across DG, CA3, and CA1 in awake mice
Curation statements for this article:-
Curated by eLife

Evaluation Summary:
This study uses dual intracellular and extracellular recordings in different subfields of the hippocampus in awake mice during immobility to investigate the initiation of sharp wave-ripples, synchronous bursts of hippocampal activity thought to be important for memory formation. It provides unique data obtained in vivo across a diversity of hippocampal cell types. Specifically, these findings lead to a model where inhibition of CA3 pyramidal cells is permissive to ripple generation.
(This preprint has been reviewed by eLife. We include the public reviews from the reviewers here; the authors also receive private feedback with suggested changes to the manuscript. Reviewer #1 and Reviewer #3 agreed to share their name with the authors.)
This article has been Reviewed by the following groups
Discuss this preprint
Start a discussion What are Sciety discussions?Listed in
- Evaluated articles (eLife)
Abstract
Hippocampal ripples are transient population bursts that structure cortico-hippocampal communication and play a central role in memory processing. However, the mechanisms controlling ripple initiation in behaving animals remain poorly understood. Here we combine multisite extracellular and whole-cell recordings in awake mice to contrast the brain state and ripple modulation of subthreshold dynamics across hippocampal subfields. We find that entorhinal input to the dentate gyrus (DG) exhibits UP and DOWN dynamics with ripples occurring exclusively in UP states. While elevated cortical input in UP states generates depolarization in DG and CA1, it produces persistent hyperpolarization in CA3 neurons. Furthermore, growing inhibition is evident in CA3 throughout the course of the ripple buildup, while DG and CA1 neurons exhibit depolarization transients 100 ms before and during ripples. These observations highlight the importance of CA3 inhibition for ripple generation, while pre-ripple responses indicate a long and orchestrated ripple initiation process in the awake state.
Article activity feed
-

-

Author Response
Reviewer #1 (Public Review):
This is a very interesting paper describing membrane potential dynamics of hippocampal principal cells during UP/DOWN transitions and sharp-wave ripples. Using whole-cell in combination with linear LFP recordings in head-fixed awake mice, the authors show striking differences of membrane potential responses in principal cells from the dentage gyrus, CA3 and CA1 sectors. The authors propose that switches between a dominant inhibitory excitable state and a disinhibited non-excitable state control the intra-hippocampal dynamics during UP/DOWN transitions.
Obtaining intracellular recordings in vivo is commendable. The authors provide valuable data and analysis. While data show clear trends and some of the conclusions are well supported, the authors may need to clarify the following potential …
Author Response
Reviewer #1 (Public Review):
This is a very interesting paper describing membrane potential dynamics of hippocampal principal cells during UP/DOWN transitions and sharp-wave ripples. Using whole-cell in combination with linear LFP recordings in head-fixed awake mice, the authors show striking differences of membrane potential responses in principal cells from the dentage gyrus, CA3 and CA1 sectors. The authors propose that switches between a dominant inhibitory excitable state and a disinhibited non-excitable state control the intra-hippocampal dynamics during UP/DOWN transitions.
Obtaining intracellular recordings in vivo is commendable. The authors provide valuable data and analysis. While data show clear trends and some of the conclusions are well supported, the authors may need to clarify the following potential confounds, which can actually impact their conclusions and interpretation:
1- All the analysis is based in z-scored membrane potential responses but the mean resting membrane potential is never reported. For DG granule cells recorded in awake conditions, the membrane potential is usually hyperpolarized so that most of the effect may be due to reversed GABAa mediated currents. Similarly, for those cells exhibiting the non-expected polarization during UP/DOWN states there may be drifts around reversal potentials explaining their behavior. Moreover, regional trends on passive and active membrane parameters and connectivity can actually explain part of the variability. A longitudinal comparison of state Vm and spikes in fig.5 suggests that some of the largest depolarized responses are not correlated with firing. Authors should evaluate this angle, ideally showing the distribution of membrane potential values across cells and regions and confronting this with the different membrane potential responses.
We added Figure 1 - figure supplement 4, which now describes the mean resting membrane potential, input resistance, burst propensity, and spikes per burst for the recorded cells. These data are provided in Figure 1 - source data 1 together with a recording identifier that can be used to link each cell to all other figure panels and data files. We further added Figure 1 - figure supplement 1, which provides examples of morphological information for our recordings, Figure 1 - figure supplement 2 that shows examples of bursts from morphologically identified neurons, and Figure 1 - figure supplement 3 that shows the locations of recorded cells.
In addition, we added Figure 5 - figure supplement 4 that includes the resting Vm and proximodistal location of cells in relation to their UP-DOWN modulation. We did not detect any significant trends with respect to brain state modulation. DG cells are more hyperpolarized compared to CA3 and CA1 cells and are closest to the reversal potential for GABAa (Figure 1 - figure supplement 4). The lack of any clear trends with respect to the resting Vm suggests that drifts around the GABAa reversal potential are unlikely to be a major factor driving variability in the observed UDS modulation.
2- While there are some trends for each hippocampal regions, there is also individual variability across cells during UP/DOWN transitions (fig.5) and near ripples (fig.6). What part of this variability can be explained by proximodistal and/or deep-superficial differences of cell location and identity? Can authors provide some morphological validation, even if in only a subset of cells? For CA3, proximodistal heterogeneity for intrinsic properties and entorhinal input responses are well documented in intracellular recordings both in vitro and in vivo. What is the location of CA3 cell contributing to this study? For CA1 cells, deep-superficial trends of GABAergic perisomatic inhibition and connectivity with input pathways dominate firing responses. Regarding DG cells, are all they from the upper blade?
We now provide morphological validation for a subset of cells (Figure 1 - figure supplement 1). Since we patch multiple cells in each experiment it is not possible to unequivocally determine their depth within the cell layer, although it is possible to confirm that they are granule cells or pyramidal cells in experiments where all labeled cells are principal neurons (Figure 1 - figure supplement 1). In addition, we added Figure 1 - figure supplement 3 that shows the proximodistal locations of recorded cells. With respect to the DG cells 20/22 are from the upper blade, with only two granule cells recorded in the lower blade (Figure 1 - figure supplement 3).
We added Figure 5 - figure supplement 4 that includes the resting Vm and proximodistal location of each cell as a function of UP-DOWN modulation. We did not detect any significant trends with respect to UDS modulation.
In addition, we added Figure 6 - figure supplement 1 that includes the resting Vm and proximodistal location of each cell as a function of ripple modulation. This figure shows that the most depolarized CA3 cells tend to hyperpolarize most during ripples, consistent with the fact that these cells are furthest away from the GABAa reversal potential and experience the highest driving force. No other significant trends were detected, although we would like to note that our recordings do not span the full proximodistal axis and may hence not be ideally suited to test the dependence of our results on proximodistal location.
3- AC-coupled LFP recordings cannot provide unambiguous identification of the sign of phasic CSD signals, because fluctuations accompanying UP/DOWN states alter the baseline reference. This is actually the case, given changes of membrane potential accompanying UP/DOWN transitions. I recommend reading Brankack et al. 1993 doi: 10.1016/0006-8993(93)90043-m. The authors should acknowledge this limitation and discuss how it could influence their results. One potential solution to get rid of this effect is using principal/independent component analysis for blind source separation.
We acknowledge the inherent limitations of AC-coupled recordings in regards to CSD analysis (Brankack et al., 1993). However, we do not believe these limitations affect our analysis or results for the reasons illustrated in Figure R1. Specifically, we do not attempt to measure the low frequency (< 1 Hz) CSD content directly. Instead, we extract the envelope of the rectified fast CSD transients. In the original submission we referred to this envelope signal as “DG CSD magnitude”, which may have been confusing. In the revised manuscript we use “DG CSD activity” instead to remove any suggestion that the low frequency CSD signal was directly measured. Notice that because of the rectification step the envelope signal is insensitive to the actual polarity of the fast transient CSD fluctuations. Using the envelope, we identify UP states as time periods when the rate and amplitude of EC input current transients, rather than the DC level, increases, in accordance with previous publications (Isomura et al., 2006). We further validated that the extracted UP/DOWN states reflect modulation of pupil diameter and ripple rate, quantities that are independently measured.
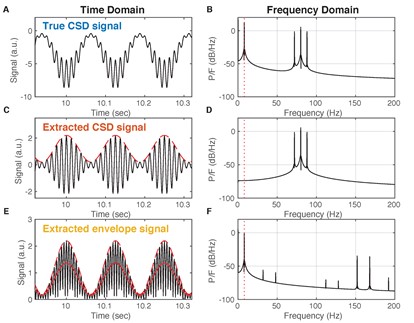
Figure R1. Deriving slow envelope signal from AC coupled recordings. (A) In this example the true CSD signal contains both a slow component (8 Hz) and a fast component (80 Hz) that is amplitude modulated by the slow component. Such phase-amplitude coupling is well known between theta and gamma oscillations in the hippocampus. The true CSD shows a current sink with time-varying magnitude. (B) The power spectral density (PSD) estimate of the signal in (A) shows both the slow (8 Hz) and fast (three peaks near 80 Hz) components. (C) Assume LFP recordings are obtained with a high-pass filter that has eliminated the slow component. Consequently, the estimated CSD signal contains only fast fluctuations. Furthermore, instead of a time-varying current sink it shows quickly alternating sinks and sources (both negative and positive values). The slow component can be visualized as the amplitude envelope (interrupted red line) of the signal. (D) PSD estimate shows that the slow component is absent from the extracted CSD signal. (E) Rectifying the CSD estimate (black) and then filtering (red) approximately recovers the true slow component (red interrupted). This is how the DG CSD activity signal is obtained. (F) PSD estimate of the rectified and filtered CSD signal recovers the slow component (interrupted red vertical line).
Reviewer #2 (Public Review):
In this manuscript "Inhibition is the hallmark of CA3 intracellular dynamics around awake ripples" the authors obtained Vm recordings from CA1, CA3 and DG neurons while also obtaining local field potentials across the CA1 and DG layers. This enabled them to identify periods of up and down state transitions, and to detect sharp-wave ripples (SWRs). Using these data, they then came to the conclusion that compared to CA1 and DG, the Vm of more CA3 neurons is hyperpolarized at the approximate time of SWRs.
Unfortunately, for the following reasons, the current manuscript does not necessarily support this conclusion:
Recordings are obtained in mice who are recently (same day) recovering from craniotomy surgery/anesthesia and have no training on head fixation. This means that the behavioral state is abnormal, and the animal may have residual anesthesia effects.
The main surgery for implanting the head-fixation apparatus and marking the coordinates for multisite and pipette insertion was carried out at least two days before the experiment. On the day of the experiment animals were briefly lightly anesthetized (<1 hr, at <1% isoflurane at 1 lit/min) for the sole purpose of resecting the dura at the two sites for multisite probe and pipette insertion. This procedure was carried out on the same day as the experiment in order to minimize the time the brain was exposed and optimize the quality of the recordings. Experiments began at least six hours after this short procedure. Furthermore, animals were given time to get familiarized with the behavioral apparatus before recordings began and showed no signs of distress.
Previous studies show that about 95% of isoflurane is eliminated within minutes by exhalation (Holaday et al., 1975). The further elimination of isoflurane proceeds with a fast phase with half-time of about 7-9 min and a slower phase with half-time of about 100-115 min (Chen et al., 1992), with the faster phase reflecting elimination from the brain (Litt et al., 1991). Given these considerations there should be negligible residual isoflurane from the short anesthesia six hours later when recordings are initiated.
In order to further investigate whether the short and light anesthesia during the day of recordings has any effect on the results reported in the paper, we carried out additional experiments in which we performed the surgery, including dura removal, 3 days before the recording session. The animals were habituated under head-fixation on the spherical treadmill for two hour periods each of the two days following the surgery. On the third day after surgery, we carried out recordings without any surgical procedures or anesthesia. The durations of UP and DOWN states without same day anesthesia were similar to those obtained in our previous experiments (Figure 2- figure supplement 4). The additional CA3 whole-cell recordings obtained in these new experiments have the same hyperpolarization features typical of our previous recordings. These additional experiments argue that the brief anesthesia on the day of recordings has no significant effect on the results.
Most of the paper is dedicated to dynamics around up-down state transitions, not focused on ripples.
We changed the title to “Up-Down states and ripples differentially modulate membrane potential dynamics across DG, CA3, and CA1 in awake mice” to reflect the analysis of both UP-DOWN state transitions and ripples. The two analyses are linked as the brain state modulation accounts for the slow Vm modulation around ripples.
Vm should be examined raw first, then split into fast and slow -the cell lives with the raw Vm.
The raw Vm can be obtained by adding the slow and fast Vm components. Hence the behavior of the Vm around ripples can be obtained by adding the panels of columns 1 and 3 in Figure 6. Decomposing into the slow and fast components illustrates how the slow modulation around ripples is due to brain state modulation of the slow component of the Vm (Figure 6).
While some (assumed) CA3 principal cells were hyperpolarized around the time of ripples, saying inhibition is the hallmark of CA3 dynamics around ripples is an exaggeration, especially because it does not seem mechanistically tied to anything else.
While a small fraction of CA3 cells is excited around ripples, the majority is inhibited. We suggest that the inhibition of the majority of CA3 neurons can account for the sparse and selective activation of CA3 around ripples.
The use of ripple onset time is questionable, since the detected onset of the ripple depends on the detector settings, amplifier signal-to-noise ratio, etc. The best and most widely used (including by a subset of these authors) metric is the ripple peak time.
We added Figure 6 - figure supplement 2, which shows that the Vm modulation around peak ripple power is the same as the modulation around ripple start, except for a small time shift due to the fact that the ripple power peaks shortly after ripple start. Our focus on ripple onset facilitates characterizing the timing of pre-ripple activity, such as the Vm depolarization observed before ripple onset for DG and CA1 neurons.
There is not enough raw data (or quality metrics) shown to judge the quality of the data, especially for the whole cell recordings. For instance what was the input resistance of the neurons? Was the access resistance constant?
We added Figure 1 - figure supplement 4, which now describes the mean resting membrane potential, input resistance, burst propensity, and spikes per burst for the recorded cells. These data are provided in Figure 1 - source data 1 together with a recording identifier that can be used to link each cell to all other figure panels and data files. We further added Figure 1- figure supplement 1, which provides examples of morphological information for our recordings, Figure 1 - figure supplement 2 that shows examples of bursts from morphologically identified neurons, and Figure 1 - figure supplement 3 that shows the locations of recorded cells.
There is not enough explanation regarding why the reported results on the spiking of CA1 and CA3 neurons in SWRs is so different than previously published. In general, whole cell recording is not the most reliable way to record spike timing, and the presented whole cell data differ from previously published juxtacellular and extracellular recording methods, which better preserve physiological spiking activity.
The CA1 neurons in this study depolarize and elevate their firing around ripples, consistent with previous intracellular and extracellular recordings. Our study reveals hyperpolarization of the majority of CA3 cells while only a small fraction is depolarized. This is consistent with the sparse activation of CA3 around ripples previously reported with extracellular studies. The overall firing rate change of CA3 neurons around ripples is a balance between the firing rate elevation of the small subset of activated cells and the net decrease in firing across the rest of the population. Since the baseline firing rate of CA3 pyramidal neurons in quiet wakefulness and sleep is low, the ripple-associated inhibition may not be readily observable in the spiking of individual CA3 neurons due to a “floor effect”. The overall rate of CA3 neurons we record increases before ripple onset, consistent with previous studies (Fig. 6D4). The subthreshold hyperpolarization of the majority of neurons provides novel insights into the mechanisms ensuring sparse and selective activation of the CA3 population around ripples.
The number of neurons from each area is not reported.
The number of cells was (indirectly) reported as the number of rows in Figs. 3-7. We now report the number of cells explicitly: 22 DG cells, 32 CA3 cells, and 32 CA1 cells.
There is no verification of cell type so it is inappropriate to assume that all neurons are the principal neurons.
We added Figure 1 - figure supplement 1, which shows morphological identification of recorded cells. We patch multiple cells in each experiment, but we can confirm the morphological identity of principal neurons when all stained cells have morphology of dentate granule cells or CA3/CA1 pyramidal neurons. The properties of morphologically identified cells in Figure 1 - figure supplement 1 are typical of all recorded cells (morphologically identified neurons from Figure 1 - figure supplement 1 are shown as diamonds in Figure 1- figure supplement 4, while the rest are shown as dots). There were no significant differences between the two groups (p > 0.05 t-test; p > 0.05 Wilcoxon rank sum test).
Are the fluctuations in the CA3 Vm generally smaller than for CA1 and DG because of physiology or technical reasons?
The recordings were done in exactly the same way across areas, arguing against technical reasons for any differences observed across the hippocampal subfields.
Reviewer #3 (Public Review):
During slow wave sleep and quiet immobility, communication between the hippocampus and the neocortex is thought to be important for memory formation notably during periods of hippocampal synchronous activity called sharp-wave ripple events. The cellular mechanisms of sharp-wave ripple initiation in the hippocampus are still largely unknown, notably during awake immobility. In this paper, the authors addressed this question using patch-clamp recordings of principal cells in different hippocampal subfields (CA3, CA1 and the dentate gyrus) combined with extracellular recordings in awake head-fixed mice as well as computer modeling. Using the current source density (CSD) profile of local field potential (LFP) recordings in the molecular layer of the dentate gyrus as a proxy of UP/DOWN state activity in the entorhinal cortex they report the preferential occurrence of sharp-wave ripple (recorded in area CA1) during UP states with a higher probability toward the end of the UP state (unlike eye blinks which preferentially occur during DOWN states). Patch-clamp recordings reveal that a majority of dentate granule cells get depolarized during UP state while a majority of CA3 pyramidal cells get hyperpolarized and CA1 pyramidal cells show a more mixed behavior. Closer examination of Vm behavior around state transitions revealed that CA3 pyramidal cells are depolarized and spike at the DOWN/UP transition (with some cells depolarizing even earlier) and then progressively hyperpolarize during the course of the UP state while DGCs and CA1 pyramidal cells tend to depolarize and fire throughout the UP state. Interestingly, CA3 pyramidal cells also tend to be hyperpolarized during ripples (except for a minority of cells that get depolarized and could be instrumental in ripple generation), while DGCs and CA1 pyramidal cells tend to be depolarized and fire. The strong activation of dentate granule cells during ripples is particularly interesting and deserves further investigations. The observation that the probability of ripple occurrence increases toward the end of the UP state, when CA3 pyramidal cells are maximally hyperpolarized, suggests that the inhibitory state of the CA3 hippocampal network could be permissive for ripple generation possibly by de-inactivation of voltage-gated channels thus increasing their excitability (i.e. ability to get excited). Altogether, these results confirm previous work on the impact of slow oscillations on the membrane potential of hippocampal neurons in vivo under anesthesia but also point to specificities possibly linked to the awake state. They also invite to revisit previous models derived from in vitro recordings attributing synchronous activity in CA3 to a global build-up of excitatory activity in the network by suggesting a role for Vm hyperpolarization in preserving the excitability of the CA3 network.
- In light of recent report of heterogeneity within hippocampal cell types (and notably description of a new CA3 pyramidal cell type instrumental for sharp-wave ripple generation) (Hunt et al., 2018), the small minority of CA3 pyramidal cells depolarized during ripples deserve more attention. These cells are indeed likely key in the generation of sharp wave ripple. Several analyses could be performed in order to decipher whether they have specific intrinsic properties (baseline Vm, firing threshold, burst propensity), whether they are located in specific sub-areas of CA3 (a versus b, deep versus superficial) and whether they are distinctively modulated during UP/DOWN states.
Following the reviewer’s suggestion we now analyze the properties and UDS modulation of the CA3 neurons that are depolarized around ripples (Figure 6 - figure supplement 3). These neurons have comparable resting Vm, spike thresholds, and burst propensity as the rest of the CA3 population (p > 0.05, t-test). These CA3 cells had lower firing probability in the DOWN state. The locations of the depolarized cells are distributed across CA3c,b and are not clustered compared to the rest of the cells (Figure R2).
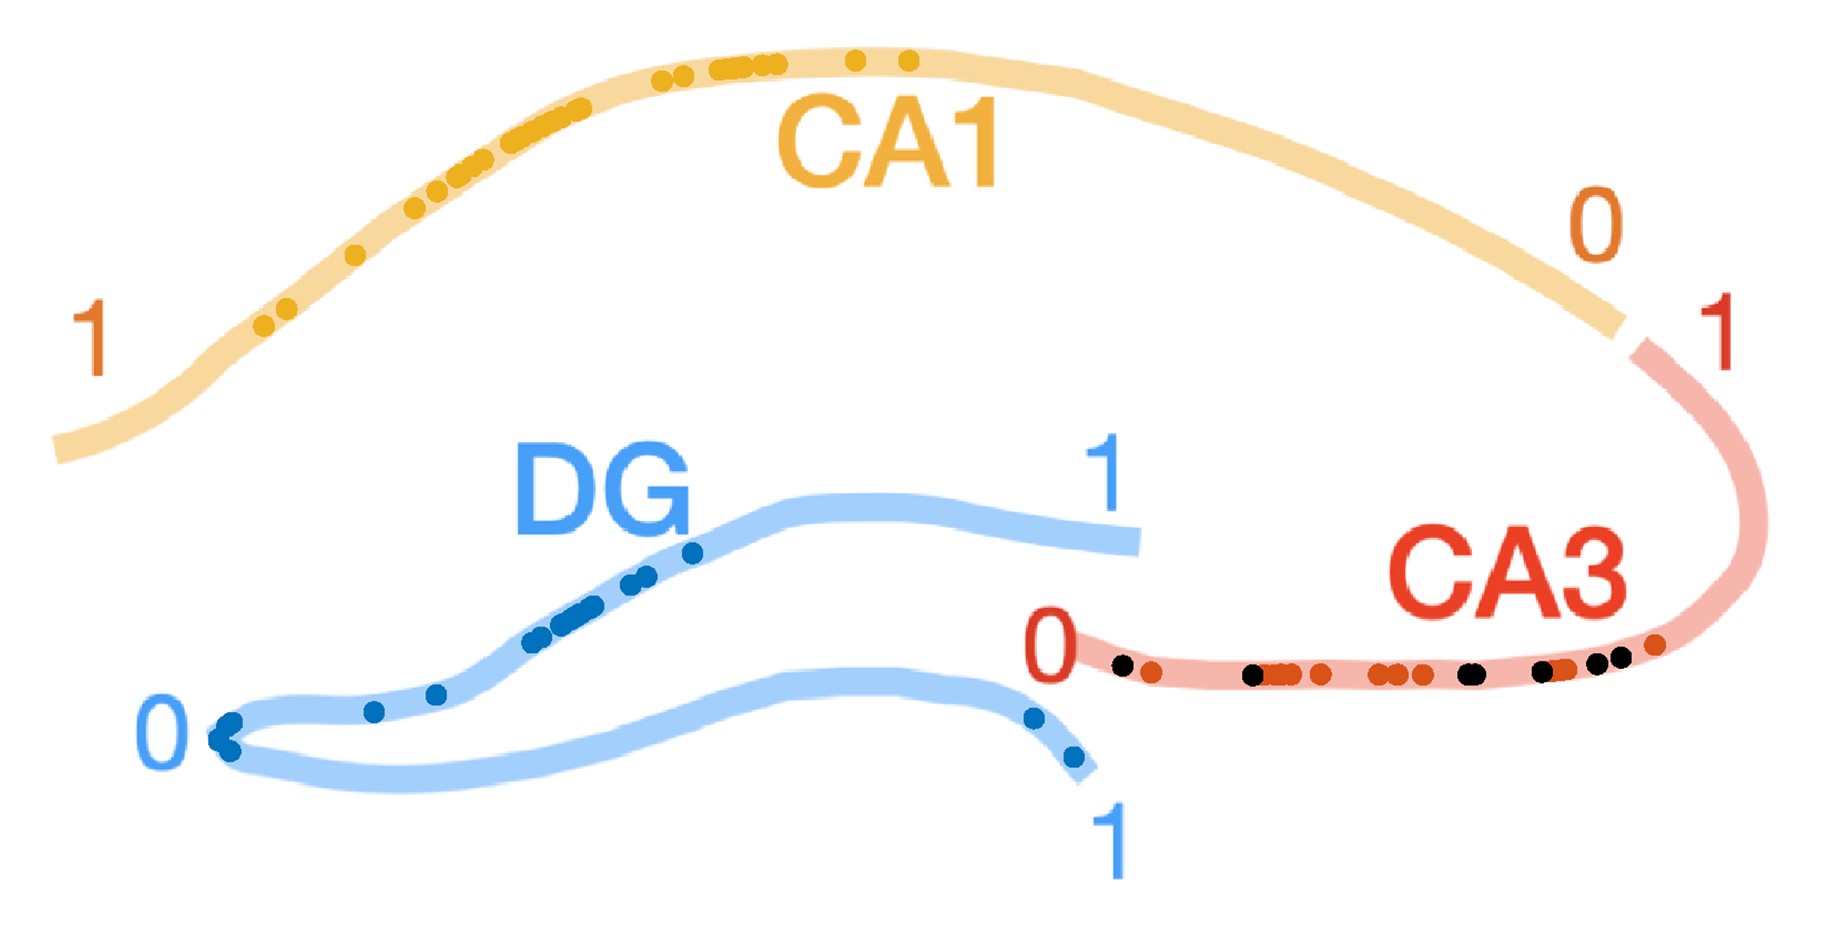
Figure R2. Proximodistal locations of CA3 cells that depolarize during ripples. Same as Figure 1 - figure supplement 3, but CA3 cells showing depolarization in their ripple-triggered average (RTA) response are marked with black dots. There was no significant difference in the proximodistal locations of these cells compared to the rest of the CA3 population (p > 0.05, t-test).
The population of athorny cells described in Hunt et al. represents a small percentage of CA3 cells (10-20%) that are concentrated in the CA3a region, which we do not sample in our recordings. Hence, the depolarized cells are unlikely to correspond to the athorny cells reported in Hunt et al.
- The authors use CSD analysis in the DG as a proxy of synaptic inputs coming from the EC to define alternating periods of UP and DOWN states. I have few questions concerning this procedure: 1- It is unclear if only periods when animals was still/immobile were analyzed. 2- How coherent were these periods with slow oscillations recorded in the cortex (which are also recorded with the linear probe?).
The analysis was restricted to periods of immobility, which comprise the majority of the recording time as the animals are not performing any task. Cortical LFPs exhibit high coherence for low frequencies (<1 Hz) with the rectified DG CSD signal (Figure R3), although the contribution of volume conduction to this effect cannot be ruled out.
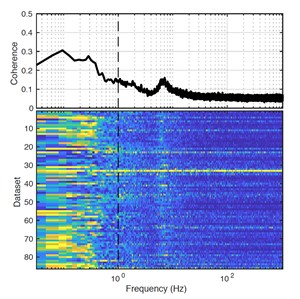
Figure R3. Coherence between DG CSD power and cortical LFP. (Top) population average magnitude squared coherence between DG CSD power (rectified CSD from the DG molecular layer) and cortical LFP across all recorded datasets. Notice the elevated coherence at low frequencies (< 1 Hz, vertical interrupted line) as well as the peak at theta ( 7-8 Hz). Volume conduction from other brain areas (i.e. the hippocampus) contributes to the cortical LFP and may be responsible for the coherence at theta, as well as at low frequencies. (Bottom) Each row in the pseudocolor image shows the coherence between DG CSD power and cortical LFP for a given dataset.
3- How long did these periods last? Did they occur during classically described hippocampal states (LIA/SIA) or do they correspond to a different state (Wolansky et al., J Neurosci 2006).
The distribution of UP and DOWN state durations is shown in Figure 2 - figure supplement 4.
We also added Figure 2 - supplementary figure 8 that shows the distribution of LIA and SIA transitions as a function of UDS phase. The LIA and SIA states were computed based on LFPs from CA1 stratum radiatum as described in (Hulse et al., 2017). The detected LIA→SIA transitions map very closely to UP→DOWN transitions. The SIA→LIA transitions are also concentrated around DOWN→UP transitions, but the distribution is broader compared to the LIA→SIA transitions. These observations are consistent with UP states broadly overlapping with LIA and DOWN states with SIA.
- To better characterize hippocampal CSD profiles around ripples and UP/Down states transitions, could you plot ripple and UDS transition-triggered average CSD profiles across hippocampal subfields?
We added Figure 2 - supplementary figure 7 that shows average CSD profiles around UP/DOWN state transitions and ripples.
- The duration of UP states appears longer than that reported in anesthetized animals. To ascertain this fact could the authors quantify and report mean UP and DOWN states durations? Shorter DOWN states would decrease the probability to detect ripple. Could the authors correct for this bias in their analysis of ripple occurrence during UP and DOWN states?
We report the medians and means of the distributions of UP and DOWN durations in Figure 2 - figure supplement 4. Ripples occur almost exclusively during the UP states, with almost no ripples occurring in DOWN states. Furthermore, the duration of UP and DOWN states is comparable suggesting that the duration of DOWN states does not bias the probability of ripple detection. We also added Figure 2 - figure supplement 2B, showing the rate (in Hz) of ripple occurrence as a function of UDS phase, which explicitly controls for UDS phase occupancy.
The duration of UP and DOWN states in quiet wakefulness depend on the behavior of the animal, attentional state, and external stimuli and need not be the same as in anesthesia or sleep when the animal is not behaving and is less responsive to external stimuli. To provide validation that the extracted UP and DOWN states in quiet wakefulness indeed correspond to genuine brain states, we show that the pupil diameter and ripple rates which are independently extracted are strongly modulated around the extracted UP and DOWN states.
- The authors report a high coherence between the Vm of an example CA3 pyramidal cells and UP/DOWN state in DG. Was it a general property of a majority of CA3 pyramidal cells? The coherence values should be reported for all CA3 pyramidal cells.
We added Figure 2 - figure supplement 1, which reports the coherence of all cells across the subfields with the rectified DG CSD. The coherence values are similar across cells and subfields. We also report correlations between the slow component of the Vm and DG CSD activity for all cells in Figure 3. Neurons in CA3 exhibit negative correlations in contrast to DG and CA1, with the absolute values of the correlations similar across the subfields.
- Was the high coherence between DG CSD magnitude and CA3 Vm specific to these slow oscillatory periods or a more general feature of the DG/CA3 functional coupling. For example, was it also observed during theta/movement periods?
Figure 2 - figure supplement 1 reports the coherence of all cells across the subfields with rectified DG CSD over the entire recording duration. Mice do not perform any tasks during the recordings so periods of immobility and quiet wakefulness comprise the majority of the recording session and are the focus of our analysis. During some occasional theta periods there is increased coherence in the theta frequency band (figure R4).
- Fig. 6 shows depolarization and increase firing in DGCs up to 150 ms prior to ripple onset. However, ripples sometime occur in bursts with one ripple following others. Could such phenomenon explain the firing prior to ripples? (which would in fact correspond to firing during a previous ripple). What is the behavior of firing rate and Vm of different cells types if analysis is restricted to isolated ripples? This analysis is notably important in CA3 where feedback inhibition following a first ripple could lead to hyperpolarization « during » the next ripple.
We added a new figure (Figure 7 - figure supplement 2) that compares Vm aligned to the onset of isolated single ripples vs. ripple doublets. The pre-ripple depolarization in DG and CA1 is similar for isolated ripples and ripple doublets arguing against the hypothesis that pre-ripple responses are a reflection of ripple bursts.
-
Evaluation Summary:
This study uses dual intracellular and extracellular recordings in different subfields of the hippocampus in awake mice during immobility to investigate the initiation of sharp wave-ripples, synchronous bursts of hippocampal activity thought to be important for memory formation. It provides unique data obtained in vivo across a diversity of hippocampal cell types. Specifically, these findings lead to a model where inhibition of CA3 pyramidal cells is permissive to ripple generation.
(This preprint has been reviewed by eLife. We include the public reviews from the reviewers here; the authors also receive private feedback with suggested changes to the manuscript. Reviewer #1 and Reviewer #3 agreed to share their name with the authors.)
-
Reviewer #1 (Public Review):
This is a very interesting paper describing membrane potential dynamics of hippocampal principal cells during UP/DOWN transitions and sharp-wave ripples. Using whole-cell in combination with linear LFP recordings in head-fixed awake mice, the authors show striking differences of membrane potential responses in principal cells from the dentage gyrus, CA3 and CA1 sectors. The authors propose that switches between a dominant inhibitory excitable state and a disinhibited non-excitable state control the intra-hippocampal dynamics during UP/DOWN transitions.
Obtaining intracellular recordings in vivo is commendable. The authors provide valuable data and analysis. While data show clear trends and some of the conclusions are well supported, the authors may need to clarify the following potential confounds, which can …
Reviewer #1 (Public Review):
This is a very interesting paper describing membrane potential dynamics of hippocampal principal cells during UP/DOWN transitions and sharp-wave ripples. Using whole-cell in combination with linear LFP recordings in head-fixed awake mice, the authors show striking differences of membrane potential responses in principal cells from the dentage gyrus, CA3 and CA1 sectors. The authors propose that switches between a dominant inhibitory excitable state and a disinhibited non-excitable state control the intra-hippocampal dynamics during UP/DOWN transitions.
Obtaining intracellular recordings in vivo is commendable. The authors provide valuable data and analysis. While data show clear trends and some of the conclusions are well supported, the authors may need to clarify the following potential confounds, which can actually impact their conclusions and interpretation:
1- All the analysis is based in z-scored membrane potential responses but the mean resting membrane potential is never reported. For DG granule cells recorded in awake conditions, the membrane potential is usually hyperpolarized so that most of the effect may be due to reversed GABAa mediated currents. Similarly, for those cells exhibiting the non-expected polarization during UP/DOWN states there may be drifts around reversal potentials explaining their behavior. Moreover, regional trends on passive and active membrane parameters and connectivity can actually explain part of the variability. A longitudinal comparison of state Vm and spikes in fig.5 suggests that some of the largest depolarized responses are not correlated with firing. Authors should evaluate this angle, ideally showing the distribution of membrane potential values across cells and regions and confronting this with the different membrane potential responses.
2- While there are some trends for each hippocampal regions, there is also individual variability across cells during UP/DOWN transitions (fig.5) and near ripples (fig.6). What part of this variability can be explained by proximodistal and/or deep-superficial differences of cell location and identity? Can authors provide some morphological validation, even if in only a subset of cells? For CA3, proximodistal heterogeneity for intrinsic properties and entorhinal input responses are well documented in intracellular recordings both in vitro and in vivo. What is the location of CA3 cell contributing to this study? For CA1 cells, deep-superficial trends of GABAergic perisomatic inhibition and connectivity with input pathways dominate firing responses. Regarding DG cells, are all they from the upper blade?
3- AC-coupled LFP recordings cannot provide unambiguous identification of the sign of phasic CSD signals, because fluctuations accompanying UP/DOWN states alter the baseline reference. This is actually the case, given changes of membrane potential accompanying UP/DOWN transitions. I recommend reading Brankack et al. 1993 doi: 10.1016/0006-8993(93)90043-m. The authors should acknowledge this limitation and discuss how it could influence their results. One potential solution to get rid of this effect is using principal/independent component analysis for blind source separation.
-
Reviewer #2 (Public Review):
In this manuscript "Inhibition is the hallmark of CA3 intracellular dynamics around awake ripples" the authors obtained Vm recordings from CA1, CA3 and DG neurons while also obtaining local field potentials across the CA1 and DG layers. This enabled them to identify periods of up and down state transitions, and to detect sharp-wave ripples (SWRs). Using these data, they then came to the conclusion that compared to CA1 and DG, the Vm of more CA3 neurons is hyperpolarized at the approximate time of SWRs.
Unfortunately, for the following reasons, the current manuscript does not necessarily support this conclusion:
Recordings are obtained in mice who are recently (same day) recovering from craniotomy surgery/anesthesia and have no training on head fixation. This means that the behavioral state is abnormal, and …
Reviewer #2 (Public Review):
In this manuscript "Inhibition is the hallmark of CA3 intracellular dynamics around awake ripples" the authors obtained Vm recordings from CA1, CA3 and DG neurons while also obtaining local field potentials across the CA1 and DG layers. This enabled them to identify periods of up and down state transitions, and to detect sharp-wave ripples (SWRs). Using these data, they then came to the conclusion that compared to CA1 and DG, the Vm of more CA3 neurons is hyperpolarized at the approximate time of SWRs.
Unfortunately, for the following reasons, the current manuscript does not necessarily support this conclusion:
Recordings are obtained in mice who are recently (same day) recovering from craniotomy surgery/anesthesia and have no training on head fixation. This means that the behavioral state is abnormal, and the animal may have residual anesthesia effects.
Most of the paper is dedicated to dynamics around up-down state transitions, not focused on ripples.
Vm should be examined raw first, then split into fast and slow -the cell lives with the raw Vm.
While some (assumed) CA3 principal cells were hyperpolarized around the time of ripples, saying inhibition is the hallmark of CA3 dynamics around ripples is an exaggeration, especially because it does not seem mechanistically tied to anything else.
The use of ripple onset time is questionable, since the detected onset of the ripple depends on the detector settings, amplifier signal-to-noise ratio, etc. The best and most widely used (including by a subset of these authors) metric is the ripple peak time.
There is not enough raw data (or quality metrics) shown to judge the quality of the data, especially for the whole cell recordings. For instance what was the input resistance of the neurons? Was the access resistance constant?
There is not enough explanation regarding why the reported results on the spiking of CA1 and CA3 neurons in SWRs is so different than previously published. In general, whole cell recording is not the most reliable way to record spike timing, and the presented whole cell data differ from previously published juxtacellular and extracellular recording methods, which better preserve physiological spiking activity.
The number of neurons from each area is not reported.
There is no verification of cell type so it is inappropriate to assume that all neurons are the principal neurons.
Are the fluctuations in the CA3 Vm generally smaller than for CA1 and DG because of physiology or technical reasons?
-
Reviewer #3 (Public Review):
During slow wave sleep and quiet immobility, communication between the hippocampus and the neocortex is thought to be important for memory formation notably during periods of hippocampal synchronous activity called sharp-wave ripple events. The cellular mechanisms of sharp-wave ripple initiation in the hippocampus are still largely unknown, notably during awake immobility. In this paper, the authors addressed this question using patch-clamp recordings of principal cells in different hippocampal subfields (CA3, CA1 and the dentate gyrus) combined with extracellular recordings in awake head-fixed mice as well as computer modeling. Using the current source density (CSD) profile of local field potential (LFP) recordings in the molecular layer of the dentate gyrus as a proxy of UP/DOWN state activity in the …
Reviewer #3 (Public Review):
During slow wave sleep and quiet immobility, communication between the hippocampus and the neocortex is thought to be important for memory formation notably during periods of hippocampal synchronous activity called sharp-wave ripple events. The cellular mechanisms of sharp-wave ripple initiation in the hippocampus are still largely unknown, notably during awake immobility. In this paper, the authors addressed this question using patch-clamp recordings of principal cells in different hippocampal subfields (CA3, CA1 and the dentate gyrus) combined with extracellular recordings in awake head-fixed mice as well as computer modeling. Using the current source density (CSD) profile of local field potential (LFP) recordings in the molecular layer of the dentate gyrus as a proxy of UP/DOWN state activity in the entorhinal cortex they report the preferential occurrence of sharp-wave ripple (recorded in area CA1) during UP states with a higher probability toward the end of the UP state (unlike eye blinks which preferentially occur during DOWN states). Patch-clamp recordings reveal that a majority of dentate granule cells get depolarized during UP state while a majority of CA3 pyramidal cells get hyperpolarized and CA1 pyramidal cells show a more mixed behavior. Closer examination of Vm behavior around state transitions revealed that CA3 pyramidal cells are depolarized and spike at the DOWN/UP transition (with some cells depolarizing even earlier) and then progressively hyperpolarize during the course of the UP state while DGCs and CA1 pyramidal cells tend to depolarize and fire throughout the UP state. Interestingly, CA3 pyramidal cells also tend to be hyperpolarized during ripples (except for a minority of cells that get depolarized and could be instrumental in ripple generation), while DGCs and CA1 pyramidal cells tend to be depolarized and fire. The strong activation of dentate granule cells during ripples is particularly interesting and deserves further investigations. The observation that the probability of ripple occurrence increases toward the end of the UP state, when CA3 pyramidal cells are maximally hyperpolarized, suggests that the inhibitory state of the CA3 hippocampal network could be permissive for ripple generation possibly by de-inactivation of voltage-gated channels thus increasing their excitability (i.e. ability to get excited). Altogether, these results confirm previous work on the impact of slow oscillations on the membrane potential of hippocampal neurons in vivo under anesthesia but also point to specificities possibly linked to the awake state. They also invite to revisit previous models derived from in vitro recordings attributing synchronous activity in CA3 to a global build-up of excitatory activity in the network by suggesting a role for Vm hyperpolarization in preserving the excitability of the CA3 network.
In light of recent report of heterogeneity within hippocampal cell types (and notably description of a new CA3 pyramidal cell type instrumental for sharp-wave ripple generation) (Hunt et al., 2018), the small minority of CA3 pyramidal cells depolarized during ripples deserve more attention. These cells are indeed likely key in the generation of sharp wave ripple. Several analyses could be performed in order to decipher whether they have specific intrinsic properties (baseline Vm, firing threshold, burst propensity), whether they are located in specific sub-areas of CA3 (a versus b, deep versus superficial) and whether they are distinctively modulated during UP/DOWN states.
The authors use CSD analysis in the DG as a proxy of synaptic inputs coming from the EC to define alternating periods of UP and DOWN states. I have few questions concerning this procedure: 1- It is unclear if only periods when animals was still/immobile were analyzed. 2- How coherent were these periods with slow oscillations recorded in the cortex (which are also recorded with the linear probe?).
3- How long did these periods last? Did they occur during classically described hippocampal states (LIA/SIA) or do they correspond to a different state (Wolansky et al., J Neurosci 2006).To better characterize hippocampal CSD profiles around ripples and UP/Down states transitions, could you plot ripple and UDS transition-triggered average CSD profiles across hippocampal subfields?
The duration of UP states appears longer than that reported in anesthetized animals. To ascertain this fact could the authors quantify and report mean UP and DOWN states durations? Shorter DOWN states would decrease the probability to detect ripple. Could the authors correct for this bias in their analysis of ripple occurrence during UP and DOWN states?
The authors report a high coherence between the Vm of an example CA3 pyramidal cells and UP/DOWN state in DG. Was it a general property of a majority of CA3 pyramidal cells? The coherence values should be reported for all CA3 pyramidal cells.
Was the high coherence between DG CSD magnitude and CA3 Vm specific to these slow oscillatory periods or a more general feature of the DG/CA3 functional coupling. For example, was it also observed during theta/movement periods?
Fig. 6 shows depolarization and increase firing in DGCs up to 150 ms prior to ripple onset. However, ripples sometime occur in bursts with one ripple following others. Could such phenomenon explain the firing prior to ripples? (which would in fact correspond to firing during a previous ripple). What is the behavior of firing rate and Vm of different cells types if analysis is restricted to isolated ripples? This analysis is notably important in CA3 where feedback inhibition following a first ripple could lead to hyperpolarization « during » the next ripple.
-
