First-principles model of optimal translation factors stoichiometry
Curation statements for this article:-
Curated by eLife

Evaluation Summary:
This paper presents a theoretical analysis of the abundance of components of the translation machinery (ribosomes, initiation, elongation and release factors, tRNA synthetases) in bacteria. These proteins make up a large fraction of the total proteome and their abundance is closely linked to cell growth. That the stoichiometry of the different components is adjusted such as to maximize the growth rate has been postulated a long time ago, but was so far only studied in detail for ribosomes and EF-Tu, the most abundant elongation factor. Here, the authors extend these earlier works to an unprecedented level of detail and provide a complete analysis based on this idea and derive the optimal stoichiometry for all these factor, which they find to be in good agreement with the observed abundance in different bacteria. This provides new evidence supporting the idea of proteome optimization for maximal growth.
(This preprint has been reviewed by eLife. We include the public reviews from the reviewers here; the authors also receive private feedback with suggested changes to the manuscript. Reviewer #1 and Reviewer #3 agreed to share their names with the authors.)
This article has been Reviewed by the following groups
Discuss this preprint
Start a discussion What are Sciety discussions?Listed in
- Evaluated articles (eLife)
Abstract
Enzymatic pathways have evolved uniquely preferred protein expression stoichiometry in living cells, but our ability to predict the optimal abundances from basic properties remains underdeveloped. Here, we report a biophysical, first-principles model of growth optimization for core mRNA translation, a multi-enzyme system that involves proteins with a broadly conserved stoichiometry spanning two orders of magnitude. We show that predictions from maximization of ribosome usage in a parsimonious flux model constrained by proteome allocation agree with the conserved ratios of translation factors. The analytical solutions, without free parameters, provide an interpretable framework for the observed hierarchy of expression levels based on simple biophysical properties, such as diffusion constants and protein sizes. Our results provide an intuitive and quantitative understanding for the construction of a central process of life, as well as a path toward rational design of pathway-specific enzyme expression stoichiometry.
Article activity feed
-

-

Author Response:
Reviewer #1:
The manuscript by Lalanne and Li aims to provide an intuitive and quantitative understanding of the expression of translation factors (TFs) from first principles. The authors first find that the steady-state solutions for translation sub-processes are largely independent at optimality. With a coarse-grained model, the authors derive the optimal expression of translation factors for all important sub-processes. The authors show that intuitive scaling factors can explain the differential expression of translation factors.
The results are impressive. However, as detailed in the major comments, the choice of some important parameters is not sufficiently justified in the current version. In particular, it is not clear to what extent parameter choice and rescaling was biased toward achieving a good agreement …
Author Response:
Reviewer #1:
The manuscript by Lalanne and Li aims to provide an intuitive and quantitative understanding of the expression of translation factors (TFs) from first principles. The authors first find that the steady-state solutions for translation sub-processes are largely independent at optimality. With a coarse-grained model, the authors derive the optimal expression of translation factors for all important sub-processes. The authors show that intuitive scaling factors can explain the differential expression of translation factors.
The results are impressive. However, as detailed in the major comments, the choice of some important parameters is not sufficiently justified in the current version. In particular, it is not clear to what extent parameter choice and rescaling was biased toward achieving a good agreement with the experimental data.
Major comments:
- The work assumes that reaction times per TF are constant. That may be true at the highest growth rates, but it might not hold for conditions with lower growth rates. The data of Schmidt et al. (Nat. Biotechnol. 34, 104 (2016)) would allow to compare the predictions to proteome partitioning in E. coli across growth rates. It is ok to restrict the present work to maximal growth rates, but then this caveat should be made explicit. This last point also concerns ignoring the offset in the bacterial growth laws, which is only permissible at fast growth; that also should be stated more prominently in the manuscript; see also the legend of Fig. 1, "Our framework of flux optimization under proteome allocation constraint addresses what ribosome and translation factor abundances maximize growth rate".
We see two distinct but related points made by the reviewer, which we address in turn.
First, we thank the reviewer for highlighting the important and interesting point of the growth rate dependence of expression in components of the translational machinery, which encouraged us to investigate this aspect further. Leveraging other existing ribosome profiling datasets (which provide better quantitation than mass spectrometry data, see response to minor point #6 below) across multiple growth conditions and species, we compared the predicted optimal translation factor abundance in these conditions (using same formula for the optima). The new conditions and species now include E. coli at much slower growth rates, C. crescentus in two different media, and others. We found similar degrees of agreement between predicted and observed levels (shown in Figure 4-Figure supplement 1 ). One exception is aaRS in C. crescentus, and the discrepancy likely arises from a lack of quantification of tRNA abundance which is a parameter we use to predict the optimal aaRS levels.
These additional data also provided another way to examine the model predictions. Specifically, we assessed the predicted square-root scaling of translation factor abundance with growth rate. While the expression stoichiometry remains constant across growth rates (see response to minor point #6 below), the overall abundance decreases following our predicted scaling (Figure 4-Figure supplement 2B). We now describe these new analyses and results in the main text (p. 7, line 216):
"Analysis of tlF expression across slower growth conditions supports the derived square root dependence (Figure 4-Figure supplement 2)."
The second point made by the reviewer pertains to the “offset in bacterial growth law” that corresponds to inactive ribosomes, which make up a substantial fraction of ribosomes at very slow growth rates. We note that the derivation of the optimality condition, equation 5, does not rely on all ribosomes being active. What is necessary is that that there is a direct proteomic trade-off between ribosomes and translation factors (see response to minor point 1 below). To rigorously place our work in the context of previous literature, we have replaced mention of ribosome with “active ribosome” (as well as in equation 1 and Figure 1), which we define as those functionally engaged in the translation cycle. We also formally include the proteome fraction of inactive ribosome in equations 2 and 3 leading to the optimality condition.
- The diffusion-limited regime considers only the free and idle reactants. For some translation factors, the free state only accounts for a small fraction of its total concentration. In this case, the diffusion-limited regime only explains a small fraction of the TFs. For example, most of EF-Ts may not be in its free state: in simulations with in vitro kinetics, free EF-Ts accounts for 6%-48% of its total concentration (Supplementary Data 3 in [21]). Can the authors use in vitro parameters (or other ways) to provide a rough estimate of the fraction of free TFs? Including this might allow to make quantitative statements about some of the deviations seen in Fig. 4, as most of the TFs are underestimated.
We thank the reviewer for the suggestion that deviations between the diffusion-limited prediction and the observed abundance might be quantitatively explained by the finite catalytic activity of the respective factors. However, to do so requires accurate values of kcat, which are often not available. In the Supplement of the initial submission, we provided an example of the in vitro kcat being not compatible with the protein synthesis rates in vivo, which we have now moved to the main text (reproduced below).
Another experimental approach that can feasibly be used to infer the bound fraction of translation factors in live cell is fluorescence microscopy of tagged proteins. Indeed, by quantifying the diffusive states of a tagged EF-Tu protein, Volkov et al (1) could estimate that <10% of EF-Tu was in its bound state, which is consistent with the agreement between our diffusion-limited prediction and observed abundance for that factor.
We now discuss these possibilities and the facts about EF-Ts in a paragraph in the Discussion (p. 13, line 471):
"Our optimization model can also be solved analytically in the non-diffusion-limited regime (Table 2), with the finite catalytic rate leading to an additional contribution of the form ∝ l 𝜆*/kcat. Recent detailed modeling of the EF-Ts cycle (Hu et al., 2020) estimated that a minor fraction (6 to 48%) of its abundance was in the free form in the cell, consistent with the large deviation we observe for this factor from our diffusion only prediction. However, the numerical values for these solutions are in general difficult to obtain because measurements of catalytic rates are sparse and often inconsistent with estimates of kinetics in live cells. As an example, the catalytic rates for aaRSs (Jeske et al., 2019) measured in vitro is ≈3 s-1 (median across different aaRSs), which is well below the minimal value of 15 s-1 required to sustain translation flux at the measured translation elongation rate (Appendix 5), suggesting substantial deviation between in vitro and in vivo kinetics. Although technically demanding, the fraction of free vs. bound factors can in principle be determined through live cell microscopy of tagged factors based on the partitioning the diffusive states of enzymes. Using that approach, (Volkov et al., 2018) estimated that EF-Tu was in its bound state <10% of the time (consistent with the agreement between our diffusion-limited prediction and the observed value for this factor)."
- "A factor-independent time τ_ind (e.g., peptidyl transfer), which does not come into play in our optimization framework, was added to account for additional steps making up the full elongation cycle." - what happened to this time? I couldn't find it anywhere else in the paper. What value was chosen, and by what rationale?
We thank the reviewer for pointing out a lack of clarity in our presentation. The factor-independent time τind in fact did not appear in our optimization procedure at all (by virtue of obeying dτind/d𝜙TFi = 0 by definition), and was only included for generality to account for steps such as peptidyl transferase (extremely fast (2)). In line with the parsimony of our model, and to avoid any confusion, we have now removed this factor from our model and description altogether.
- Fig. 4: The agreement is very impressive, especially given the simplifying assumptions. However, there are some questions relating the choice of parameters.
a) Were any parameters fitted? Which, how? What about τ_ind, for example (see above)?
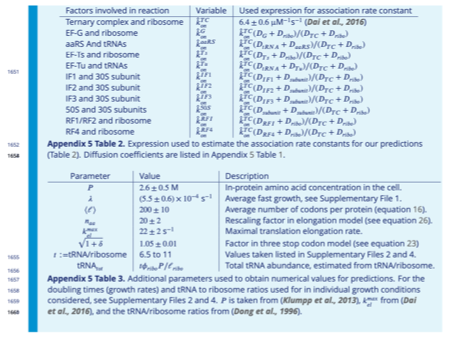
Our approach does not include any fitted parameter. We instead rely on biophysically measured quantities such as diffusion constants, protein sizes, tRNA abundances, cell doubling times (growth rates), and in vivo kinetic estimates. (In the line of Major Comment #3 above, we have removed τind for clarity.) We now include all quantities needed to predict the optimal translation factor abundances (using the formula listed in section “Summary of optimal solutions”, Table 2) in Appendix 5-Tables 1-3, including new Appendix 5-Tables 2-3, reproduced below.
b) The "predicted" value for ribosomes is calculated from observed data (in a way described on p. S34 that I found incomprehensible, and would likely look very similar regardless of the predicted values for the TFs). According to the section "Equipartition between TF and corresponding ribosomes", the corresponding ribosomes can be quantified in the authors' scheme, too, by the method used for deriving optimal TF concentrations in equation 5. Why didn't the authors directly use the sum of these estimations as the optimal ribosome concentration in Fig. 4? In the current state, it does not seem fair to include the ribosome with the other predictions.
We agree that the nature of the prediction for ribosomes was different than for other translation factors in our original manuscript in a way that might have lacked clarity. We now exclude ribosomes from Fig. 4 to avoid any possible confusion.
It is interesting to directly estimate ribosome abundance using the equipartition principle. This estimation is however limited by the fact that the equipartition principle only accounts for ribosomes that are waiting for factor- dependent binding steps. Substantial fractions of ribosomes may be engaged at factor-free steps (e.g., peptidyl transfer catalyzed by ribosome itself) and factor-dependent catalytic steps after binding. Although the latter could be estimated using the observed tlF concentrations (by considering that the tlF in excess to the binding-limited predictions is sequestered in catalytic steps), the former is not estimated in our model. Furthermore, some other ribosomes may not be fully assembled yet or are inactive (3). Indeed, the predicted factor-dependent ribosome abundance using the equipartition principle with observed tlF abundances constitute a fraction (40%) of the measured total ribosome abundance.
c) Predictions are for a specific growth rate (doubling time 21min). Was this growth rate also averaged over the three organisms? What were the individual values? These points would need to be discussed in the main text.
The reviewer is correct. In the initial submission, we used the average growth rate of E. coli (doubling time 21.5±0.4 min), B. subtilis (doubling time 21±1 min), and V. natriegens (doubling time 19±1 min). A note has been added in the main text (p. 11, line 448):
"We take the growth rate 𝜆* to be the average of the fast-growing species considered, corresponding to a doubling time of 21±1 min (E. coli: 21.5±1 min, B. subtilis: 21±1 min, V. natriegens: 19±1 min)."
In addition, we now include predictions for different growth rates and compared them with several bacterial species grown in a wide range of conditions (Figure 4-Figure supplement 1) (see response to Major Comment #1 and to reviewer 2’s third request). These predictions and data are now included in Supplementary Files 1-4.
- In the same vein, in a footnote (!) to Table S4: "#For the ternary complex, the total mass of tRNA+EF-Tu was converted to an equivalent amino acid length." - I can see that this is important to get reasonable results, but it constitutes a major deviation from the strategy proclaimed throughout the main text: that the predicted effects result from a competition for fractions of the limited proteome. That rationale has to be changed (and explained in the main text), or the predictions in Fig. 4 should be based on calculations using only the protein part of TCs (i.e., EF-Tu).
We are sorry for the confusion. The procedure of converting tRNA size to protein size was only used to estimate diffusion coefficients for the ternary complex (described in Appendix 5 Table 2), and not for the competition within the proteome. For factors for which no direct experimental estimates exist for in vivo diffusion coefficient, we used the relationship DA = (lTC/lA)1/3 DTC. The resulting estimated diffusion coefficients were then used to rescale the association rate inferred from in vivo measurements for the ternary complex (see response to point 6 below as well) to obtain association rates for other factors.
- S9: "we anchored our association rates to the estimated in vivo association rate for the ternary complex, 𝑘^𝑇𝐶 = 6.4 μM−1s−1 [13], and rescale the association rate by diffusion of related components" - in comparison, the diffusion limited k^TC is >100. If I understand this correctly, you simply rescale ALL on-rates by 100/6.4 = 15.6. If that is (qualitatively) correct, you would need to discuss this point (and the derivation of the scaling factor) explicitly in the main text.
The reviewer is correct in his interpretation of our approach, and we are grateful for his remark as this led us to spot a mistake in our choice of parameter (capture radius R). Indeed, while the ternary complex as a largest physical dimension of about 10 nm (from structural data (4)), the appropriate capture radius is closer to 2 nm (size of the portion binding to the ribosome) (5). Correcting for the appropriate capture radius alone brings the estimate to 45 μM-1s-1 , which is however still several-fold higher than the measured value of 6.4 μM-1s-1. Whereas a part of this could be due to systematic overestimation of the diffusion coefficient, a large portion of the discrepancy is assuredly due to the many simplifying assumptions underlying the Smoluchowski estimate which serve to place an absolute upper bound on the reaction rate (perfectly/instantaneously absorbing spheres, and hence no notion of specific reaction position or molecular orientation).
The estimate for capture radius R has been corrected (p. 47, line 1605) and a new sentence has now been included in the main text (p. 11, line 441):
"Importantly, the absolute values of the optimal concentrations can be anchored by the association rate constant between TC and the ribosome obtained from translation elongation kinetic measurements in vivo (Dai et al., 2016). The latter was found to be several-fold smaller than the simplest and absolute upper bound of a Smoluchowski estimate of perfectly absorbing spheres (section Estimation of optimal abundances), and we assume that the rescaling factor is the same for all reactions."
-
Evaluation Summary:
This paper presents a theoretical analysis of the abundance of components of the translation machinery (ribosomes, initiation, elongation and release factors, tRNA synthetases) in bacteria. These proteins make up a large fraction of the total proteome and their abundance is closely linked to cell growth. That the stoichiometry of the different components is adjusted such as to maximize the growth rate has been postulated a long time ago, but was so far only studied in detail for ribosomes and EF-Tu, the most abundant elongation factor. Here, the authors extend these earlier works to an unprecedented level of detail and provide a complete analysis based on this idea and derive the optimal stoichiometry for all these factor, which they find to be in good agreement with the observed abundance in different bacteria. This …
Evaluation Summary:
This paper presents a theoretical analysis of the abundance of components of the translation machinery (ribosomes, initiation, elongation and release factors, tRNA synthetases) in bacteria. These proteins make up a large fraction of the total proteome and their abundance is closely linked to cell growth. That the stoichiometry of the different components is adjusted such as to maximize the growth rate has been postulated a long time ago, but was so far only studied in detail for ribosomes and EF-Tu, the most abundant elongation factor. Here, the authors extend these earlier works to an unprecedented level of detail and provide a complete analysis based on this idea and derive the optimal stoichiometry for all these factor, which they find to be in good agreement with the observed abundance in different bacteria. This provides new evidence supporting the idea of proteome optimization for maximal growth.
(This preprint has been reviewed by eLife. We include the public reviews from the reviewers here; the authors also receive private feedback with suggested changes to the manuscript. Reviewer #1 and Reviewer #3 agreed to share their names with the authors.)
-
Reviewer #1 (Public Review):
The manuscript by Lalanne and Li aims to provide an intuitive and quantitative understanding of the expression of translation factors (TFs) from first principles. The authors first find that the steady-state solutions for translation sub-processes are largely independent at optimality. With a coarse-grained model, the authors derive the optimal expression of translation factors for all important sub-processes. The authors show that intuitive scaling factors can explain the differential expression of translation factors.
The results are impressive. However, as detailed in the major comments, the choice of some important parameters is not sufficiently justified in the current version. In particular, it is not clear to what extent parameter choice and rescaling was biased toward achieving a good agreement with …
Reviewer #1 (Public Review):
The manuscript by Lalanne and Li aims to provide an intuitive and quantitative understanding of the expression of translation factors (TFs) from first principles. The authors first find that the steady-state solutions for translation sub-processes are largely independent at optimality. With a coarse-grained model, the authors derive the optimal expression of translation factors for all important sub-processes. The authors show that intuitive scaling factors can explain the differential expression of translation factors.
The results are impressive. However, as detailed in the major comments, the choice of some important parameters is not sufficiently justified in the current version. In particular, it is not clear to what extent parameter choice and rescaling was biased toward achieving a good agreement with the experimental data.
Major comments:
The work assumes that reaction times per TF are constant. That may be true at the highest growth rates, but it might not hold for conditions with lower growth rates. The data of Schmidt et al. (Nat. Biotechnol. 34, 104 (2016)) would allow to compare the predictions to proteome partitioning in E. coli across growth rates. It is ok to restrict the present work to maximal growth rates, but then this caveat should be made explicit. This last point also concerns ignoring the offset in the bacterial growth laws, which is only permissible at fast growth; that also should be stated more prominently in the manuscript; see also the legend of Fig. 1, "Our framework of flux optimization under proteome allocation constraint addresses what ribosome and translation factor abundances maximize growth rate".
The diffusion-limited regime considers only the free and idle reactants. For some translation factors, the free state only accounts for a small fraction of its total concentration. In this case, the diffusion-limited regime only explains a small fraction of the TFs. For example, most of EF-Ts may not be in its free state: in simulations with in vitro kinetics, free EF-Ts accounts for 6%-48% of its total concentration (Supplementary Data 3 in [21]). Can the authors use in vitro parameters (or other ways) to provide a rough estimate of the fraction of free TFs? Including this might allow to make quantitative statements about some of the deviations seen in Fig. 4, as most of the TFs are underestimated.
"A factor-independent time τ_ind (e.g., peptidyl transfer), which does not come into play in our optimization framework, was added to account for additional steps making up the full elongation cycle." - what happened to this time? I couldn't find it anywhere else in the paper. What value was chosen, and by what rationale?
Fig. 4: The agreement is very impressive, especially given the simplifying assumptions. However, there are some questions relating the choice of parameters.
a) Were any parameters fitted? Which, how? What about τ_ind, for example (see above)?
b) The "predicted" value for ribosomes is calculated from observed data (in a way described on p. S34 that I found incomprehensible, and would likely look very similar regardless of the predicted values for the TFs). According to the section "Equipartition between TF and corresponding ribosomes", the corresponding ribosomes can be quantified in the authors' scheme, too, by the method used for deriving optimal TF concentrations in equation 5. Why didn't the authors directly use the sum of these estimations as the optimal ribosome concentration in Fig. 4? In the current state, it does not seem fair to include the ribosome with the other predictions.
c) Predictions are for a specific growth rate (doubling time 21min). Was this growth rate also averaged over the three organisms? What were the individual values?
These points would need to be discussed in the main text.In the same vein, in a footnote (!) to Table S4: "#For the ternary complex, the total mass of tRNA+EF-Tu was converted to an equivalent amino acid length." - I can see that this is important to get reasonable results, but it constitutes a major deviation from the strategy proclaimed throughout the main text: that the predicted effects result from a competition for fractions of the limited proteome. That rationale has to be changed (and explained in the main text), or the predictions in Fig. 4 should be based on calculations using only the protein part of TCs (i.e., EF-Tu).
S9: "we anchored our association rates to the estimated in vivo association rate for the ternary complex, 𝑘^𝑇𝐶 = 6.4 μM−1s−1 [13], and rescale the association rate by diffusion of related components" - in comparison, the diffusion limited k^TC is >100. If I understand this correctly, you simply rescale ALL on-rates by 100/6.4 = 15.6. If that is (qualitatively) correct, you would need to discuss this point (and the derivation of the scaling factor) explicitly in the main text.
-
Reviewer #2 (Public Review):
This paper presents a theoretical analysis of the abundance of components of the translation machinery (ribosomes, initiation, elongation and release factors, tRNA synthetases) in bacteria. These proteins make up a large fraction of the total proteome and their abundance is closely linked to cell growth. That the abundance of these proteins is adjusted such as to maximize the growth rate has been postulated a long time ago, but was so far only studied in detail for ribosomes and EF-Tu, the most abundant elongation factor. Here, the authors provide a complete analysis based on this idea and derive the optimal stoichiometry for all these factor, which they find to be in good agreement with the observed abundance in different bacteria (abundance ratio are conserved between species).
The fundamental idea behind …
Reviewer #2 (Public Review):
This paper presents a theoretical analysis of the abundance of components of the translation machinery (ribosomes, initiation, elongation and release factors, tRNA synthetases) in bacteria. These proteins make up a large fraction of the total proteome and their abundance is closely linked to cell growth. That the abundance of these proteins is adjusted such as to maximize the growth rate has been postulated a long time ago, but was so far only studied in detail for ribosomes and EF-Tu, the most abundant elongation factor. Here, the authors provide a complete analysis based on this idea and derive the optimal stoichiometry for all these factor, which they find to be in good agreement with the observed abundance in different bacteria (abundance ratio are conserved between species).
The fundamental idea behind the line of though used here is that high abundance of all factors increases the protein synthesis flux via the rate of the corresponding step, but also decreases the abundance of other factors or of ribosomes, because of a proteome constraint (basically a finite budget constraint, if more ribosomes/translation resources are used to make one translation factor, fewer ribosomes are available to make the others).
The authors also give an interesting new interpretation to the principle that different factors are equally limiting, which they phrase as these factors taking up the same effective proteome fraction.
A nice feature of their analysis is that the optimal ratios can all be obtained analytically, which provides biophysical interpretations for the quantitative ratios.
Some limitations of the analysis remain, and these are discussed in the paper. The most important one is that the fully quantitative analysis is only possible assuming that all reactions are diffusion limited, so that only minimal information about in vivo kinetics of the reactions is required. Diffusion limitation is not unreasonable and has been assumed in earlier work as well, but is at this point an assumption.
-
Reviewer #3 (Public Review):
The authors provide a reasonable and useful way to coarsegrain complex aspects of translation for finding the optimal TF and ribosome stoichiometry. They provide a relatively simple yet accurate way of finding this optimum. They have also provided good examples of application of their method to find this optimal stoichiometry.
That said, a convincing first-principles-based approach must simultaneously optimize all three proteomic sectors: the metabolic protein sector; the TF sector; and the ribosome sector. The authors' method optimizes the latter two while making the metabolic protein sector follow the experimentally determined scaling with growth rate: φ_P = λ/v (where v is the experimentally obtained nutrient dependent scaling parameter and λ is the growth rate). This scaling parameter is obtained from …
Reviewer #3 (Public Review):
The authors provide a reasonable and useful way to coarsegrain complex aspects of translation for finding the optimal TF and ribosome stoichiometry. They provide a relatively simple yet accurate way of finding this optimum. They have also provided good examples of application of their method to find this optimal stoichiometry.
That said, a convincing first-principles-based approach must simultaneously optimize all three proteomic sectors: the metabolic protein sector; the TF sector; and the ribosome sector. The authors' method optimizes the latter two while making the metabolic protein sector follow the experimentally determined scaling with growth rate: φ_P = λ/v (where v is the experimentally obtained nutrient dependent scaling parameter and λ is the growth rate). This scaling parameter is obtained from systems that are already at the optimal stoichiometry, but the authors' method requires this scaling to hold with the same scaling parameter even when the system is not at optimal stoichiometry. I expect that these three proteomic sectors are interrelated through more than just the scaling with growth rate (the scaling is just the emergent behavior at the optimum), and their effects on each other need to be considered in greater depth when the system is away from the optimum.
Upon simultaneously optimizing all three sectors, it is reasonable to assume that optimal φ_P ultimately will follow the observed scaling (since that is as observed from cells that are assumed to have optimal stoichiometry). Thus, the authors' method seems to involve fixing one of the three sectors at the observed optimum beforehand and then optimizing the other two, thus arriving at partitioning that matches experimental observations. That is, the optimal partitioning of TF and ribosome sector can indeed be calculated accurately, but this require *prior* knowledge of the behavior at optimum of the metabolic protein sector. Similarly, one could take the observed optimum for ribosome sector as given and then try to optimize metabolic protein and TF sectors etc. All these cases are likely to yield the correct optimum stoichiometry, but do not properly answer the question of how all three sectors are simultaneously optimized. Thus, they do not accurately describe the behavior of the system away from the optimum.
Despite these shortcomings, what is reported here is a significant step forward: a way to find the optimal stoichiometry of TFs and ribosomes given the optimal stoichiometry of metabolic proteins. Clarity in acknowledging the challenges in describing the behavior of the system away from the optimum would help. Specifically, the limitations of assuming the optimal stoichiometry of metabolic proteins. Alternately, clear justification for why considering the simultaneous optimization of metabolic protein partitioning is not important or relevant.
-
