Motor planning under uncertainty
Curation statements for this article:-
Curated by eLife

Evaluation Summary:
This study addresses an important debate in the field of motor control: Can motor commands generated under uncertain conditions be better explained as an average of different candidate motor programs, or by a single motor plan that minimizes the expected costs? The paper provides evidence for the latter hypothesis. Previous studies have provided clear evidence against the motor averaging hypothesis, however the present study provides the most elegant and conclusive examination of these two ideas to date. While some of the interpretation, especially of Experiment 2, requires more nuanced consideration, overall we thought the evidence presented supported the key conclusion.
(This preprint has been reviewed by eLife. We include the public reviews from the reviewers here; the authors also receive private feedback with suggested changes to the manuscript. Reviewer #1 agreed to share their name with the authors.)
This article has been Reviewed by the following groups
Discuss this preprint
Start a discussion What are Sciety discussions?Listed in
- Evaluated articles (eLife)
Abstract
Actions often require the selection of a specific goal amongst a range of possibilities, like when a softball player must precisely position her glove to field a fast-approaching ground ball. Previous studies have suggested that during goal uncertainty the brain prepares for all potential goals in parallel and averages the corresponding motor plans to command an intermediate movement that is progressively refined as additional information becomes available. Although intermediate movements are widely observed, they could instead reflect a neural decision about the single best action choice given the uncertainty present. Here we systematically dissociate these possibilities using novel experimental manipulations and find that when confronted with uncertainty, humans generate a motor plan that optimizes task performance rather than averaging potential motor plans. In addition to accurate predictions of population-averaged changes in motor output, a novel computational model based on this performance-optimization theory accounted for a majority of the variance in individual differences between participants. Our findings resolve a long-standing question about how the brain selects an action to execute during goal uncertainty, providing fundamental insight into motor planning in the nervous system.
Article activity feed
-

-

Author Response:
Reviewer #1:
In this paper, Alhussein and Smith set out to determine whether motor planning under uncertainty (when the exact goal is unknown before the start of the movement) results in motor averaging (average between the two possible motor plans) or in performance optimization (one movement that maximizes the probability of successfully reaching to one of the two targets). Extending previous work by Haith et al. with two new, cleanly designed experiments, they show that performance optimization provides a better explanation of motor behaviour under uncertainty than the motor averaging hypothesis.
We thank the reviewer for the kind words.
- The main caveat of experiment 1 is that it rules out one particular extreme version of the movement averaging idea- namely that the motor programs are averaged at the level of …
Author Response:
Reviewer #1:
In this paper, Alhussein and Smith set out to determine whether motor planning under uncertainty (when the exact goal is unknown before the start of the movement) results in motor averaging (average between the two possible motor plans) or in performance optimization (one movement that maximizes the probability of successfully reaching to one of the two targets). Extending previous work by Haith et al. with two new, cleanly designed experiments, they show that performance optimization provides a better explanation of motor behaviour under uncertainty than the motor averaging hypothesis.
We thank the reviewer for the kind words.
- The main caveat of experiment 1 is that it rules out one particular extreme version of the movement averaging idea- namely that the motor programs are averaged at the level of muscle commands or dynamics. It is still consistent with the idea that the participant first average the kinematic motor plans - and then retrieve the associated force field for this motor plan. This idea is ruled out in Experiment 2, but nonetheless I think this is worth adding to the discussion.
This is a good point, and we have now included it in the paper as suggested – both in motivating the need for Expt 2 in the Results section and when interpreting the results of Expt 1 in the Discussion section.
- The logic of the correction for variability between the one-target and two-target trials in Formula 2 is not clear to me. It is likely that some of the variability in the two-target trials arises from the uncertainty in the decision - i.e. based on recent history one target may internally be assigned a higher probability than the other. This is variability the optimal controller should know about and therefore discard in the planning of the safety margin. How big was this correction factor? What is the impact when the correction is dropped ?
Short Answer:
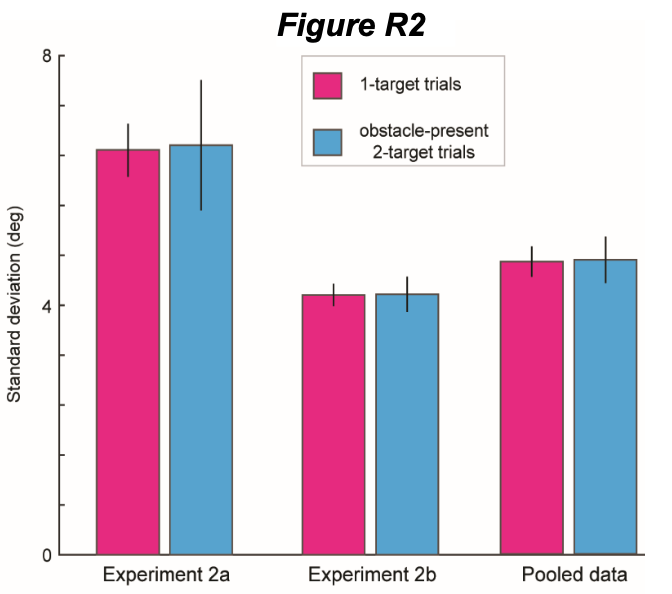
(1) If decision uncertainty contributed to motor variability on 2-target trials as suggested, 2-target trials should display greater motor variability than 1-target trials. However, 1-target and 2-target trials display levels of motor variability that are essentially equal – with a difference of less than 1% overall, as illustrated in Fig R2, indicating that decision uncertainty, if present, has no clear effect on motor variability in our data.
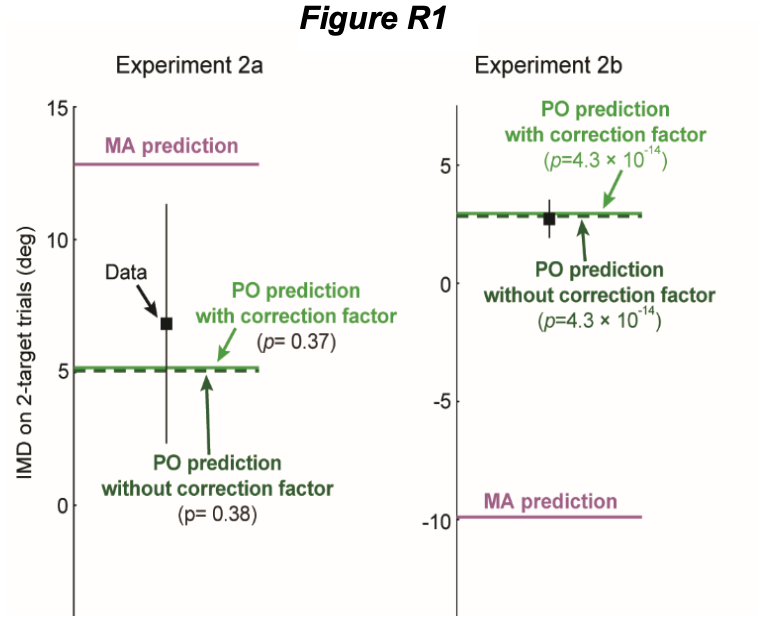
(2) The sigma2/sigma1 correction factor is, therefore, very close to 1, with an average value of 1.00 or 1.04 depending on how it’s computed. Thus, dropping it has little impact on the main result as shown in Fig R1.
Longer, more detailed, answer:
We agree that it could be reasonable to think that if it were true that motor variability on 2-target trials were consistently higher than that on 1-target trials, then the additional variability seen on 2-target trials might result from uncertainty in the decision which should not affect safety margins if the optimal controller knew about this variability. However, detailed analysis of our data suggests that this is not the case. We present several analyses below that flush this out.
We apologize in advance that the response we provide to this seemingly straightforward comment is so lengthy (4+ pages!), especially since capitulating to the reviewer’s assertion that “correction” for the motor variability differences between 1 & 2-target trails should be removed from our analysis, would make essentially no difference in the main result, as shown Fig R1 above. Note that the error bars on the data show 95% confidence intervals. However, taking the difference in motor variability (or more specifically, it’s ratio) between 1-target and 2-target trials into account, is crucial for understanding inter-individual differences in motor responses in uncertain conditions. As this reviewer (and reviewer 2) points out below, we did a poor job of presenting the inter-individual differences analysis in the original version of this paper, but we have improved both the approach and the presentation in the current revision, and we think that this analysis is important, despite being secondary to the main result about the group-averaged findings.
Therefore, we present analyses here showing that it is unlikely that decision uncertainty accounts for the individual-participant variability differences we observe between 1-target and 2-target trials in our experiments (Fig R2). Instead, we show that the variability differences we observe in different conditions for individual participants are due to (largely idiosyncratic) spatial differences in movement direction (Fig R3), which when taken into account, afford a clearly improved ability to predict the size of the safety margins around the obstacles, both in 1-target trials where there is no ‘decision’ to be made (Figs R4-R6) and in 2-target trials (Figs R5-R6).
Variability is, on average, nearly identical on 1-target & 2-target trials, indicating no measurable decision-related increase in variability on 2-target trials
At odds with the idea that decision uncertainty is responsible for a meaningful fraction of the 2-target trial variability that we measure, we find that motor variability on 2-target trials is essentially unchanged from that on one-target trials overall as shown in Fig R2 (error bars show 95% confidence intervals). This is the case for both the data from Expt 2a (6.59±0.42° vs 6.70±0.96°, p > 0.8), and for the critical data from Expt 2b that was designed to dissociate the MA hypothesis from the PO hypothesis (4.23 ±0.17° vs 4.23±0.27°, p > 0.8 for the data from Expt 2b), as well as when the data from Expts 2a-b are pooled (4.78±0.24° vs 4.81±0.35°, p > 0.8). Note that the nominal difference in motor variability between 1-target and 2-target trials was just 1.7% in the Expt 2a data, 0.1% in the Expt 2b data, and 0.6% in the pooled data. This suggests little to no overall contribution of decision uncertainty to the motor variability levels we measured in Expt 2.
Correspondingly, the sigma2/sigma1 ‘correction factor’ (which serves to scale the safety margin observed on 1-target trials up or down based on increased or decreased motor variability on 2-target trials) is close to 1. Specifically, this factor is 1.01±0.13 (mean±SEM) for Expt 2a and 1.04±0.09 for Expt 2b, if measured as mean(sigma2i/sigma1i), where sigma1i and sigma2i are the SDs of the initial movement directions on 1-target and 2-target trials. This factor is 1.02 for Expt 2a and 1.00 for Expt 2b, if instead measured as mean(sigma2i)/mean(sigma1i), and thus in either case, dropping it has little effect on the main population-averaged results for Expt 2 presented in Fig 4b in the main paper. Fig R1 shows versions of the PO model predictions in Fig 4b computed with or without dropping the sigma2/sigma1 ‘correction factor’ that reviewer asks about. These with vs without versions are quite similar for the results from both Expt 2a and Expt 2b. In particular, the comparison between our experimental data and the population-average-based model predictions for the MA vs the PO hypotheses, show highly significant differences between the abilities of the MA and PO models to explain the experimental data in Expt 2b (Fig R1, right panel), whether or not the sigma2/sigma1 correction is included for the comparison between MA and PO predictions (p<10-13 whether or not the sigma2/sigma1 term included, p=4.31×10⁻¹⁴ with it vs p=4.29×10⁻¹⁴ without it). Analogously, for Expt 2a (where we did not expect to show meaningful differences between the MA and PO model predictions), we also find highly consistent results when the sigma2/sigma1 term is included vs not (Fig R1, left panel) (p=0.37 for the comparison between PO and MA predictions with the sigma2/sigma1 term included vs 0.38 without it).
Analysis of left-side vs right-side 1-target trial data indicates the existence of participant-specific spatial patterns of variability.
With the participant-averaged data showing almost identical levels of motor variability on 1-target and 2-target trials, it is not surprising that about half of participants showed nominally greater variability on 1-target trials and about half showed nominally greater variability on 2-target trials. What was somewhat surprising, however, was that 16 of the 26 individual participants in Expt 2b displayed significantly higher variability in one condition or the other at α=0.05 (and 12/26 at α=0.01). Why might this be the case? We found an analogous result when breaking down the 1-target trial data into +30° (right-target) and -30° (left-target) trials that could offer an explanation. Note that the 2-target trial data come from intermediate movements toward the middle of the workspace, whereas the 1-target trial data come from right-side or left-side movements that are directed even more laterally than the +30° or -30° targets themselves (the average movement directions to these obstacle-obstructed lateral targets were +52.8° and -49.0°, respectively, in the Expt 2b data, see Fig 4a in the main paper for an illustration). Given the large separation between 1 & 2-target trials (~50°) and between left and right 1-target trails (~100°), differences in motor variability would not be surprising. The analyses illustrated in Figs R3-R6 show that these spatial differences indeed have large intra-individual effects on movement variability (Fig R3) and, critically, large a subsequent effect on the ability to predict the safety margin observed in one movement direction from motor variability observed at another (Figs R4-R6).
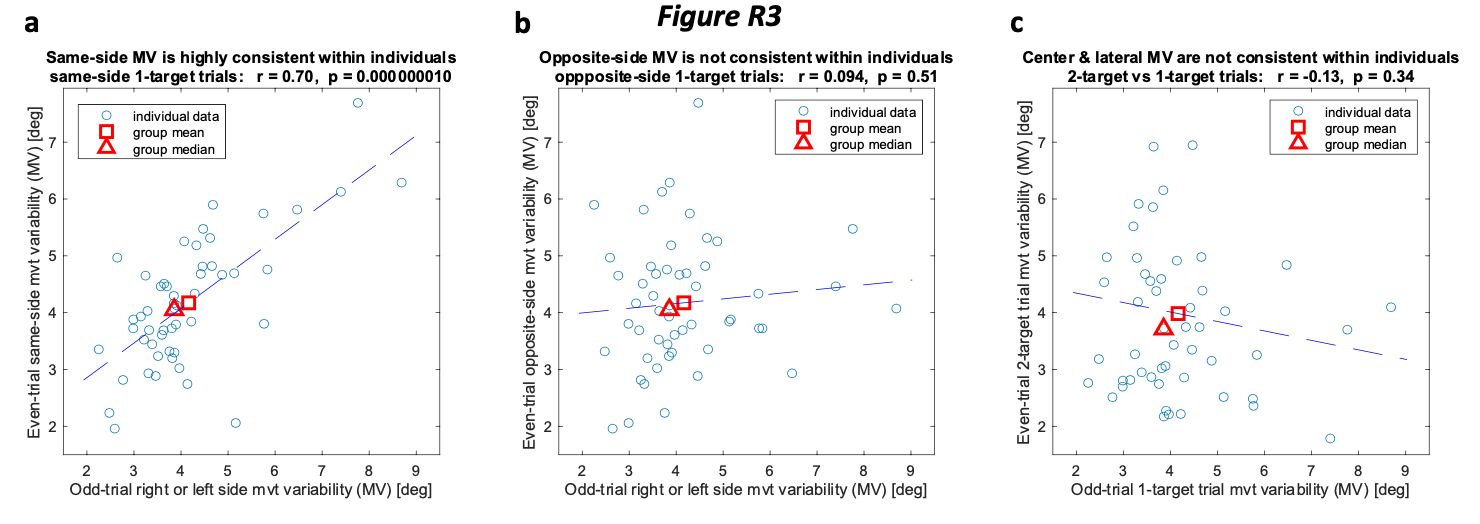
Fig R3 shows evidence for intra-individual direction-dependent differences in motor variability, obtained by looking at the similarity between within-participant spatially-matched (e.g. left vs left or right vs right, Fig R3a) compared to spatially-mismatched (left vs right, Fig R3b) motor variability across individuals. To perform this analysis fairly, we separated the 60 left-side obstacle1-target trial movements for each participant into those from odd-numbered vs even-numbered trials (30 each) to be compared. And we did the same thing for the 60 right-side obstacle 1-target trial movements. Fig R3a shows that there is a large (r=+0.70) and highly significant (p<10-6) across-participant correlation between the variability measured in the spatially-matched case, i.e. for the even vs odd trials from same-side movements, indicating that the measurement noise for measuring movement variability using n=30 movements (movement variability was measured by standard deviation) did not overwhelm inter-individual differences in movement variability.
The strength of this correlation would increase/decrease if we had more/less data from each individual because that would decrease/increase the noise in measuring each individual’s variability. Therefore, to be fair, we maintained the same number of data points for each variability measurement (n=30) for the spatially-mismatched cases shown in Fig R3b and R3c. The strong positive relationship between odd-trial and even-trial variability across individuals that we observed in the spatially-matched case is completely obscured when the target direction is not controlled for (i.e. not maintained) within participants, even though left-target and right-target movements are randomly interspersed. In particular, Fig R3b shows that there remains only a small (r=+0.09) and non-significant (p>0.5) across-participant correlation between the variability measured for the even vs odd trials from opposite-side movements that have movement directions separated by ~100°. This indicates that idiosyncratic intra-individual spatial differences in motor variability are large and can even outweigh inter-individual differences in motor variability seen in Fig R3a. Fig R3c shows that an analogous effect holds between the laterally-directed 1-target trials and the more center-directed 2-target trials that have movement directions separated by ~50°. In this case, the correlation that remains when the target direction is not is maintained within participants, is also near zero (r=-0.13) and non-significant (p>0.3). It is possible that some other difference between 1-target & 2-target trials might also be at play here, but there is unlikely to be a meaningful effect from decision variability given the essentially equal group-average variability levels (Fig R2).
Analysis of left-side vs right-side 1-target trial data indicates that participant-specific spatial patterns of variability correspond to participant-specific spatial differences in safety margins.
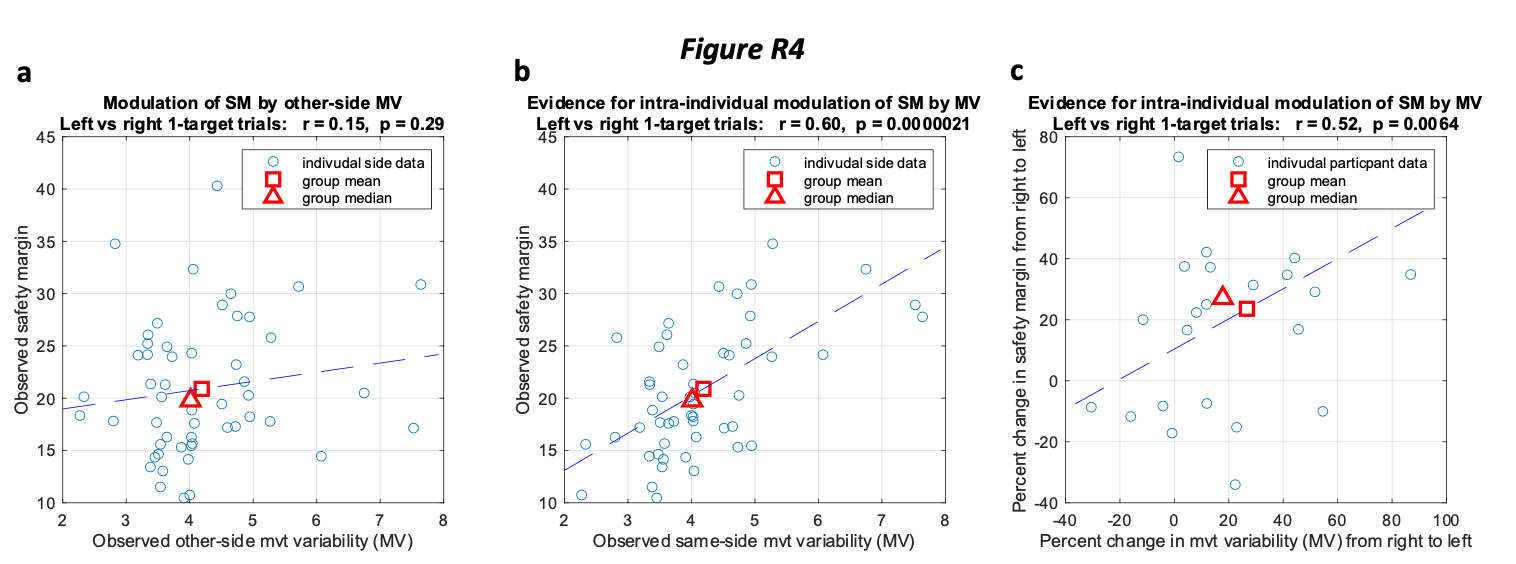
Critically, dissection of the 1-target trial data also shows that the direction-dependent differences in motor variability discussed above for right-side vs left-side movements predict direction-dependent differences in the safety margins. In particular, comparison of panels a & b in Fig R4 shows that motor variability, if measured on the same side (e.g. the right-side motor variability for the right-side safety margin), strongly predicts interindividual differences in safety margin (r=0.60, p<0.00001, see Fig R4b). However, motor variability, if measured on the other side (e.g. the right-side motor variability for the left-side safety margin), fails to predict interindividual differences in safety margin (r=0.15, p=0.29, see Fig R4a). These data show that taking the direction-specific motor variability into account, allows considerably more accurate individual predictions of the safety margins used for these movements. In line with that idea, we also find that interindividual differences in the % difference between the motor variability measured on the left-side vs the right-side predicts inter-individual differences in the % difference between the safety margin measured on the left-side vs the right-side as shown in Fig R4c (r=0.52, p=0.006).
Analyses of both 1-target trial and 2-target trial data indicate that participant-specific spatial patterns of variability correspond to participant-specific spatial differences in safety margins.
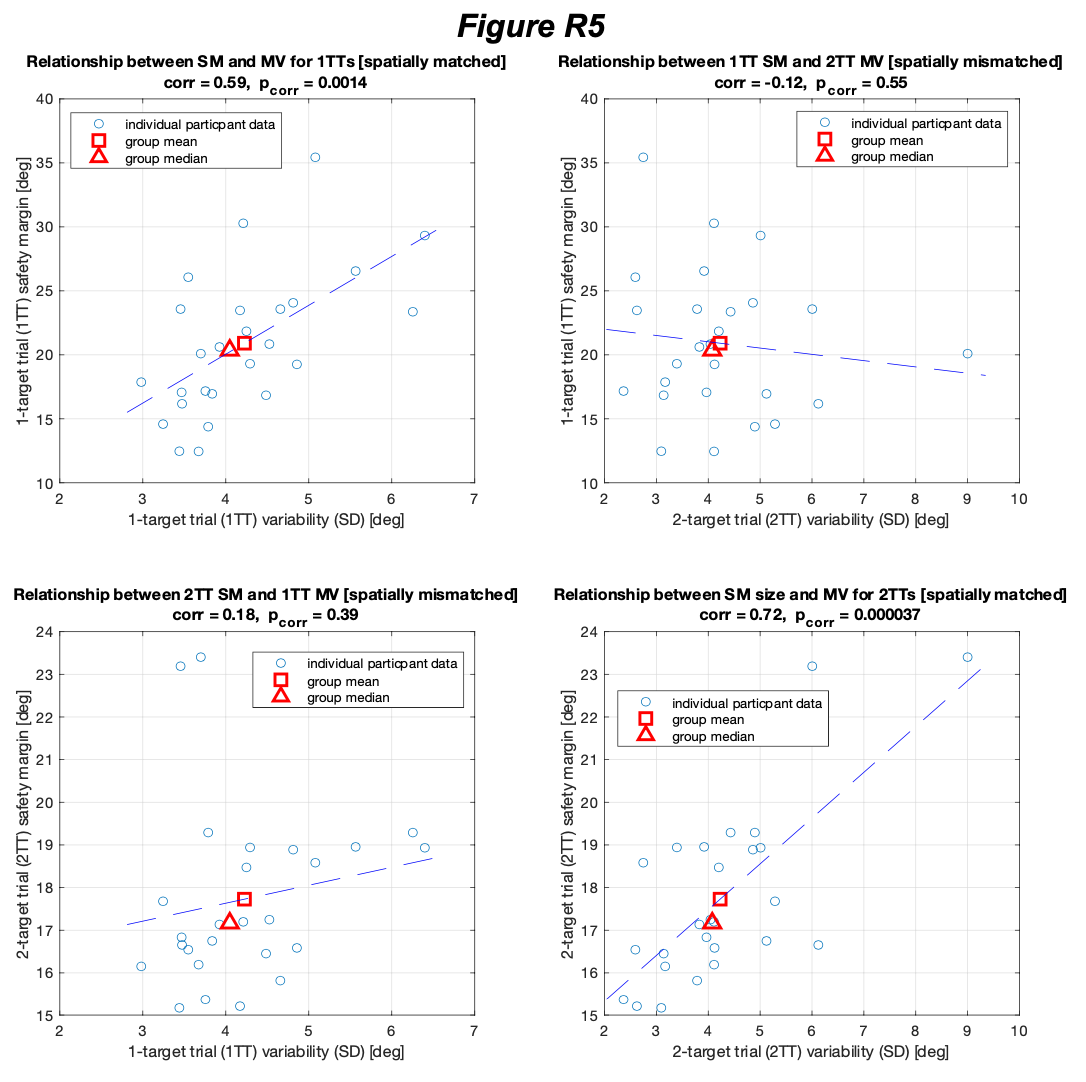
Not surprisingly, the spatial/directional specificity of the ability to predict safety margins from measurements of motor variability observed in the 1-target trial data in Fig R4, is present in the 2-target data as well. Comparison of panels a-d in Fig R5 shows that motor variability from 1-target and 2-target trial data in Expt 2b strongly predict interindividual differences in 1-target and 2-target trial safety margins (r=0.72, p=3x10⁻⁵ for the 2-target trial data (see Fig R5d), r=0.59, p=1x10⁻³ for the 1-target trial data (see Fig R5a)).
This is the case even though the 1-target and 2-target trial data display essentially equal population-averaged levels of motor variability. However, in Expt 2b, motor variability, if measured on 1-target trials fails to predict inter-individual differences in the safety margin on 2-target trials (r=0.18, p=0.39, see Fig R5c), and motor variability, if measured on 2 target trials fails to predict inter-individual differences in the safety margin on 1-target trials (r=-0.12, p=0.55, see Fig R5b). As an aside, note that Fig 5a is similar to 4b in content, in that 1-target trial safety margins are plotted against motor variability levels in both cases. But in 5a, the left and right- target data are averaged whereas in 4b the left and right-target data are both plotted resulting in 2N data points. Also note that the correlations are similar, r=+0.59 vs r=+0.60, indicating that in both cases the amount of motor variability predicts the size of the safety margin.
A final analysis indicating that the spatial specificity of motor variability rather than the presence of decision variability accounts for the ability to predict safety margins is shown in Fig R6. This analysis makes use of the contrast between Expt 2b (where there is a wide spatial separation (51° on average) between 1-target trials and 2-target trials because participants steer laterally around the Expt 2b 1-target trial obstacles, i.e. away from the center), and Expt 2a (where there is only a narrow spatial separation (10.4° on average) between the movement directions of 1-target trials and 2-target trials because participants steer medially around the Expt 2a 1-target trial obstacles, i.e. toward the center). If the spatial specificity of motor variability drove the ability to predict safety margins (and thus movement direction) on 2-target trials, then such predictions should be noticeably improved in Expt 2a compared to Expt 2b, because the spatial match between 1-target trials and 2-target trials is five-fold better in Expt 2a than in Expt2b. Fig R6 shows that this is indeed the case. Specifically, comparison of the 3rd and 4th clusters of bars (i.e. the data on the right side of the plot), shows that the ability to predict 2-target trial safety margins from 1-target trial variability and conversely the ability to predict 1-target trial safety margins from 2-target trial variability are both substantially improved in Expt 2a compared to Expt 2b (compare the grey bars in the 4th vs the 3rd clusters of bars).
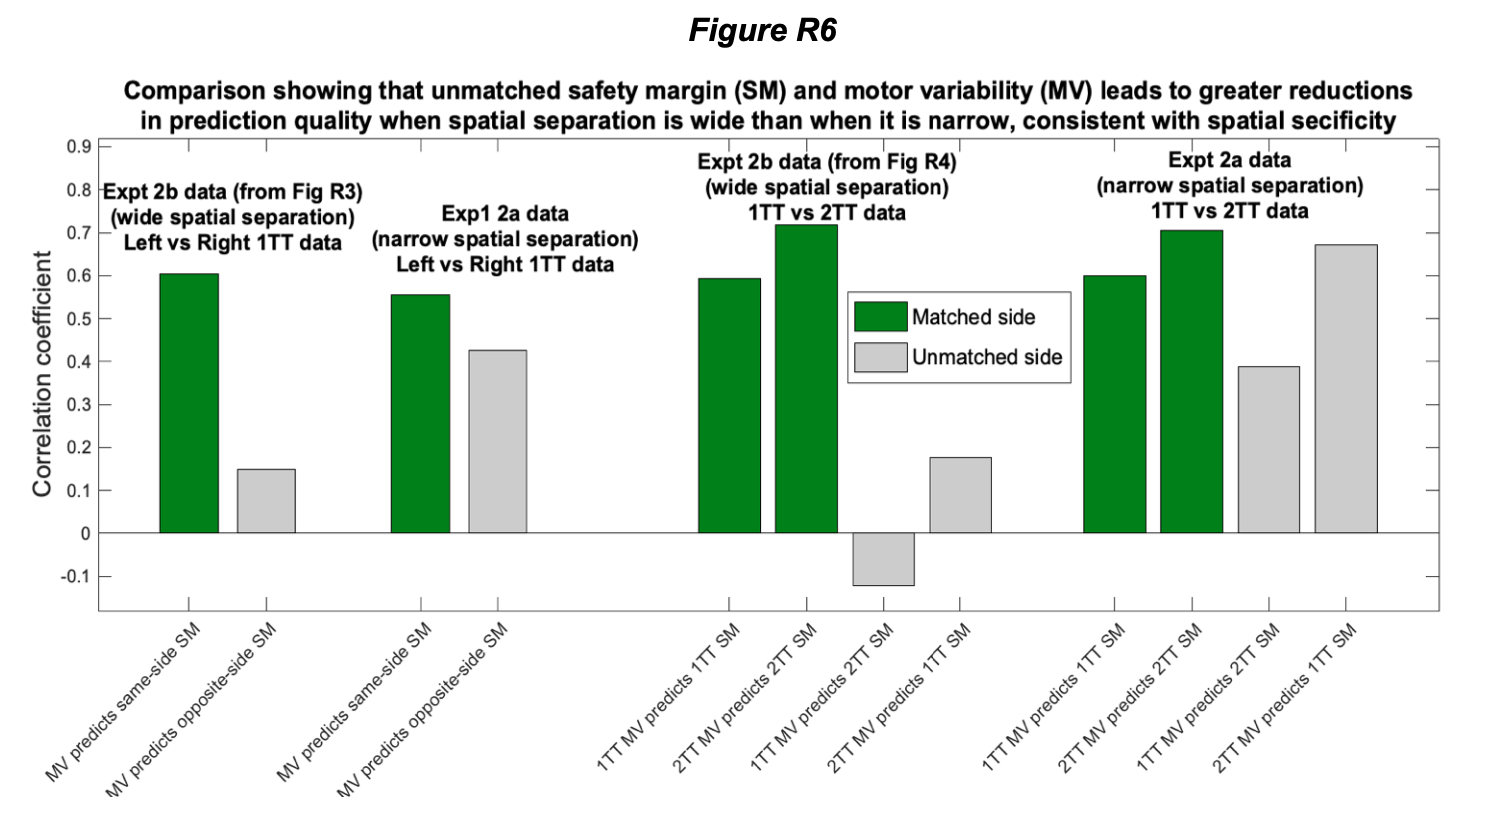
Moreover, comparison of the 1st and 2nd clusters of bars (i.e. the data on the left side of the plot), shows that the ability to predict left 1-target trial safety margins from right 1-target trial variability and conversely the ability to predict right 1-target trial safety margins from left 1-target trial variability are also both substantially improved in Expt 2a compared to Expt 2b (compare the grey bars in the 1st vs the 2nd clusters of bars). This corresponds to a spatial separation between the movement directions on left vs right 1-target trials of 20.7° on average in Expt 2a in contrast to a much greater 102° in Expt 2b.
The analyses illustrated in Figs R4-R6 make it clear that accurate prediction of interindividual differences in safety margins critically depend on spatially-specific information about motor variability, and we have, therefore, included this information for the analyses in the main paper, as it is especially important for the analysis of inter-individual differences in motor planning presented in Fig 5 of the manuscript.
- Equation 3 then becomes even more involved and I believe it constitutes somewhat of a distractions from the main story - namely that individual variations in the safety margin in the 1-target obstacle-obstructed movements should lead to opposite correlations under the PO and MA hypotheses with the safety margin observed in the uncertain 2-target movements (see Fig 5e). Given that the logic of the variance-correction factor (pt 2) remains shaky to me, these analyses seem to be quite removed from the main question and of minor interest to the main paper.
The reviewer makes a good point. We agree that the original presentation made Equation 3 seem overly complex and possibly like a distraction as well. Based on the comment above and a number of comments and suggestions from Reviewer 2, we have now overhauled this content – streamlining it and making it clearer, in both motivation and presentation. Please see section 2.2 in the point-by-point response to reviewer 2 for details.
Reviewer #2:
The authors should be commended on the sharing of their data, the extensive experimental work, the experimental design that allows them to get opposite predictions for both hypotheses, and the detailed of analyses of their results. Yet, the interpretation of the results should be more cautious as some aspects of the experimental design offer some limitations. A thorough sensitivity analysis is missing from experiment 2 as the safety margin seems to be critical to distinguish between both hypotheses. Finally, the readability of the paper could also be improved by limiting the use of abbreviations and motivate some of the analyses further.
We thank the reviewer for the kind words and for their help with this manuscript.
- The text is difficult to read. This is partially due to the fact that the authors used many abbreviations (MA, PO, IMD). I would get rid of those as much as possible. Sometimes, having informative labels could also help FFcentral and FFlateral would be better than FFA and FFB.
We have reduced the number of abbreviations used in the paper from 11 to 4 (Expt, FF, MA, PO), and we thank the reviewer for the nice suggestion about changing FFA and FFB to FFLATERAL and FFCENTER. We agree that the suggested terms are more informative and have incorporated them.
- The most difficult section to follow is the one at the end of the result sections where Fig.5 is discussed. This section consists of a series of complicated analyses that are weakly motivated and explained. This section (starting on line 506) appears important to me but is extremely difficult to follow. I believe that it is important as it shows that, at the individual level, PO is also superior to MA to predict the behavior but it is poorly written and even the corresponding panels are difficult to understand as points are superimposed on each other (5b and e). In this section, the authors mention correcting for Mu1b and correcting for Sig2i/Sig1Ai but I don't know what such correction means. Furthermore, the authors used some further analyses (Eq. 3 and 4) without providing any graphical support to follow their arguments. The link between these two equations is also unclear. Why did the authors used these equations on the pooled datasets from 2a and 2b ? Is this really valid ? It is also unclear why Mu1Ai can be written as the product of R1Ai and Sig1Ai. Where does this come from ?
We agree with the reviewer that this analysis is important, and the previous explanation was not nearly as clear as it could have been. To address this, we have now overhauled the specifics of the context in Figure 5 and the corresponding text – streamlining the text and making it clearer, in both motivation and presentation (see lines 473-545 in the revised manuscript). In addition to the improved text, we have clarified and improved the equations presented for analysis of the ability of the performance optimization (PO) model to explain inter-individual differences in motor planning in uncertain conditions (i.e. on 2-target trials) and have provided more direct graphical support for them. Eq 4 from the original manuscript has been removed, and instead we have expanded our analyses on what was previously Eq 3 (now Eq 5 in the revised manuscript). We have more clearly introduced this equation as a hybrid between using group-averaged predictions and participant-individualized predictions, where the degree of individualization for all parameters is specified with the individuation index 𝑘. For example, a value of 1 for 𝑘 would indicate complete weighting of the individuated model predictors. The equation that follows in the revised manuscript, Eq 6, is a straightforward extension of Eq 5 where each model parameter was instead multiplied by a different individuation index. With this, we now present the partial-R2 statistic associated with each model predictor (see revised Figs 5a and 5e) to elucidate the effect of each. We have, additionally, now plotted the relationships between the each of the 3 model predictors and the inter-individual differences that remain when the other two predictors are controlled (see revised Figs 5b-d and Fig 5f-h). These analyses are all shown separately for each experiment, as per the reviewer’s suggestion, in the revised version of Fig 5.
Overall, this section is now motivated and discussed in a more straightforward manner, and now provides better graphical support for the analyses reported in the manuscript. We feel that the revised analysis and presentation (1) more clearly shows the extent to which inter-individual differences in motor planning can be explained by the PO model, and (2) does a better job of breaking down how the individual factors in the model contribute to this. We sincerely thank the reviewer for helping us to make the paper easier to follow and better illustrated here.
- In experiment 1, does the presence of a central target not cue the participants to plan a first movement towards the center while such a central target was never present in other motor averaging experiment.
Unfortunately, the reviewer is mistaken here, as central target locations were present in several other experiments that advocated for motor averaging which we cite in the paper. The central target was not present on any 2-target trials in our experiments, in line with previous work. It was only present on 1-target center-target trials.
In the adaptation domain, people complain that asking where people are aiming would induce a larger explicit component. Similarly, one could wonder whether training the participants to a middle target would not induce a bias towards that target under uncertainty.
Any “bias” of motor output towards the center target would predict an intermediate motor output which would favor neither model because our experiment designs result in predictions for motor output on different sides of center for 2-target trials in both Expt 1 and Expt 2b. Thus we think any such effect, if it were to occur, would simply reduce the amplitude of the result. However, we found an approximately full-sized effect, suggesting that this is not a key issue.
- The predictions linked to experiment 2 are highly dependent on the amount of safety margin that is considered. While the authors mention these limitations in their paper, I think that it is not presented with enough details. For instance, I would like to see a figure similar to Fig.4B when the safety margin is varied.
We apologize for any confusion here. The reviewer seems to be under the impression that we can specifically manipulate safety margins around the obstacle in making model predictions for experiment 2. This is, however, not the case for either of the two safety margins in the performance-optimization (PO) modelling. Let us clarify. First, the safety margin on 1-target trials, which serves as input to the PO model, is experimentally measured on obstacle-present 1-target trials, and thus cannot be manipulated. Second, the predicted safety margin on 2-target trials is the output of the PO model and thus cannot be manipulated. There is only one parameter in the main PO model (the one for making the PO prediction for the group-average data presented in Fig 4b, see Eq 4), and that is the motor cost weighting coefficient (𝛽). 𝛽 is implicitly present in Eq 2 as well, fixed at 1/2 in this baseline version of the PO model. It is of course true that changing the motor cost weighting will affect the model output (the predicted 2-trial safety margin), but we do not think that the reviewer is referring to that here, since he or she asks about that directly in section 2.4.4 and in section 2.4.6 below, where we provide the additional analysis requested.
For exp1, it would be good to demonstrate that, even when varying the weight of the two one-target profiles for motor averaging, one never gets a prediction that is close to what is observed.
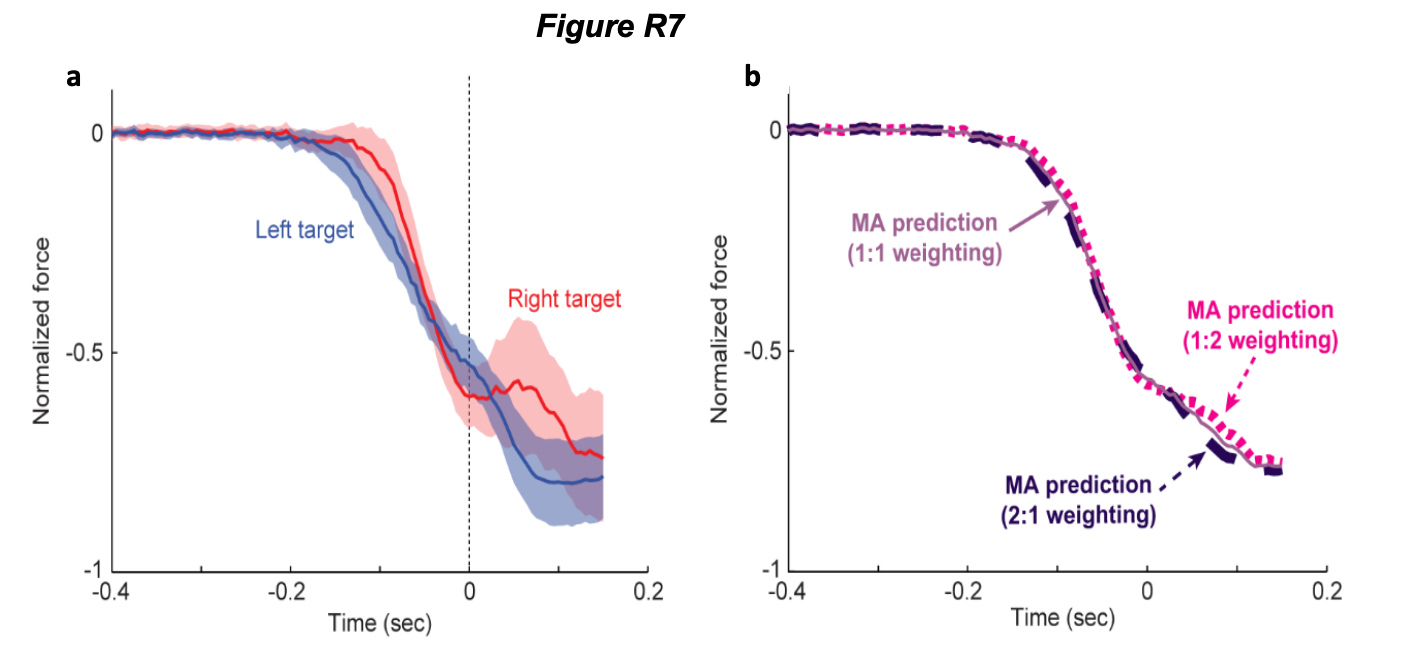
Here the reviewer is referring an apparent inconsistency between our analysis of Expts 1 and 2, because in Expt 2 (but not in Expt 1) we examine the effect of varying the relative weight of the two 1-target trials for motor averaging. However, we only withheld this analysis in Expt 1 because it would have little effect. Unlike Expt 2, the measured motor output on left and right 1-target trials in Expt 1 is remarkably similar (see the left panel in Fig R7a below (which is based on Fig 2b from the manuscript)). This is because left and right 1-target trials in Expt 1 were adapted to the same FF perturbation ( FFLATERAL in both cases), whereas left and right 1-target trials in Expt 2 received very different perturbation levels, because one of these targets was obstacle-obstructed and the other was not. Therefore, varying the relative weightings in Expt 1 would have little effect on the MA prediction as shown in Fig R7b at right. We now realize that is point was not explained to readers, and we have now modified the text in the results section where the analysis of Expt 1 is discussed in order to include a summary of the explanation offered above. We thank the reviewer for surfacing this.
It is unclear in the text that the performance optimization prediction simply consists of the force-profile for the center target. The authors should motivate this choice.
We’re a bit unclear about this comment. This specific point is addressed in the first paragraph under the Results section, the second paragraph under the subsection titled “Adaptation to novel physical dynamics can elucidate the mechanisms for motor planning under uncertainty”, the Figure 2 captions, and in the second paragraph under the subsection titled “Adaptation to a multi-FF environment reveals that motor planning during uncertainty occurs via performance-optimization rather than motor averaging”. Direct quotes from the original manuscript are below:
Line 143: “However, PO predicts that these intermediate movements should be planned so that they travel towards the midpoint of the potential targets in order to maximize the probability of final target acquisition. This would, in contrast to MA, predict that intermediate movements incorporate the learned adaptive response to FFB, appropriate for center-directed movements, allowing us to decisively dissociate PO from MA.”
Line 200: “In contrast, PO would predict that participants produce the force pattern (FFB) appropriate for optimizing the planned intermediate movement since this movement maximizes the probability of successful target acquisition5,34 (Fig 1d, right).”
Line 274: “The 2-target trial MA prediction corresponds to the average of the force profiles (adaptive responses) associated with the left and right 1-target EC trials plotted in Fig 2b, whereas the 2-target trial PO prediction corresponds to the force profile associated with the center target plotted in Fig 2b, as this is appropriate for optimizing a planned intermediate movement.”
For the second experiment 2, the authors do not present a systematic sensitivity analysis. Fig. 5a and d is a good first step but they should also fit the data on exp2b and see how this could explain the behavior in exp 2a. Second, the authors should present the results of the sensitivity analysis like they did for the main predictions in Fig.4b.
We thank the reviewer for these suggestions. We have now included a more-complete analysis in Fig R8 below, and presented it in the format of Fig 4b as suggested. Please note that we have included the analysis requested above in a revised version of Fig 4b in the manuscript, and ta related analysis requested in section 2.4.6 in the supplementary materials.
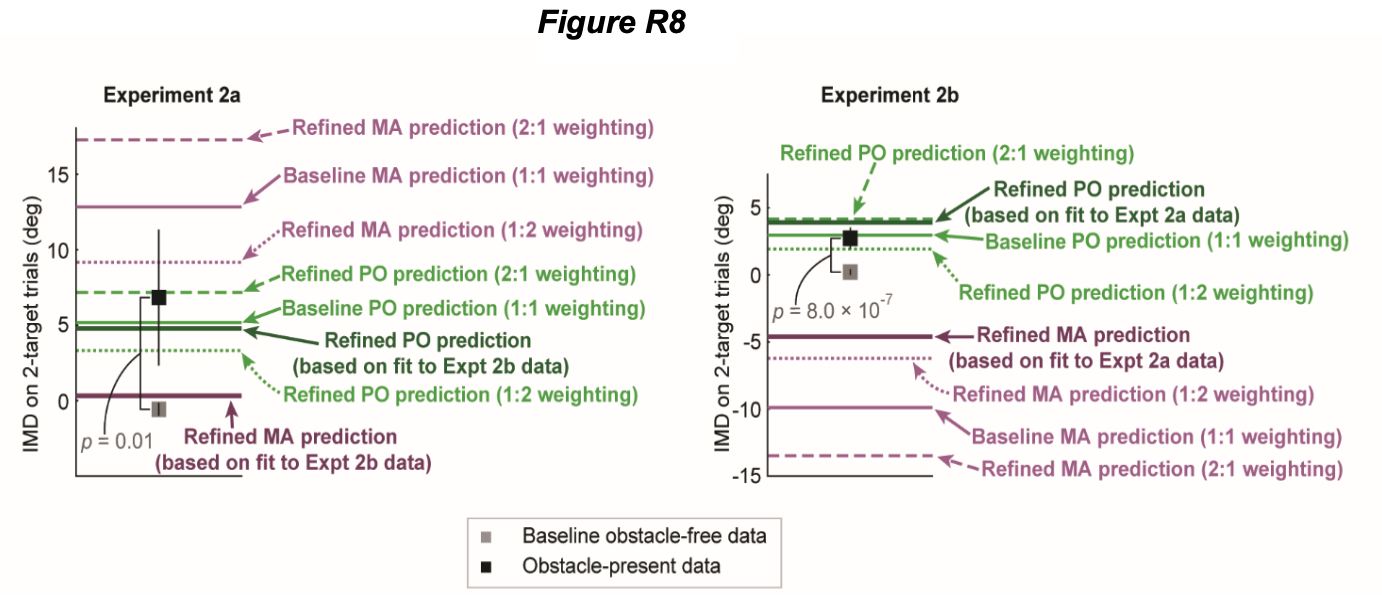
Specifically, the partial version of the analysis that had been presented (where the cost weighting for PO as well as the target weighting for MA were fit on Expt 2a and cross-validated using the Expt 2b data, but not conversely fit on Expt 2b and tested on Expt 2a) was expanded to include cross-validation of the Expt 2b fit using the Expt 2a data. As expected, the results from the converse analysis (Expt2b à Expt2a) mirror the results from the original analysis (Expt 2a à Expt 2b) for the cost weighting in the PO model, where the self-fit mean squared prediction errors modestly by 11% for the Expt 2a data, and by 29% for the Expt 2b data. In contrast, for the target weighting in the MA model, the cross-validated predictions did not explain the data well, increasing the self-fit mean squared prediction errors by 115% for the Expt 2a data, and by 750% for the Expt 2b data. Please see lines 411-470 in the main paper for a full analysis.
While I understand where the computation of the safety margin in eq.2 comes from, reducing the safety margin would make the predictions linked to the performance optimization look more and more towards the motor averaging predictions. How bad becomes the fit of the data then ?
We think that this is essentially the same question as that asked in above in section 2.4.1. Please see our response in that section above. If that response doesn’t adequately answer this question, please let us know!
How does the predictions look like if the motor costs are unbalanced (66 vs. 33%, 50 vs. 50% (current prediction), 33 vs. 66% ). What if, in Eq.2 the slope of the relationship was twice larger, twice smaller, etc.
Fig R8 above shows how PO prediction would change using the 2:1 (66:33) and 1:2 (33:66) weightings suggested by the reviewer here, in comparison to the 1:1 weighting present in the original manuscript, the Expt 2a best fit weighting present in the original manuscript, and the Expt 2b best fit weighting that the reviewer suggested we include in section 2.4.2. Please note that this figure is now included as a supplementary figure to accompany the revised manuscript.
The safety margin is the crucial element here. If it gets smaller and smaller, the PO prediction would look more and more like the MA predictions. This needs to be discussed in details. I also have the impression that the safety margin measured in exp 2a (single target trials) could be used for the PO predictions as they are both on the right side of the obstacle.
We again apologize for the confusion. We are already using safety margin measurements to make PO predictions. Specifically, within Expt 2a, we use safety margin measurements from 1-target trials (in conjunction with variability measurements on 1 & 2 target trials) to estimate safety margins on 2-target trials. And analogously within Expt 2b, we use safety margin measurements from 1-target trials (in conjunction with variability measurements on 1 & 2 target trials) to estimate safety margins on 2-target trials. Fig 4b in the main paper shows the results of this prediction (and it now also includes the cross-validated predictions of the refined models as requested in Section 2.4.4 above. Relatedly Fig R1 in this letter shows that, at the group-average level, these predictions for 2-target trial behavior in both Expt 2a and Expt 2b are essentially identical whether they are based solely on the safety margins observed on 1-target trials or on these safety margins corrected for the relative motor variabilities on 1-target and 2-target trials.
- On several occasions (e.g. line 131), the authors mention that their result prove that humans form a single motor plan. They don't have any evidence for this specific aspect as they can only see the plan that is expressed. They can prove that the latter is linked to performance optimization and not to the motor averaging one. But the absence of motor averaging does not preclude the existence of other motor plans…. Line 325 is the right interpretation.
Thanks for catching this. We agree and have now revised the text accordingly (see for example, lines 53, 134, and 693-695 in the revised manuscript).
- Line 228: the authors mention that there is no difference in adaptation between training and test periods but this does not seem to be true for the central target. How does that affect the interpretation of the 2-target trials data ? Would that explain the remaining small discrepancy between the refined PO prediction and the data (Fig.2f) ?
There must be some confusion here. The adaptation levels in the training period and the test period data from the central target are indeed quite similar, with only a <10% nominal difference in adaptation between them that is not close to statistically significant (p=0.14). We also found similar adaptation levels between the training and test epochs for the lateral targets (p=0.65 for the left target and p=0.20 for the right target). We further note that the PO predictions are based on test period data. And so, even if there were a clear decrease in adaptation between training and test periods, it would not affect the fidelity of the predictions or present a problem, except in the extreme hypothetical case where the reduction was so great that the test period adaptation was not clearly different from zero (as that would infringe on the ability of the paradigm to make clearly opposite predications for the MA and PO model) – but that is certainly not the case in our data.
Reviewer #3:
In this study, Alhussein and Smith provide two strong tests of competing hypotheses about motor planning under uncertainty: Averaging of multiple alternative plans (MA) versus optimization of motor performance (PO). In this first study, they used a force field adaptation paradigm to test this question, asking if observed intermediate movements between competing reach goals reflected the average of adapted plans to each goal, or a deliberate plan toward the middle direction. In the second experiment, they tested an obstacle avoidance task, asking if obstacle avoidance behaviors were averaged with respect to movements to non-obstructed targets, or modulated to afford optimal intermediate movements based on a commuted "safety margin." In both experiments the authors observed data consistent with the PO hypothesis, and contradictory of the MA hypothesis. The authors thus conclude that MA is not a feasible hypothesis concerning motor planning under uncertainty; rather, people appear to generate a single plan that is optimized for the task at hand.
I am of two minds about this (very nice) study. On the one hand, I think it is probably the most elegant examination of the MA idea to date, and presents perhaps the strongest behavioral evidence (within a single study) against it. The methods are sound, the analysis is rigorous, and it is clearly written/presented. Moreover, it seems to stress-test the PO idea more than previous work. On the other hand, it is hard for me to see a high degree of novelty here, given recent studies on the same topic (e.g. Haith et al., 2015; Wong & Haith, 2017; Dekleva et al., 2018). That is, I think these would be more novel findings if the motor-averaging concept had not been very recently "wounded" multiple times.
We thank the reviewer for the kind words and for their help with this manuscript.
The authors dutifully cite these papers, and offer the following reasons that one of those particular studies fell short (I acknowledge that there may be other reasons that are not as explicitly stated): On line 628, it is argued that Wong & Haith (2017) allowed for across-condition (i.e., timing/spacing constraints) strategic adjustments, such as guessing the cued target location at the start of the trial. It is then stated that, "While this would indeed improve performance and could therefore be considered a type of performance-optimization, such strategic decision making does not provide information about the implicit neural processing involved in programming the motor output for the intermediate movements that are normally planned under uncertain conditions." I'm not quite sure the current paper does this either? For example, in Exp 1, if people deliberately strategize to simply plan towards the middle on 2-target trials and feedback-correct after the cue is revealed (there is no clear evidence against them doing this), what do the results necessarily say about "implicit neural processing?" If I deliberately plan to the intermediate direction, is it surprising that my responses would inherit the implicit FF adaption responses from the associated intermediate learning trials, especially in light of evidence for movement- and/or plan-based representations in motor adaptation (Castro et al., 2011; Hirashima & Nozacki, 2012; Day et al., 2016; Sheahan et a., 2016)?
The reviewer has a completely fair point here, and we agree that the experiments in the current study are amenable to explicit strategization. Thus, without further work, we cannot claim that the current results are exclusively driven by implicit neural processing.
As the reviewer alludes to below, the possibility that the current results are driven by explicit processes in addition to or instead of implicit ones does not directly impact any of the analyses we present – or the general finding that performance-optimization, not motor averaging, underlies motor planning during uncertainty. Nonetheless, we have added a section in the discussion section to acknowledge this limitation. Furthermore, we highlight previous work demonstrating that restriction of movement preparation time suppresses explicit strategization (as the reviewer hints at below), and we suggest leveraging this finding in future work to investigate how motor output during goal uncertainty might be influenced under such constraints. This portion of the discussion section is quoted below:
“An important consideration for the present results is that sensorimotor control engages both implicit and explicit adaptive processes to generate motor output47. Because motor output reflects combined contributions of these processes, determining their individual contributions can be difficult. In particular, the experiments in the present study used environmental perturbations to induce adaptive changes in motor output, but these changes may have been partially driven by explicit strategies, and thus the extent to which the motor output measured on 2-target trials reflects implicit vs explicit feedforward motor planning requires further investigation. One method for examining implicit motor planning during goal uncertainty might take inspiration from recent work showing that in visuomotor rotation tasks, restricting the amount of time available to prepare a movement appears to limit explicit strategization from contributing to the motor response48–51. Future work could dissociate the effects of MA and PO on intermediate movements in uncertain conditions at movement preparation times short enough to isolate implicit motor planning.”
In that same vein, the Gallivan et al 2017 study is cited as evidence that intermediate movements are by nature implicit. First, it seems that this consideration would be necessarily task/design-dependent. Second, that original assumption rests on the idea that a 30˚ gradual visuomotor rotation would never reach explicit awareness or alter deliberate planning, an assumption which I'm not convinced is solid.
We generally agree with the reviewer here. We might add that in addition to introducing the perturbation gradually, Gallivan and colleagues enforced a short movement preparation time (325ms). However, we agree that the extent to which explicit strategies contribute to motor output should clearly vary from one motor task to another, and on this basis alone, the Gallivan et al 2017 study should not be cited as evidence that intermediate movements must universally reflect implicit motor planning. We have explained this limitation in the discussion section (see quote below) and have revised the manuscript accordingly.
“We note that Gallivan et al. 2017 attempted to control for the effects of explicit strategies by (1) applying the perturbation gradually, so that it might escape conscious awareness, and (2) enforcing a 325ms preparation time. Intermediate movements persisted under these conditions, suggesting that intermediate movements during goal uncertainty may indeed be driven by implicit processes. However, it is difficult to be certain whether explicit strategy use was, in fact, effectively suppressed, as the study did not assess whether participants were indeed unaware of the perturbation, and the preparation times used were considerably larger than the 222ms threshold shown to effectively eliminate explicit contributions to motor output."
The Haith et al., 2015 study does not receive the same attention as the 2017 study, though I imagine the critique would be similar. However, that study uses unpredictable target jumps and short preparation times which, in theory, should limit explicit planning while also getting at uncertainty. I think the authors could describe further reasons that that paper does not convince them about a PO mechanism.
We had omitted a detailed discussion of the Haith et al 2015 study as we think that the key findings, while interesting, have little to do with motor planning under uncertainty. But we now realize that we owe readers an explanation of our thoughts about it, which we have now included in the Discussion. This paragraph is quoted below, and we believe it provides a compelling reason why the Haith et al. 2015 study could be more convincing about PO for motor planning during uncertainty.
“Haith and colleagues (2015) examined motor planning under uncertainty using a timed-response reaching task where the target suddenly shifted on a fraction (30%) of trials 150-550ms] before movement initiation. The authors observed intermediate movements when the target shift was modest (±45°), but direct movements towards either the original or shifted target position when the shift was large (±135°). The authors argued that because intermediate movements were not observed under conditions in which they would impair task performance, that motor planning under uncertainty generally reflects performance-optimization. This interpretation is somewhat problematic, however. In this task, like in the current study, the goal location was uncertain when initially presented; however, the final target was presented far enough before movement onset that this uncertainty was no longer present during the movement itself, as evidenced by the direct-to-target motion observed when the target location was shifted by ±135°. Therefore the intermediate movements observed when the target location shifted by ±45° are unlikely to reflect motor planning under uncertain conditions. Instead, these intermediate movements likely arose from a motor decision to supplement the plan elicited by the initial target presentation with a corrective augmentation when the plan for this augmentation was certain. The results thus provide beautiful evidence for the ability of the motor system to flexibly modulate the correction of existing motor plans, ranging from complete inhibition to conservative augmentation, when new information becomes available, but provide little information about the mechanisms for motor planning under uncertain conditions.”
If the participants in Exp 2 were asked both "did you switch which side of the obstacle you went around" and "why did you do that [if yes to question 1]", what do the authors suppose they would say? It's possible that they would typically be aware of their decision to alter their plan (i.e., swoop around the other way) to optimize success. This is of course an empirical question. If true, it wouldn't hurt the authors' analysis in any way. However, I think it might de-tooth the complaint that e.g. the Wong & Haith study is too "explicit."
The participants in Expts 1, 2a, and 2b were all distinct, so there was no side-switching between experiments per se. However, the reviewer’s point is well taken. Although we didn’t survey participants, it’s hard to imagine that any were unaware of which side they traveled around the obstacle in Expt 2. Certainly, there was some level of awareness in our experiments, and while we would like to believe that the main findings arose from low-level, implicit motor planning, we frankly do not know the extent to which our findings may have depended on explicit planning. We have now clarified this key point and discussed it’s implications in the discussion section of the revised paper. That said, we do still think that the direct-to-target movements in the Wong and Haith study were likely the result of a strategic approach to salvaging some reward in their task. Please see the new section in the discussion titled: “Implicit and explicit contributions to motor planning under uncertainty” which for convenience is copied below:
Implicit and explicit contributions to motor planning under uncertainty An important consideration for the present results is that sensorimotor control engages both implicit and explicit adaptive processes to generate motor output. Because motor output reflects combined contributions of these processes, determining their individual contributions can be difficult. In particular, the experiments in the present study used environmental perturbations to induce adaptive changes in motor output, but these changes may have been partially driven by explicit strategies, and thus the extent to which the motor output measured on 2-target trials reflects implicit vs explicit feedforward motor planning requires further investigation. One method for examining implicit motor planning during goal uncertainty might take inspiration from recent work showing that in visuomotor rotation tasks, restricting the amount of time available to prepare a movement appears to limit explicit strategization from contributing to the motor response. Future work could dissociate the effects of MA and PO on intermediate movements in uncertain conditions at movement preparation times short enough to isolate implicit motor planning.
We note that Gallivan et al. 2017 attempted to control for the effects of explicit strategies by (1) applying the perturbation gradually, so that it might escape conscious awareness, and (2) enforcing a 325ms preparation time. Intermediate movements persisted under these conditions, suggesting that intermediate movements during goal uncertainty may indeed be driven by implicit processes. However, it is difficult to be certain whether explicit strategy use was, in fact, effectively suppressed, as the study did not assess whether participants were indeed unaware of the perturbation, and the preparation times used were considerably larger than the 222ms threshold shown to effectively eliminate explicit contributions to motor output.
-
Reviewer #3 (Public Review):
In this study, Alhussein and Smith provide two strong tests of competing hypotheses about motor planning under uncertainty: Averaging of multiple alternative plans (MA) versus optimization of motor performance (PO). In this first study, they used a force field adaptation paradigm to test this question, asking if observed intermediate movements between competing reach goals reflected the average of adapted plans to each goal, or a deliberate plan toward the middle direction. In the second experiment, they tested an obstacle avoidance task, asking if obstacle avoidance behaviors were averaged with respect to movements to non-obstructed targets, or modulated to afford optimal intermediate movements based on a commuted "safety margin." In both experiments the authors observed data consistent with the PO …
Reviewer #3 (Public Review):
In this study, Alhussein and Smith provide two strong tests of competing hypotheses about motor planning under uncertainty: Averaging of multiple alternative plans (MA) versus optimization of motor performance (PO). In this first study, they used a force field adaptation paradigm to test this question, asking if observed intermediate movements between competing reach goals reflected the average of adapted plans to each goal, or a deliberate plan toward the middle direction. In the second experiment, they tested an obstacle avoidance task, asking if obstacle avoidance behaviors were averaged with respect to movements to non-obstructed targets, or modulated to afford optimal intermediate movements based on a commuted "safety margin." In both experiments the authors observed data consistent with the PO hypothesis, and contradictory of the MA hypothesis. The authors thus conclude that MA is not a feasible hypothesis concerning motor planning under uncertainty; rather, people appear to generate a single plan that is optimized for the task at hand.
I am of two minds about this (very nice) study. On the one hand, I think it is probably the most elegant examination of the MA idea to date, and presents perhaps the strongest behavioral evidence (within a single study) against it. The methods are sound, the analysis is rigorous, and it is clearly written/presented. Moreover, it seems to stress-test the PO idea more than previous work. On the other hand, it is hard for me to see a high degree of novelty here, given recent studies on the same topic (e.g. Haith et al., 2015; Wong & Haith, 2017; Dekleva et al., 2018). That is, I think these would be more novel findings if the motor-averaging concept had not been very recently "wounded" multiple times.
The authors dutifully cite these papers, and offer the following reasons that one of those particular studies fell short (I acknowledge that there may be other reasons that are not as explicitly stated): On line 628, it is argued that Wong & Haith (2017) allowed for across-condition (i.e., timing/spacing constraints) strategic adjustments, such as guessing the cued target location at the start of the trial. It is then stated that, "While this would indeed improve performance and could therefore be considered a type of performance-optimization, such strategic decision making does not provide information about the implicit neural processing involved in programming the motor output for the intermediate movements that are normally planned under uncertain conditions." I'm not quite sure the current paper does this either? For example, in Exp 1, if people deliberately strategize to simply plan towards the middle on 2-target trials and feedback-correct after the cue is revealed (there is no clear evidence against them doing this), what do the results necessarily say about "implicit neural processing?" If I deliberately plan to the intermediate direction, is it surprising that my responses would inherit the implicit FF adaption responses from the associated intermediate learning trials, especially in light of evidence for movement- and/or plan-based representations in motor adaptation (Castro et al., 2011; Hirashima & Nozacki, 2012; Day et al., 2016; Sheahan et a., 2016)?
In that same vein, the Gallivan et al 2017 study is cited as evidence that intermediate movements are by nature implicit. First, it seems that this consideration would be necessarily task/design-dependent. Second, that original assumption rests on the idea that a 30˚ gradual visuomotor rotation would never reach explicit awareness or alter deliberate planning, an assumption which I'm not convinced is solid.
The Haith et al., 2015 study does not receive the same attention as the 2017 study, though I imagine the critique would be similar. However, that study uses unpredictable target jumps and short preparation times which, in theory, should limit explicit planning while also getting at uncertainty. I think the authors could describe further reasons that that paper does not convince them about a PO mechanism.
If the participants in Exp 2 were asked both "did you switch which side of the obstacle you went around" and "why did you do that [if yes to question 1]", what do the authors suppose they would say? It's possible that they would typically be aware of their decision to alter their plan (i.e., swoop around the other way) to optimize success. This is of course an empirical question. If true, it wouldn't hurt the authors' analysis in any way. However, I think it might de-tooth the complaint that e.g. the Wong & Haith study is too "explicit."
-
Reviewer #2 (Public Review):
The authors should be commended on the sharing of their data, the extensive experimental work, the experimental design that allows them to get opposite predictions for both hypotheses, and the detailed of analyses of their results. Yet, the interpretation of the results should be more cautious as some aspects of the experimental design offer some limitations. A thorough sensitivity analysis is missing from experiment 2 as the safety margin seems to be critical to distinguish between both hypotheses. Finally, the readability of the paper could also be improved by limiting the use of abbreviations and motivate some of the analyses further.
Major:
The text is difficult to read. This is partially due to the fact that the authors used many abbreviations (MA, PO, IMD). I would get rid of those as much as possible. …
Reviewer #2 (Public Review):
The authors should be commended on the sharing of their data, the extensive experimental work, the experimental design that allows them to get opposite predictions for both hypotheses, and the detailed of analyses of their results. Yet, the interpretation of the results should be more cautious as some aspects of the experimental design offer some limitations. A thorough sensitivity analysis is missing from experiment 2 as the safety margin seems to be critical to distinguish between both hypotheses. Finally, the readability of the paper could also be improved by limiting the use of abbreviations and motivate some of the analyses further.
Major:
The text is difficult to read. This is partially due to the fact that the authors used many abbreviations (MA, PO, IMD). I would get rid of those as much as possible. Sometimes, having informative labels could also help FFcentral and FFlateral would be better than FFA and FFB.
The most difficult section to follow is the one at the end of the result sections where Fig.5 is discussed. This section consists of a series of complicated analyses that are weakly motivated and explained. This section (starting on line 506) appears important to me but is extremely difficult to follow. I believe that it is important as it shows that, at the individual level, PO is also superior to MA to predict the behavior but it is poorly written and even the corresponding panels are difficult to understand as points are superimposed on each other (5b and e). In this section, the authors mention correcting for Mu1b and correcting for Sig2i/Sig1Ai but I don't know what such correction means. Furthermore, the authors used some further analyses (Eq. 3 and 4) without providing any graphical support to follow their arguments. The link between these two equations is also unclear. Why did the authors used these equations on the pooled datasets from 2a and 2b ? Is this really valid ? It is also unclear why Mu1Ai can be written as the product of R1Ai and Sig1Ai. Where does this come from ?
In experiment 1, does the presence of a central target not cue the participants to plan a first movement towards the center while such a central target was never present in other motor averaging experiment. In the adaptation domain, people complain that asking where people are aiming would induce a larger explicit component. Similarly, one could wonder whether training the participants to a middle target would not induce a bias towards that target under uncertainty
The predictions linked to experiment 2 are highly dependent on the amount of safety margin that is considered. While the authors mention these limitations in their paper, I think that it is not presented with enough details. For instance, I would like to see a figure similar to Fig.4B when the safety margin is varied.
The sensitivity analysis is very difficult to follow and does not provide the right information. First, this is only done for exp2 and not exp1. For exp1, it would be good to demonstrate that, even when varying the weight of the two one-target profiles for motor averaging, one never gets a prediction that is close to what is observed. It is unclear in the text that the performance optimization prediction simply consists of the force-profile for the center target. The authors should motivate this choice. For the second experiment 2, the authors do not present a systematic sensitivity analysis. Fig. 5a and d is a good first step but they should also fit the data on exp2b and see how this could explain the behavior in exp 2a. Second, the authors should present the results of the sensitivity analysis like they did for the main predictions in Fig.4b. While I understand where the computation of the safety margin in eq.2 comes from, reducing the safety margin would make the predictions linked to the performance optimization look more and more towards the motor averaging predictions. How bad becomes the fit of the data then ? How does the predictions look like if the motor costs are unbalanced (66 vs. 33%, 50 vs. 50% (current prediction), 33 vs. 66% ). What if, in Eq.2 the slope of the relationship was twice larger, twice smaller, etc. The safety margin is the crucial element here. If it gets smaller and smaller, the PO prediction would look more and more like the MA predictions. This needs to be discussed in details. I also have the impression that the safety margin measured in exp 2a (single target trials) could be used for the PO predictions as they are both on the right side of the obstacle.
On several occasions (e.g. line 131), the authors mention that their result prove that humans form a single motor plan. They don't have any evidence for this specific aspect as they can only see the plan that is expressed. They can prove that the latter is linked to performance optimization and not to the motor averaging one. But the absence of motor averaging does not preclude the existence of other motor plans.... Line 325 is the right interpretation.
Line 228: the authors mention that there is no difference in adaptation between training and test periods but this does not seem to be true for the central target. How does that affect the interpretation of the 2-target trials data ? Would that explain the remaining small discrepancy between the refined PO prediction and the data (Fig.2f) ?
-
Reviewer #1 (Public Review):
In this paper, Alhussein and Smith set out to determine whether motor planning under uncertainty (when the exact goal is unknown before the start of the movement) results in motor averaging (average between the two possible motor plans) or in performance optimization (one movement that maximizes the probability of successfully reaching to one of the two targets). Extending previous work by Haith et al. with two new, cleanly designed experiments, they show that performance optimization provides a better explanation of motor behaviour under uncertainty than the motor averaging hypothesis.
Main comments:
The main caveat of experiment 1 is that it rules out one particular extreme version of the movement averaging idea- namely that the motor programs are averaged at the level of muscle commands or dynamics. It is …
Reviewer #1 (Public Review):
In this paper, Alhussein and Smith set out to determine whether motor planning under uncertainty (when the exact goal is unknown before the start of the movement) results in motor averaging (average between the two possible motor plans) or in performance optimization (one movement that maximizes the probability of successfully reaching to one of the two targets). Extending previous work by Haith et al. with two new, cleanly designed experiments, they show that performance optimization provides a better explanation of motor behaviour under uncertainty than the motor averaging hypothesis.
Main comments:
The main caveat of experiment 1 is that it rules out one particular extreme version of the movement averaging idea- namely that the motor programs are averaged at the level of muscle commands or dynamics. It is still consistent with the idea that the participant first average the kinematic motor plans - and then retrieve the associated force field for this motor plan. This idea is ruled out in Experiment 2, but nonetheless I think this is worth adding to the discussion.
The logic of the correction for variability between the one-target and two-target trials in Formula 2 is not clear to me. It is likely that some of the variability in the two-target trials arises from the uncertainty in the decision - i.e. based on recent history one target may internally be assigned a higher probability than the other. This is variability the optimal controller should know about and therefore discard in the planning of the safety margin. How big was this correction factor? What is the impact when the correction is dropped ?
Equation 3 then becomes even more involved and I believe it constitutes somewhat of a distractions from the main story - namely that individual variations in the safety margin in the 1-target obstacle-obstructed movements should lead to opposite correlations under the PO and MA hypotheses with the safety margin observed in the uncertain 2-target movements (see Fig 5e). Given that the logic of the variance-correction factor (pt 2) remains shaky to me, these analyses seem to be quite removed from the main question and of minor interest to the main paper.
-
Evaluation Summary:
This study addresses an important debate in the field of motor control: Can motor commands generated under uncertain conditions be better explained as an average of different candidate motor programs, or by a single motor plan that minimizes the expected costs? The paper provides evidence for the latter hypothesis. Previous studies have provided clear evidence against the motor averaging hypothesis, however the present study provides the most elegant and conclusive examination of these two ideas to date. While some of the interpretation, especially of Experiment 2, requires more nuanced consideration, overall we thought the evidence presented supported the key conclusion.
(This preprint has been reviewed by eLife. We include the public reviews from the reviewers here; the authors also receive private feedback with …
Evaluation Summary:
This study addresses an important debate in the field of motor control: Can motor commands generated under uncertain conditions be better explained as an average of different candidate motor programs, or by a single motor plan that minimizes the expected costs? The paper provides evidence for the latter hypothesis. Previous studies have provided clear evidence against the motor averaging hypothesis, however the present study provides the most elegant and conclusive examination of these two ideas to date. While some of the interpretation, especially of Experiment 2, requires more nuanced consideration, overall we thought the evidence presented supported the key conclusion.
(This preprint has been reviewed by eLife. We include the public reviews from the reviewers here; the authors also receive private feedback with suggested changes to the manuscript. Reviewer #1 agreed to share their name with the authors.)
-
