Slow oscillation–spindle coupling strength predicts real-life gross-motor learning in adolescents and adults
This article has been Reviewed by the following groups
Discuss this preprint
Start a discussion What are Sciety discussions?Listed in
- Evaluated articles (eLife)
Abstract
Previously, we demonstrated that precise temporal coordination between slow oscillations (SOs) and sleep spindles indexes declarative memory network development (Hahn et al., 2020). However, it is unclear whether these findings in the declarative memory domain also apply in the motor memory domain. Here, we compared adolescents and adults learning juggling, a real-life gross-motor task. Juggling performance was impacted by sleep and time of day effects. Critically, we found that improved task proficiency after sleep lead to an attenuation of the learning curve, suggesting a dynamic juggling learning process. We employed individualized cross-frequency coupling analyses to reduce inter- and intragroup variability of oscillatory features. Advancing our previous findings, we identified a more precise SO–spindle coupling in adults compared to adolescents. Importantly, coupling precision over motor areas predicted overnight changes in task proficiency and learning curve, indicating that SO–spindle coupling relates to the dynamic motor learning process. Our results provide first evidence that regionally specific, precisely coupled sleep oscillations support gross-motor learning.
Article activity feed
-

-

Author Response:
Reviewer #1 (Public Review):
Overall, the authors have done a nice job covering the relevant literature, presenting a story out of complicated data, and performing many thoughtful analyses.
However, I believe the paper requires quite major revisions.
We thank the reviewer for their encouraging assessment of our manuscript. We are grateful for their valuable and especially detailed feedback that helped us to substantially improve our manuscript.
Major issues:
I do not believe the current results present a clear, comprehensible story about sleep and motor memory consolidation. As presented, sleep predicts an increase in the subsequent learning curve, but there is a negative relationship between learning curve and task proficiency change (which is, as far as I can tell, similar to "memory retention"). This makes …
Author Response:
Reviewer #1 (Public Review):
Overall, the authors have done a nice job covering the relevant literature, presenting a story out of complicated data, and performing many thoughtful analyses.
However, I believe the paper requires quite major revisions.
We thank the reviewer for their encouraging assessment of our manuscript. We are grateful for their valuable and especially detailed feedback that helped us to substantially improve our manuscript.
Major issues:
I do not believe the current results present a clear, comprehensible story about sleep and motor memory consolidation. As presented, sleep predicts an increase in the subsequent learning curve, but there is a negative relationship between learning curve and task proficiency change (which is, as far as I can tell, similar to "memory retention"). This makes it seem as if sleep predicts more forgetting on initial trials within the subsequent block (or worse memory retention) - is this true? Regardless of whether it is statistically true, there appears another story in these data that is being sacrificed to fit a story about sleep. To my eye, the results may first and foremost tell a circadian (rather than sleep) story. Examining the data in Figure 2A and 2B, it appears that every AM learning period has a higher learning curve (slope) than every PM period. While this could, of course, be due to having just slept, the main story gleaned from such a result is not a sleep effect on retention, which has been the emphasis on motor memory consolidation research in the last couple of decades, but on new learning. The fact that this effect appears present in the first session (juggling blocks 1-3 in adolescents and blocks 1-5 in adults) makes this seem the more likely story here, since it has less to do with "preparing one to re-learn" and more to do with just learning and when that learning is optimal. But even if it does not reach statistical significance in the first session alone, it remains a concern and, in my opinion, should be considered a focus in the manuscript unless the authors can devise a reason to definitively rule it out.
Here is how I recommend the authors proceed on this point: include all sessions from all subjects into a mixed effect model, predicting the slope of the learning curve with time of day and age group as fixed effects and subjects as random effects:
learning curve slope ~ AM/PM [AM (0) or PM (1)] + age [adolescent (0) or adult (1)] + (1|subject)
…or something similar with other regressors of interest. If this is significant for AM/PM status, they should re-try the analysis using only the first session. If this is significant, then a sleep-centric story cannot be defended here at all, in my opinion. If it is not (which could simply result from low power, but the authors could decide this), the authors should decide if they think they can rule out circadian effects and proceed accordingly. I should note that, while to many, a sleep story would be more interesting or compelling, that is not my opinion, and I would not solely opt to reject this paper if it centered a time-of-day story instead.
The authors need to work out precisely what is happening in the behavior here, and let the physiology follow that story. They should allow themselves to consider very major revisions (and drop the physiology) if that is most consistent with the data. As presented, I am very unclear of what to take away from the study.
We thank the reviewer for the opportunity to further elaborate on our behavioral results. We agree that the interpretation of the behavior in the complex gross-motor task is not straight forward, which might be partly due to less controllability compared to for example finger-tapping tasks. The reviewer is correct that, initially sleep seems to predict more forgetting on initial trials within the subsequent block given the dip in task proficiency and a resulting increase in steepness of the learning curve after the sleep retention interval. Notably, this dip in performance after sleep has also been reported for finger-tapping tasks (cf. Eichenlaub et al, 2020). The performance dip is also present in the wake first group (Figure 2) after the first interval. This observation suggests that picking up the task again after a period of time comes at a cost. Interestingly, this performance dip is no longer present after the second retention interval indicating that the better the task proficiency the easier it is to pick up juggling again. In other words, juggling has been better consolidated after additional training. Critically, our results show, that participants with higher SO-spindle coupling strength have a lower dip in performance after the retention interval, thus indicating a learning advantage.
Figure 2
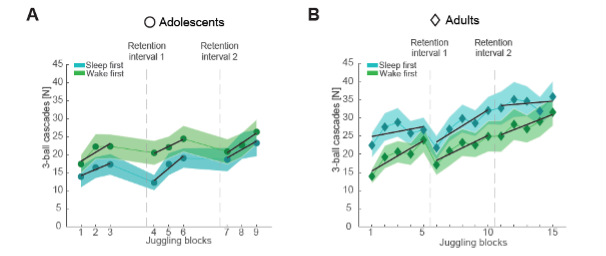
(A) Number of successful three-ball cascades (mean ± standard error of the mean [SEM]) of adolescents (circles) for the sleep-first (blue) and wake-first group (green) per juggling block. Grand average learning curve (black lines) as computed in (C) are superimposed. Dashed lines indicate the timing of the respective retention intervals that separate the three performance tests. Note that adolescents improve their juggling performance across the blocks. (B) Same conventions as in (A) but for adults (diamonds). Similar to adolescents, adults improve their juggling performance across the blocks regardless of group.
We discuss the sleep effect on juggling in the discussion section (page 22 – 23, lines 502 – 514):
"How relevant is sleep for real-life gross-motor memory consolidation? We found that sleep impacts the learning curve but did not affect task proficiency in comparison to a wake retention interval (Figure 2DE). Two accounts might explain the absence of a sleep effect on task proficiency. (1) Sleep rather stabilizes than improves gross-motor memory, which is in line with previous gross-motor adaption studies (Bothe et al, 2019; Bothe et al, 2020). (2) Pre-sleep performance is critical for sleep to improve motor skills (Wilhelm et al, 2012). Participants commonly reach asymptotic pre-sleep performance levels in finger tapping tasks, which is most frequently used to probe sleep effects on motor memory. Here we found that using a complex juggling task, participants do not reach asymptotic ceiling performance levels in such a short time. Indeed, the learning progression for the sleep-first and wake-first groups followed a similar trend (Figure 2AB), suggesting that more training and not in particular sleep drove performance gains."
If indeed the authors keep the sleep aspect of this story, here are some comments regarding the physiology. The authors present several nice analyses in Figure 3. However, given the lack of behavioral difference between adolescents and adults (Fig 2D), they combine the groups when investigating behavior-physiology relationships. In some ways, then, Figure 3 has extraneous details to the point of motor learning and retention, and I believe the paper would benefit from more focus. If the authors keep their sleep story, I believe Figure 3 and 4 should be combined and some current figure panels in Figure 3 should be removed or moved to the supplementary information.
We thank the reviewers for their suggestion and we agree that the figures of our manuscript would benefit from more focus. Therefore, we combined Figure 3 and 4 from the original manuscript into a revised Figure 3 in the updated version of the manuscript. In more detail, subpanels that explain our methodological approach can now be found in Figure 3 – figure supplement 1, while the updated Figure 3 now focuses on developmental changes in oscillatory dynamics and SO-spindle coupling strength as well as their relationship to gross-motor learning.
Updated Figure 3:
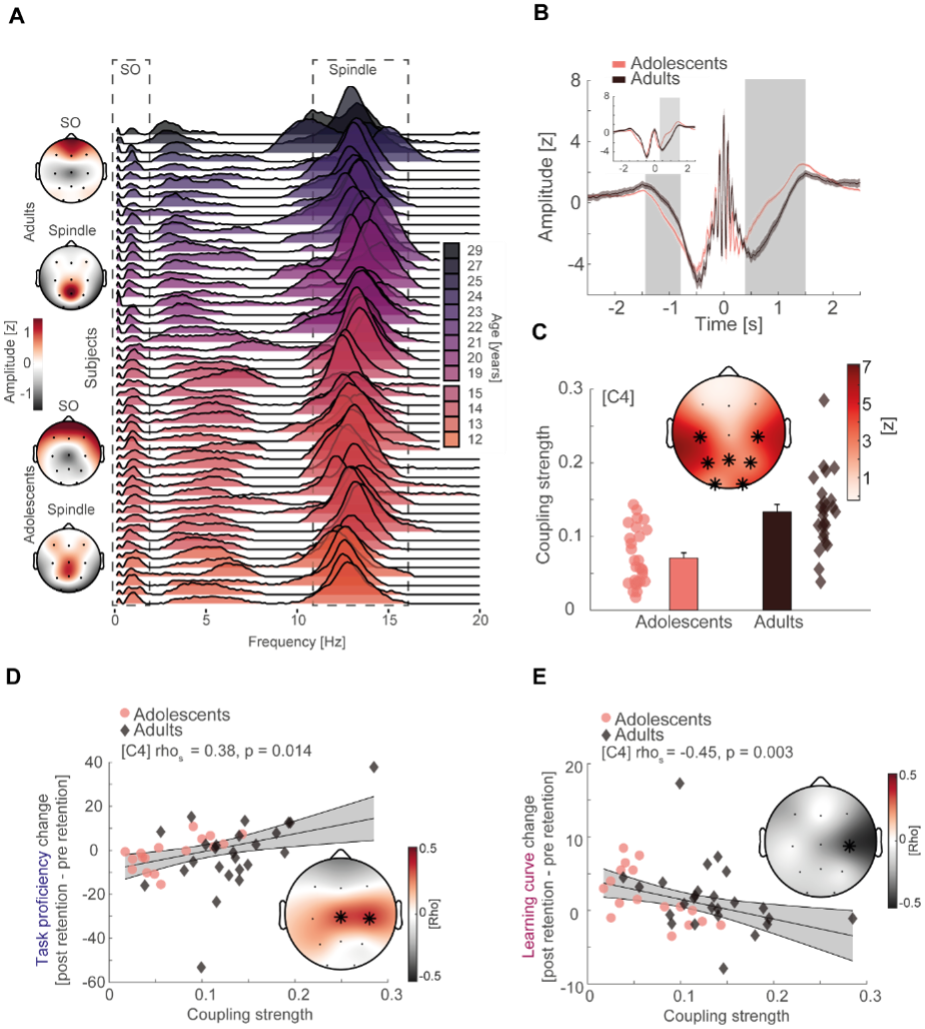
(A) Left: topographical distribution of the 1/f corrected SO and spindle amplitude as extracted from the oscillatory residual (Figure 3 – figure supplement 1A, right). Note that adolescents and adults both display the expected topographical distribution of more pronounced frontal SO and centro-parietal spindles. Right: single subject data of the oscillatory residual for all subjects with sleep data color coded by age (darker colors indicate older subjects). SO and spindle frequency ranges are indicated by the dashed boxes. Importantly, subjects displayed high inter-individual variability in the sleep spindle range and a gradual spindle frequency increase by age that is critically underestimated by the group average of the oscillatory residuals (Figure 3 – figure supplement 1A, right). (B) Spindle peak locked epoch (NREM3, co-occurrence corrected) grand averages (mean ± SEM) for adolescents (red) and adults (black). Inset depicts the corresponding SO-filtered (2 Hz lowpass) signal. Grey-shaded areas indicate significant clusters. Note, we found no difference in amplitude after normalization. Significant differences are due to more precise SO-spindle coupling in adults. (C) Top: comparison of SO-spindle coupling strength between adolescents and adults. Adults displayed more precise coupling than adolescents in a centro-parietal cluster. T-scores are transformed to z-scores. Asterisks denote cluster-corrected two-sided p < 0.05. Bottom: Exemplary depiction of coupling strength (mean ± SEM) for adolescents (red) and adults (black) with single subject data points. Exemplary single electrode data (bottom) is shown for C4 instead of Cz to visualize the difference. (D) Cluster-corrected correlations between individual coupling strength and overnight task proficiency change (post – pre retention) for adolescents (red, circle) and adults (black, diamond) of the sleep-first group (left, data at C4). Asterisks indicate cluster-corrected two-sided p < 0.05. Grey-shaded area indicates 95% confidence intervals of the trend line. Participants with a more precise SO-spindle coordination show improved task proficiency after sleep. Note that the change in task proficiency was inversely related to the change in learning curve (cf. Figure 2D), indicating that a stronger improvement in task proficiency related to a flattening of the learning curve. Further note that the significant cluster formed over electrodes close to motor areas. (E) Cluster-corrected correlations between individual coupling strength and overnight learning curve change. Same conventions as in (D). Participants with more precise SO-spindle coupling over C4 showed attenuated learning curves after sleep.
and
Figure 3 - figure supplement 1
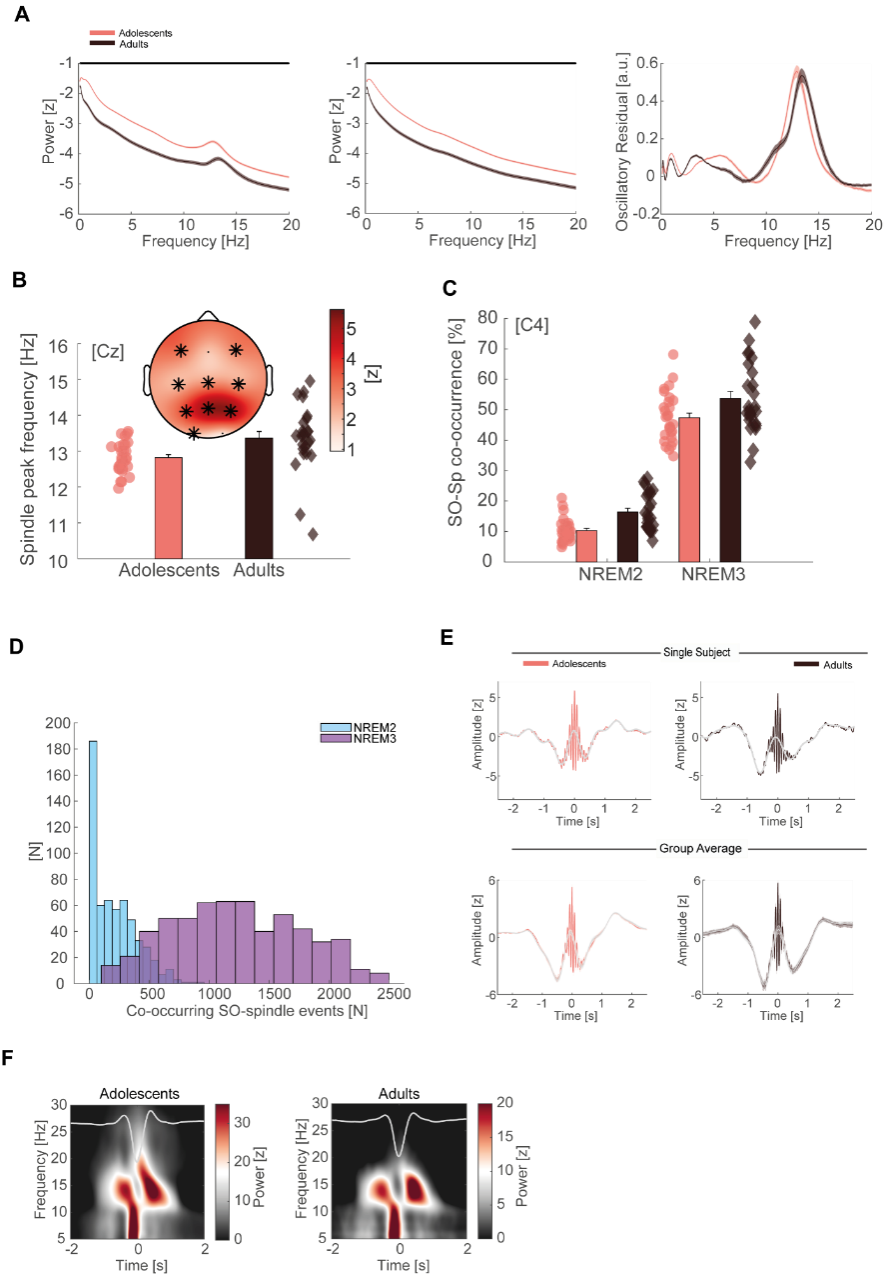
(A) Left: Z-normalized EEG power spectra (mean ± SEM) for adolescents (red) and adults (black) during NREM sleep in semi-log space. Data is displayed for the representative electrode Cz unless specified otherwise. Note the overall power difference between adolescents and adults due to a broadband shift on the y-axis. Straight black line denotes cluster-corrected significant differences. Middle: 1/f fractal component that underlies the broadband shift. Right: Oscillatory residual after subtracting the fractal component (A, middle) from the power spectrum (A, left). Both groups show clear delineated peaks in the SO (< 2 Hz) and spindle range (11 – 16 Hz) establishing the presence of the cardinal sleep oscillations in the signal. (B) Top: Spindle frequency peak development based on the oscillatory residuals. Spindle frequency is faster at all but occipital electrodes in adults than in adolescents. T-scores are transformed to z-scores. Asterisks denote cluster-corrected two-sided p < 0.05. Bottom: Exemplary depiction of the spindle frequency (mean ± SEM) for adolescents (red) and adults (black) with single subject data points at Cz. (C) SO-spindle co-occurrence rate (mean ± SEM) for adolescents (red) and adults (black) during NREM2 and NREM3 sleep. Event co-occurrence is higher in NREM3 (F(1, 51) = 1209.09, p < 0.001, partial eta² = 0.96) as well as in adults (F(1, 51) = 11.35, p = 0.001, partial eta² = 0.18). (D) Histogram of co-occurring SO-spindle events in NREM2 (blue) and NREM3 (purple) collapsed across all subjects and electrodes. Note the low co-occurring event count in NREM2 sleep. (E) Single subject (top) and group averages (bottom, mean ± SEM) for adolescents (red) and adults (black) of individually detected, for SO co-occurrence-corrected sleep spindles in NREM3. Spindles were detected based on the information of the oscillatory residual. Note the underlying SO-component (grey) in the spindle detection for single subject data and group averages indicating a spindle amplitude modulation depending on SO-phase. (F) Grand average time frequency plots (-2 to -1.5s baseline-corrected) of SO-trough-locked segments (corrected for spindle co-occurrence) in NREM3 for adolescents (left) and adults (right). Schematic SO is plotted superimposed in grey. Note the alternating power pattern in the spindle frequency range, showing that SO-phase modulates spindle activity in both age groups.
Why did the authors use Spearman rather than Pearson correlations in Figure 4? Was it to reduce the influence of the outlier subject? They should minimally clarify and justify this, since it is less conventional in this line of research. And it would be useful to know if the relationship is significant with Pearson correlations when robust regression is applied. I see the authors are using MATLAB, and the robustfit toolbox (https://www.mathworks.com/help/stats/robustfit.html) is a simple way to address this issue.
We thank the reviewers for their suggestion. We agree that when inspecting the scatter plots it looks like that the correlations could be severely influenced by two outliers in the adult group. Because this is an important matter, we recalculated all previously reported correlations without the two outliers (Figure R4, left column) and followed the reviewer’s suggestion to also compute robust regression (Figure R4, right column) and found no substantial deviation from our original results.
In more detail, increase in task proficiency resulted in flattening of the learning curve when removing outliers (Figure R4A, rhos = -0.70, p < 0.001) and when applying robust regression analysis (Figure R4B, b = -0.30, t(67) = -10.89, rho = -0.80, p < 0.001). Likewise, higher coupling strength still predicted better task proficiency (mean rho = 0.35, p = 0.029, cluster-corrected) and flatter learning curves after sleep (rho = -0.44, p = 0.047, cluster-corrected) when removing the outliers (Figure R4CE) and when calculating robust regression (Figure R4DF, task proficiency: b = 82.32, t(40) = 3.12, rho = 0.45, p = 0.003; learning curve: b = -26.84, t(40) = -2.96, rho = -0.43, p = 0.005). Furthermore, we calculated spearman rank correlations and cluster-corrected spearman rank correlations in our original manuscript, to mitigate the impact of outliers, even though Pearson correlations are more widely used in the field. Therefore, we still report spearman rank correlations for single electrodes instead of robust correlations as it is more consistent with the cluster-correlation analyses.
We now use robust trend lines instead of linear trend lines in our scatter plots. Further, we added the correlations without outliers (Figure R4ACE) to the supplements as Figure 2 – figure supplement 1D and Figure 3 – figure supplement 2 FG. These additional analyses are now reported in the results section of the revised manuscript (page 9, lines 186 – 191):
"[…] we confirmed a strong negative correlation between the change (post retention values – pre retention values) in task proficiency and the change in learning curve after the retention interval (Figure 2F; rhos = -0.71, p < 0.001), which also remained strong after outlier removal (Figure 2 – figure supplement 1D). This result indicates that participants who consolidate their juggling performance after a retention interval show slower gains in performance."
And (page 16, lines 343 – 346):
"[…] Furthermore, our results remained consistent when including coupled spindle events in NREM2 (Figure 3 – figure supplement 2E) and after outlier removal (Figure 3 – figure supplement 2FG)."
Furthermore, we now state that we specifically utilized spearman rank correlations to mitigate the impact of outliers in our analyses in the method section (page 35, lines 808 – 813)::
"For correlational analyses we utilized spearman rank correlations (rhos; Figure 2F & Figure 3DE) to mitigate the impact of possible outliers as well as cluster-corrected spearman rank correlations by transforming the correlation coefficients to t-values (p < 0.05) and clustering in the space domain (Figure 3DE). Linear trend lines were calculated using robust regression."
Figure R4
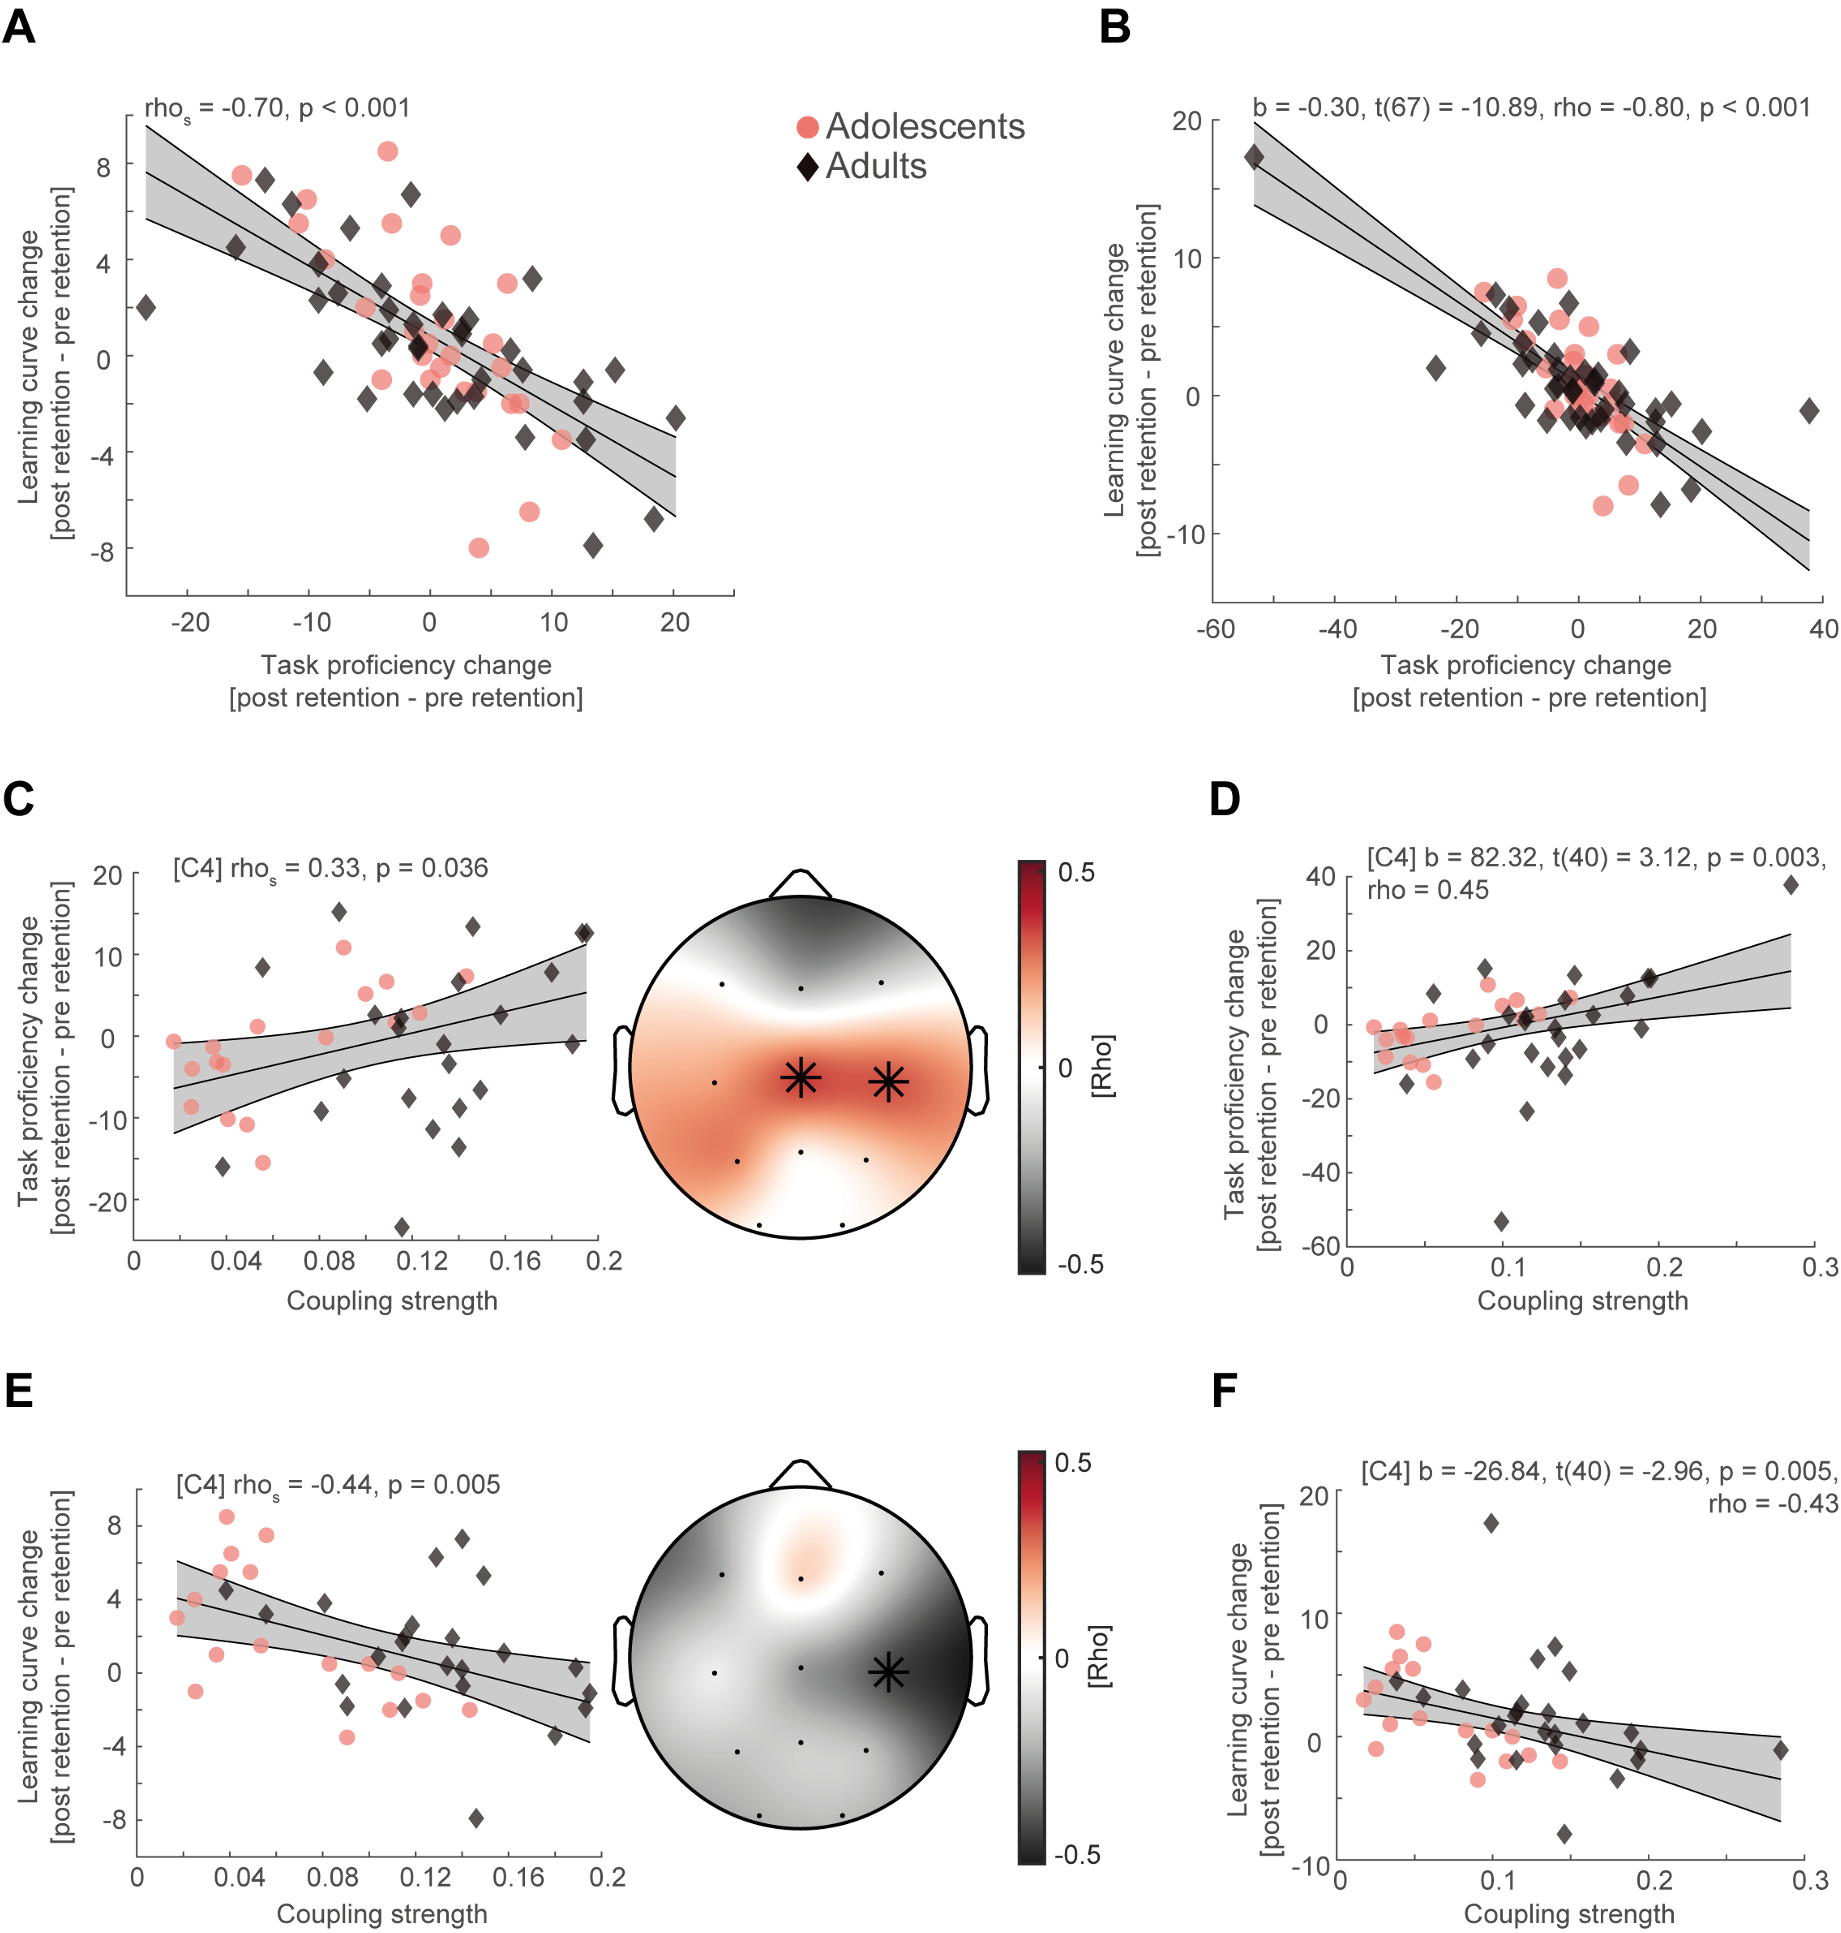
(A) Spearman rank correlation between task proficiency change and learning curve change collapsed across adolescents (red dot) and adults (black diamonds) after removing two outlier subjects in the adult age group. Grey-shaded area indicates 95% confidence intervals of the robust trend line. (B) Robust regression of task proficiency change and learning curve change of the original sample. (C) Cluster-corrected correlations (right) between individual coupling strength and overnight task proficiency change (post – pre retention) after outlier removal (left, spearman correlation at C4, uncorrected). Asterisks indicate cluster-corrected two-sided p < 0.05. (D) Robust regression of coupling strength at C4 and task proficiency of the original sample. (E) Same conventions as in (C) but for overnight learning curve change. (F) Same conventions as in (D) but for overnight learning curve change.
Additionally, with only a single night of recording data, it is impossible to disentangle possible trait-based sleep characteristics (e.g., Subject 1 has high SO-spindle coupling in general and retains motor memories well, but these are independent of each other) from a specific, state-based account (e.g., Subject 1's high SO-spindle coupling on night 1 specifically led to their improved retention or change in learning, etc., and this is unrelated to their general SO-spindle coupling or motor performance abilities). Clearly, many studies face this limitation, but this should be acknowledged.
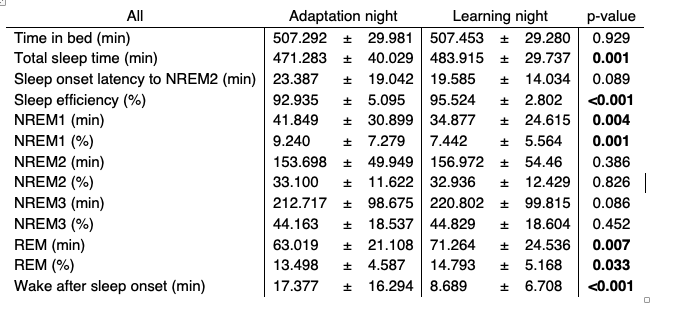
We thank the reviewers for their important remark. We agree that it is impossible to make a sound statement about whether our reported correlations represent trait- or state-based aspects of the sleep and learning relationship with the data that we have reported in the manuscript. However, while we are lacking a proper baseline condition without any task engagement, we still recorded polysomnography for all subjects during an adaptation night. Given the expected pronounced differences in sleep architecture between the adaptation nights and learning nights (see Table R3 for an overview collapsed across both age groups), we initially refrained from entering data from the adaptation nights into our original analyses, but we now fully report the data below. Note that the differences are driven by the adaptation night, where subjects first have to adjust to sleeping with attached EEG electrodes in a sleep laboratory.
Table R3. Sleep architecture (mean ± standard deviation) for the adaptation and learning night collapsed across both age groups. Nights were compared using paired t-tests
To further clarify whether subjects with high coupling strength have a motor learning advantage (i.e. trait-effect) or a learning induced enhancement of coupling strength is indicative for improved overnight memory change (i.e. state-effect), we ran additional analyses using the data from the adaptation night. Note that the coupling strength metric was not impacted by differences in event number and our correlations with behavior were not influenced by sleep architecture (please refer to our answer of issue #7 for the results).Therefore, we considered it appropriate to also utilize data from the adaptation night.
First, we correlated SO-spindle coupling strength obtained from the adaptation night with the coupling strength in the learning night. We found that overall, coupling strength is highly correlated between the two measurements (mean rho across all channels = 0.55, Figure R5A), supporting the notion that coupling strength remains rather stable within the individual (i.e. trait), similar to what has been reported about the stable nature of sleep spindles as a “neural finger-print” (De Gennaro & Ferrara, 2003; De Gennaro et al, 2005; Purcell et al, 2017).
To investigate a possible state-effect for coupling strength and motor learning, we calculated the difference in coupling strength between the two nights (learning night – adaptation night) and correlated these values with the overnight change in task proficiency and learning curve. We identified no significant correlations with a learning induced coupling strength change; neither for task proficiency nor learning curve change (Figure R5B). Note that there was a positive correlation of coupling strength change with overnight task proficiency change at Cz (Figure R5B, left), however it did not survive cluster-corrected correlational analysis (rhos = 0.34, p = 0.15). Combined, these results favor the conclusion that our correlations between coupling strength and learning rather reflect a trait-like relationship than a state-like relationship. This is in line with the interpretation of our previous studies that SO-spindle coupling strength reflects the efficiency and integrity of the neuronal pathway between neocortex and hippocampus that is paramount for memory networks and the information transfer during sleep (Hahn et al, 2020; Helfrich et al, 2019; Helfrich et al, 2018; Winer et al, 2019). For a comprehensive review please see Helfrich et al (2021), which argued that SO-spindle coupling predicts the integrity of memory pathways and therefore correlates with various metrics of behavioral performance or structural integrity.
Figure R5
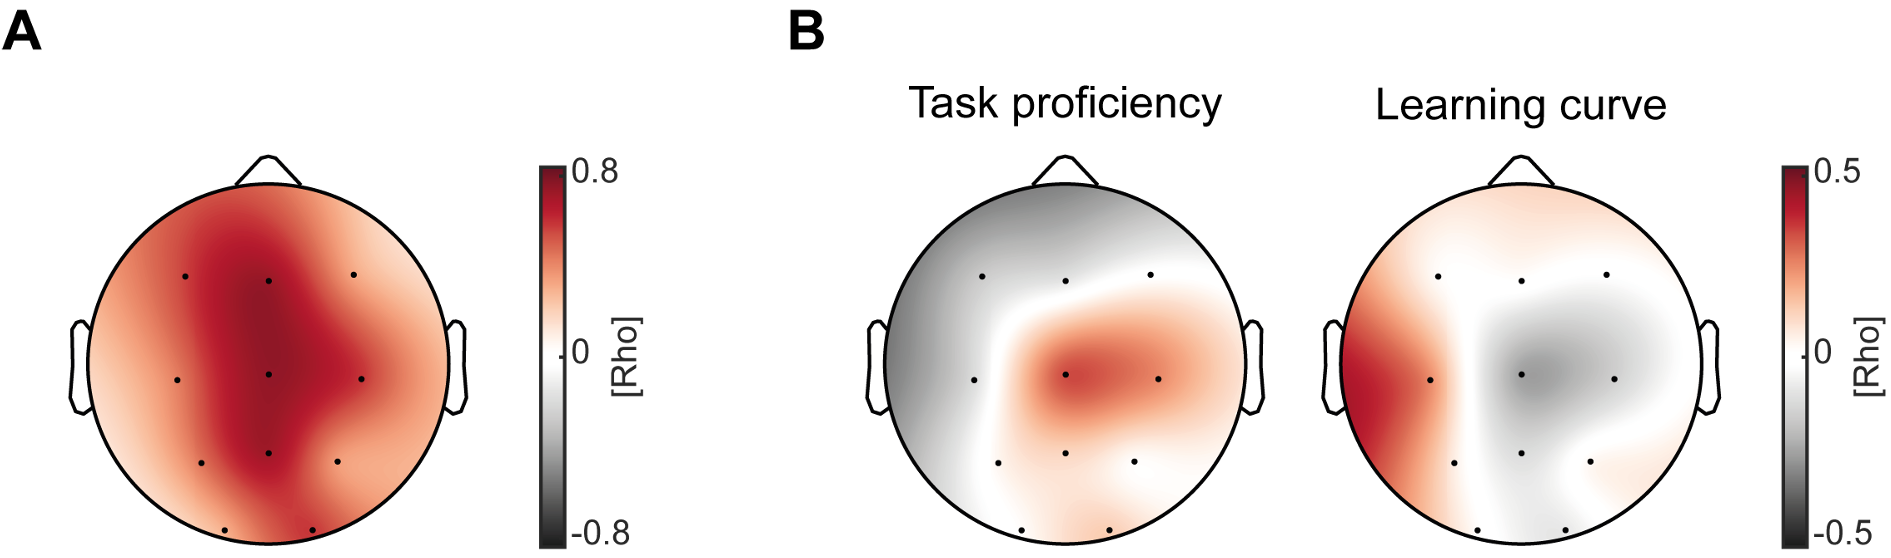
(A) Topographical plot of spearman rank correlations of coupling strength in the adaptation night and learning night across all subjects. Overall coupling strength was highly correlated between the two measurements. (B) Cluster-corrected correlation between learning induced coupling strength changes (learning night – adaptation night) and overnight change in task proficiency (left) as well as learning curve (right). We found no significant clusters, although correlations showed similar trends as our original analyses, with more learning induced changes in coupling strength resulting in better overnight task proficiency and flattened learning curves.
We have now added the additional state-trait analyses (Figure R5) to the updated manuscript as Figure 3 – figure supplement 2HI and report them in the results section (page 17, lines 361 – 375):
"Finally, we investigated whether subjects with high coupling strength have a gross-motor learning advantage (i.e. trait-effect) or a learning induced enhancement of coupling strength is indicative for improved overnight memory change (i.e. state-effect). First, we correlated SO-spindle coupling strength obtained from the adaptation night with the coupling strength in the learning night. We found that overall, coupling strength is highly correlated between the two measurements (mean rho across all channels = 0.55, Figure 3 – figure supplement 2H), supporting the notion that coupling strength remains rather stable within the individual (i.e. trait). Second, we calculated the difference in coupling strength between the learning night and the adaptation night to investigate a possible state-effect. We found no significant cluster-corrected correlations between coupling strength change and task proficiency- as well as learning curve change (Figure 3 – figure supplement 2I).
Collectively, these results indicate the regionally specific SO-spindle coupling over central EEG sensors encompassing sensorimotor areas precisely indexes learning of a challenging motor task."
We further refer to these new results in the discussion section (page 23, lines 521 – 528):
"Moreover, we found that SO-spindle coupling strength remains remarkably stable between two nights, which also explains why a learning-induced change in coupling strength did not relate to behavior (Figure 3 – figure supplement 2I). Thus, our results primarily suggest that strength of SO-spindle coupling correlates with the ability to learn (trait), but does not solely convey the recently learned information. This set of findings is in line with recent ideas that strong coupling indexes individuals with highly efficient subcortical-cortical network communication (Helfrich et al, 2021)."
Additionally, we now provide descriptive data of the adaptation and learning night (Table R3) in the Supplementary file – table 1 and explicitly mention the adaptation night in the results section, which was previously only mentioned in the method section(page 6, lines 101 – 105):.
"Polysomnography (PSG) was recorded during an adaptation night and during the respective sleep retention interval (i.e. learning night) except for the adult wake-first group (for sleep architecture descriptive parameters of the adaptation night and learning night as well as for adolescents and adults see Supplementary file – table 1 & 2)."
Reviewer #2 (Public Review):
In this study Hahn and colleagues investigate the role of Slow-oscillation spindle coupling for motor memory consolidation and the impact of brain maturation on these interactions. The authors employed a real-life gross-motor task, where adolescents and adults learned to juggle. They demonstrate that during post-learning sleep SO-spindles are stronger coupled in adults as compared to adolescents. The authors further show, that the strength of SO-spindle coupling correlates with overnight changes in the learning curve and task proficiency, indicating a role of SO-spindle coupling in motor memory consolidation.
Overall, the topic and the results of the present study are interesting and timely. The authors employed state of the art analyse carefully taking the general variability of oscillatory features into account. It also has to be acknowledged that the authors moved away from using rather artificial lab-tasks to study the consolidation of motor memories (as it is standard in the field), adding ecological validity to their findings. However, some features of their analyses need further clarification.
We thank the reviewer for their positive assessment of our manuscript. Incorporating the encouraging and helpful feedback, we believe that we substantially improved the clarity and robustness of our analyses.
- Supporting and extending previous work of the authors (Hahn et al, 2020), SO-spindle coupling over centro-parietal areas was stronger in adults as compared to adolescents. Despite these differences in the EEG results the authors collapsed the data of adults and adolescents for their correlational analyses (Fig. 4a and 4b). Why would the authors think that this procedure is viable (also given the fact that different EEG systems were used to record the data)?
We thank the reviewers for the opportunity to clarify why we think it is viable to collapse the data of adolescents and adults for our correlational analyses. In the following we split our answers based on the two points raised by the reviewers: (1) electrophysiological differences (i.e. coupling strength) between the groups and (2) potential signal differences due to different EEG systems.
- Electrophysiological differences
Upon inspecting the original Figure 4, it is apparent that the coupling strength of the combined sample does not form isolated clusters for each age group. In other words, while adult coupling strength is on the higher and adolescent coupling on the lower end due to the developmental increase in coupling strength we reported in the original Figure 3F, both samples overlap forming a linear trend. Second, when running the correlational analyses between coupling strength and task proficiency as well as learning curve separately for each age group, we found that they follow the same direction (Figure R3). Adolescents with higher coupling strength show better task proficiency (Figure R3A, rhos = 0.66, p = 0.005). This effect was also present when using robust regression (b = 109.97, t(15)=3.13, rho = 0.63, p = 0.007). Like adolescents, adults with higher coupling strength at C4 displayed better task proficiency after sleep (Figure R3B, rhos = 0.39, p = 0.053). This relationship was stronger when using robust regression (b = 151.36, t(23)=3.17, rho =0.56, p = 0.004). For learning curves, we found the expected negative correlation at C4 for adolescents (Figure R3C, rhos = -0.57, p = 0.020) and adults (Figure R3D, rhos = -0.44, p = 0.031). Results were comparable when using robust regression (adolescents: b = -59.58, t(15) = -2.94, rho = -0.60, p = 0.010; adults: b = -21.99, t(23 )= -1.71, rho = -0.37, p = 0.101).
Taken together, these results demonstrate that adolescents and adults show the effects and the same direction at the same electrode, thus, making it highly unlikely that our results are just by chance and that our initial correlation analyses are just driven by one group.
Additionally, we already controlled for age in our original analyses using partial correlations (also refer to our answer to issue #6). Hence, our additional analyses provide additional support that it is viable to collapse the analyses across both age groups even though they differ in coupling strength.
Different EEG-systems
The reviewers also raise the question whether our analyses might be impacted by the different EEG systems we used to record our data. This is an important concern especially when considering that cross-frequency coupling analyses can be severely confounded by differences in signal properties (Aru et al, 2015). In our sample, the strongest impact factor on signal properties is most likely age, given the broadband power differences in the power spectrum we found between the groups (original Figure 3A). Importantly, we also found a similar systematic power difference in our longitudinal study using the same ambulatory EEG system for both data recordings (Hahn et al, 2020). This is in line with numerous other studies demonstrating age related EEG power changes in broadband- as well as SO and sleep spindle frequency ranges (Campbell & Feinberg, 2016; Feinberg & Campbell, 2013; Helfrich et al, 2018; Kurth et al, 2010; Muehlroth et al, 2019; Muehlroth & Werkle-Bergner, 2020; Purcell et al, 2017). Therefore, we already had to take differences in signal property into account for our cross-frequency analyses. Regardless whether the underlying cause is an age difference or different signal-to-noise ratios of different EEG systems.
To mitigate confounds in the signal, we used a data-driven and individualized approach detecting SO and sleep spindle events based on individualized frequency bands and a 75-percentile amplitude criterion relative to the underlying signal. Additionally we z-normalized all spindle events prior to the cross-frequency coupling analyses (Figure R3E). We found no amplitude differences around the spindle peak (point of SO-phase readout) between adolescents that were recorded with an ambulatory amplifier system (alphatrace) and adults that were recorded with a stationary amplifier system (neuroscan) using cluster-based random permutation testing. This was also the case for the SO-filtered (< 2 Hz) signal (Figure R3E, inset). Critically, the significant differences in amplitude from -1.4 to -0.8 s (p = 0.023, d = -0.73) and 0.4 to 1.5 s (p < 0.001, d = 1.1) are not caused by age related differences in power or different EEG-systems but instead by the increased coupling strength (i.e. higher coupling precision of spindles to SOs) in adults giving rise to a more pronounced SO-wave shape when averaging across spindle peak locked epochs.
Consequently, our analysis pipeline already controlled for possible differences in signal property introduced through different amplifier systems. Nonetheless, we also wanted to directly compare the signal-to-noise ratio of the ambulatory and stationary amplifier systems. However, we only obtained data from both amplifier systems in the adult sleep first group, because we recorded EEG during the juggling learning phase with the ambulatory system in addition to the PSG with the stationary system. First, we computed the power spectra in the 1 to 49 Hz frequency range during the juggling learning phase (ambulatory) and during quiet wakefulness (stationary) for every subject in the adult sleep first group in 10-seconds segments. Next, we computed the signal-to-noise ratio (mean/standard deviation) of the power spectra per frequency across all segments. We only found a small negative cluster from 21.9 to 22.5 Hz (p = 0.042, d = 0.53; Figure R3F), which did not pertain our frequency-bands of interest. Critically, the signal-to-noise ratio of both amplifiers converged in the upper frequency bands approaching the noise floor, therefore, strongly supporting the notion that both systems in fact provided highly comparable estimates.
In conclusion, both age groups display highly similar effects and direction when correlating coupling strength with behavior. Further, after individualization and normalization the analytical signal, we found no differences in signal properties that would confound the cross-frequency analysis. Lastly, we did not find systematic differences in signal-to-noise ratio between the different EEG-systems. Thus, we believe it is justified to collapse the data across all participants for the correlational analyses, as it combines both, the developmental aspect of enhanced coupling precision from adolescence to adulthood and the behavioral relevance for motor learning which we deem a critical research advance from our previous study.
Figure R3
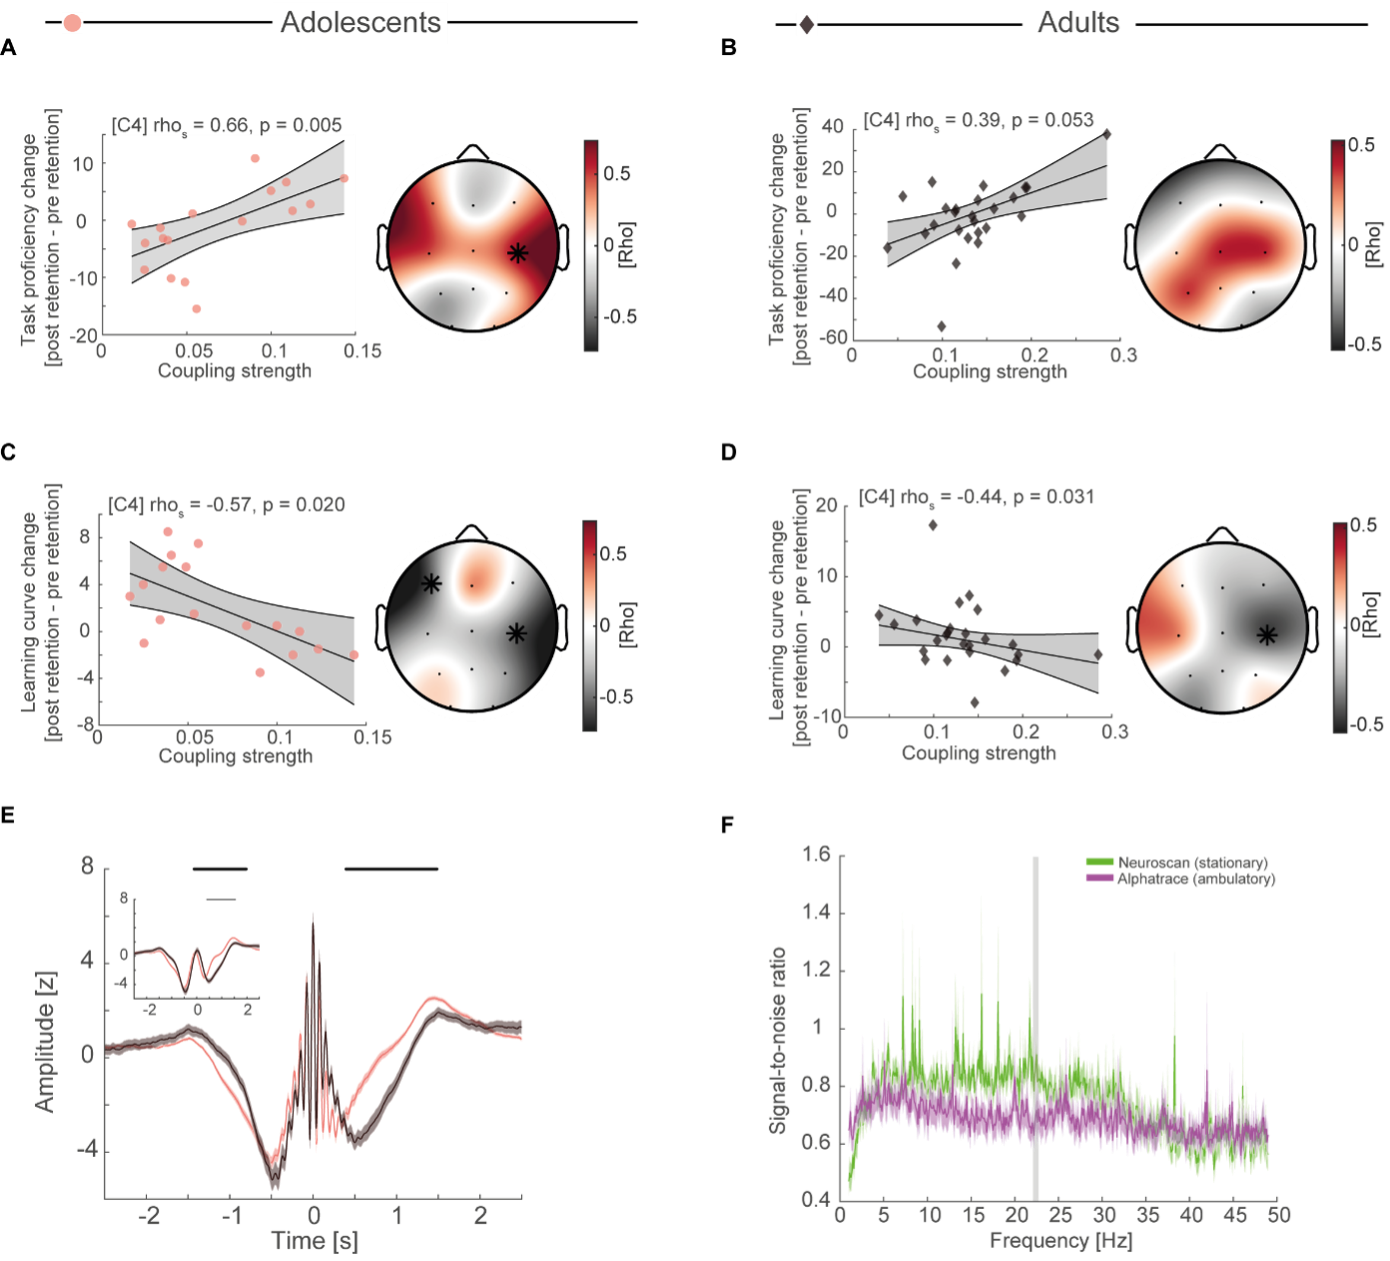
(A) Cluster-corrected correlations (right) between individual coupling strength and overnight task proficiency change (post – pre retention) for adolescents of the sleep-first group (left, spearman correlation at C4, uncorrected). Asterisks indicate cluster-corrected two-sided p < 0.05. Grey-shaded area indicates 95% confidence intervals of the robust trend line. Participants with a more precise SO-spindle coordination show improved task proficiency after sleep. (B) Cluster-corrected correlation of coupling strength and overnight task proficiency change) for adults. Same conventions as in (A). Similar trend of higher coupling strength predicting better task proficiency after sleep (C) Cluster-corrected correlation of coupling strength and overnight learning curve change for adolescents. Same conventions as in (A). Higher coupling strength related to a flatter learning curve after sleep. (D) Cluster-corrected correlation of coupling strength and overnight learning curve change for adults. Same conventions as in (A). Higher coupling strength related to a flatter learning curve after sleep. (E) Spindle peak locked epoch (NREM3, co-occurrence corrected) grand averages (mean ± SEM) for adolescents (red) and adults (black). Inset depicts the corresponding SO-filtered (2 Hz lowpass) signal. Black lines indicate significant clusters. Note, we found no difference in amplitude after normalization. Significant differences are due to more precise SO-spindle coupling in adults. Spindle frequency is blurred due to individualized spindle detection. (F) Signal-to-noise ratio for the stationary EEG amplifier (green) during quiet wakefulness and for the ambulatory EEG amplifier (purple) during juggling training. Grey shaded area denotes cluster-corrected p < 0.05. Note that signal-to-noise ratio converges in the higher frequency ranges.
We have now added Figure R3E as Figure 3B to the revised version of the manuscript to demonstrate that there were no systematic differences between the two age groups in the analytical signal due to the expected age related power differences or EEG-systems. Specifically, we now state in the results section (page 13 – 14, lines 282 – 294):
"We assessed the cross frequency coupling based on z-normalized spindle epochs (Figure 3B) to alleviate potential power differences due to age (Figure 3 – figure supplement 1A) or different EEG-amplifier systems that could potentially confound our analyses (Aru et al, 2015). Importantly, we found no amplitude differences around the spindle peak (point of SO-phase readout) between adolescents and adults using cluster-based random permutation testing (Figure 3B), indicating an unbiased analytical signal. This was also the case for the SO-filtered (< 2 Hz) signal (Figure 3B, inset). Critically, the significant differences in amplitude from -1.4 to -0.8 s (p = 0.023, d = -0.73) and 0.4 to 1.5 s (p < 0.001, d = 1.1) are not caused by age related differences in power or different EEG-systems but instead by the increased coupling strength (i.e. higher coupling precision of spindles to SOs) in adults giving rise to a more pronounced SO-wave shape when averaging across spindle peak locked epochs."
Further, we added the correlational analyses that we computed separately for the age groups (Figure R3A-D) to the revised manuscript (Figure 3 – figure supplement 2CD) as they further substantiate our claims about the relationship between SO-spindle coupling and gross-motor learning.
We now refer to these analyses in the results section (page 16, lines 338 – 343):
"Critically, when computing the correlational analyses separately for adolescents and adults, we identified highly similar effects at electrode C4 for task proficiency (Figure 3 – figure supplement 2C) and learning curve (Figure 3 – figure supplement 2D) in each group. These complementary results demonstrate that coupling strength predicts gross-motor learning dynamics in both, adolescents as well as adults, and further show that this effect is not solely driven by one group."
- The authors might want to explicitly show that the reported correlations (with regards to both learning curve and task proficiency change) are not driven by any outliers.
We thank the reviewers for their suggestion. We agree that when inspecting the scatter plots it looks like that the correlations could be severely influenced by two outliers in the adult group. Because this is an important matter, we recalculated all previously reported correlations without the two outliers (Figure R4, left column) and followed the reviewer’s suggestion to also compute robust regression (Figure R4, right column) and found no substantial deviation from our original results.
In more detail, increase in task proficiency resulted in flattening of the learning curve when removing outliers (Figure R4A, rhos = -0.70, p < 0.001) and when applying robust regression analysis (Figure R4B, b = -0.30, t(67) = -10.89, rho = -0.80, p < 0.001). Likewise, higher coupling strength still predicted better task proficiency (mean rho = 0.35, p = 0.029, cluster-corrected) and flatter learning curves after sleep (rho = -0.44, p = 0.047, cluster-corrected) when removing the outliers (Figure R4CE) and when calculating robust regression (Figure R4DF, task proficiency: b = 82.32, t(40) = 3.12, rho = 0.45, p = 0.003; learning curve: b = -26.84, t(40) = -2.96, rho = -0.43, p = 0.005). Furthermore, we calculated spearman rank correlations and cluster-corrected spearman rank correlations in our original manuscript, to mitigate the impact of outliers, even though Pearson correlations are more widely used in the field. Therefore, we still report spearman rank correlations for single electrodes instead of robust correlations as it is more consistent with the cluster-correlation analyses.
We now use robust trend lines instead of linear trend lines in our scatter plots. Further, we added the correlations without outliers (Figure R4ACE) to the supplements as Figure 2 – figure supplement 1D and Figure 3 – figure supplement 2 FG. These additional analyses are now reported in the results section of the revised manuscript (page 9, lines 186 – 191):
"[…] we confirmed a strong negative correlation between the change (post retention values – pre retention values) in task proficiency and the change in learning curve after the retention interval (Figure 2F; rhos = -0.71, p < 0.001), which also remained strong after outlier removal (Figure 2 – figure supplement 1D). This result indicates that participants who consolidate their juggling performance after a retention interval show slower gains in performance."
And (page 16, lines 343 – 346):
"[…] Furthermore, our results remained consistent when including coupled spindle events in NREM2 (Figure 3 – figure supplement 2E) and after outlier removal (Figure 3 – figure supplement 2FG)."
Furthermore, we now state that we specifically utilized spearman rank correlations to mitigate the impact of outliers in our analyses in the method section (page 35, lines 808 – 813)::
"For correlational analyses we utilized spearman rank correlations (rhos; Figure 2F & Figure 3DE) to mitigate the impact of possible outliers as well as cluster-corrected spearman rank correlations by transforming the correlation coefficients to t-values (p < 0.05) and clustering in the space domain (Figure 3DE). Linear trend lines were calculated using robust regression."
Figure R4:

(A) Spearman rank correlation between task proficiency change and learning curve change collapsed across adolescents (red dot) and adults (black diamonds) after removing two outlier subjects in the adult age group. Grey-shaded area indicates 95% confidence intervals of the robust trend line. (B) Robust regression of task proficiency change and learning curve change of the original sample. (C) Cluster-corrected correlations (right) between individual coupling strength and overnight task proficiency change (post – pre retention) after outlier removal (left, spearman correlation at C4, uncorrected). Asterisks indicate cluster-corrected two-sided p < 0.05. (D) Robust regression of coupling strength at C4 and task proficiency of the original sample. (E) Same conventions as in (C) but for overnight learning curve change. (F) Same conventions as in (D) but for overnight learning curve change.
- The sleep data of all participants (thus from both sleep first and wake first) were used to determine the features of SO-spindle coupling in adolescents and adults. Were there any differences between groups (sleep first vs. wake first)? This might be in interesting in general but especially because only data of the sleep first group entered the subsequent correlational analyses.
We thank the reviewers for their remark. We agree that adding additional information about possible differences between the sleep first and wake first groups would allow for a more comprehensive assessment of the reported data. We did not explain our reasoning to include only the sleep first groups for the correlation analyses clearly enough in the original manuscript. Unfortunately, we can only report data for the adolescents in our sample, because we did not record polysomnography (PSG) for the adult wake first group. This is also one of the two reasons why we focused on the sleep first groups for our correlational analyses.
Adolescents in the sleep first group did not differ from adolescents in the wake first group in terms of sleep architecture (except REM (%), which did not correlate with behavior [task proficiency: rho = -0.17, p = 0.28; learning curve: -0.02, p = 0.90]) as well as SO and sleep spindle event descriptive measures (see Table R2). Importantly, we found no differences in coupling strength between the two groups (Figure R2A).
Table R2. Summary of sleep architecture and SO/spindle event descriptive measures (at electrode C4) of adolescents in the sleep first and wake first group (mean ± standard deviation). Independent t-tests were used for comparisons
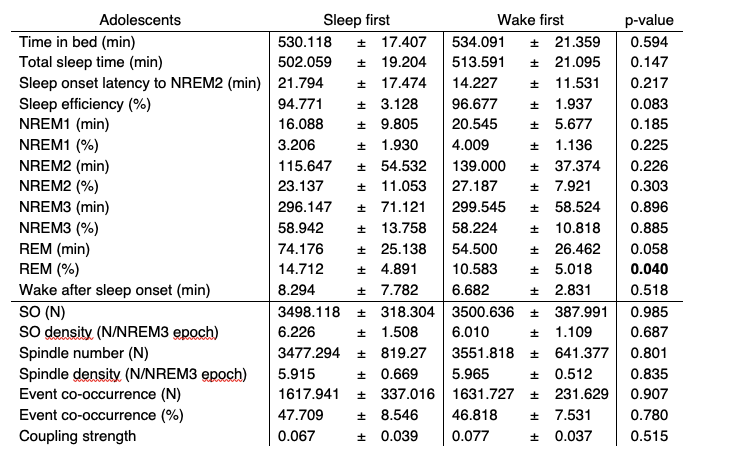
The second reason why we focused our analyses on sleep first was that adolescents in the wake first group had higher task proficiency after the sleep retention interval than the sleep first group (Figure R2A; t(23) = -2.24, p = 0.034). This difference in performance is directly explained by the additional juggling test that the wake first group performed at the time point of their learning night, which should be considered as additional training. Therefore, we excluded the wake first group from our correlational analyses because sleep and wake first group are not comparable in terms of juggling training during the night when we assessed SO-spindle coupling strength.
Figure R2
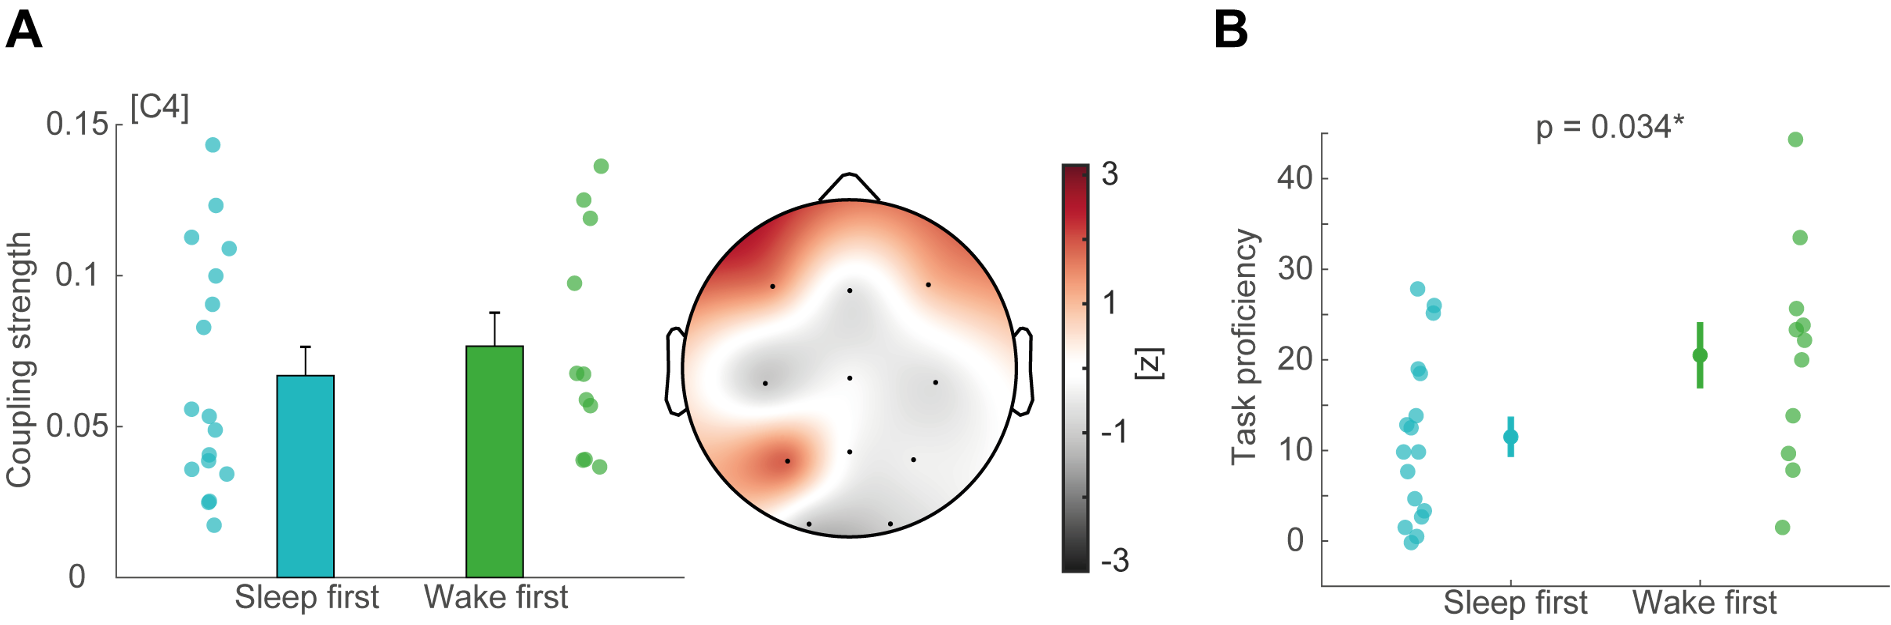
(A) Comparison of SO-spindle coupling strength in the adolescent sleep first (blue) and wake first (green) group using cluster-based random permutation testing (Monte-Carlo method, cluster alpha 0.05, max size criterion, 1000 iterations, critical alpha level 0.05, two-sided). Left: exemplary depiction of coupling strength at electrode C4 (mean ± SEM). Right: z-transformed t-values plotted for all electrodes obtained from the cluster test. No significant clusters emerged. (B) Comparison of task proficiency between sleep first and wake first group after the sleep retention interval (mean ± SEM). Adolescents in the wake first group had higher task proficiency given the additional juggling performance test, which also reflects additional training.
These additional analyses (Figure R2) and the summary statistics of sleep architecture and SO/spindle event descriptives of adolescents in the sleep first and wake first group (Table R2), are now reported in the revised version of the manuscript as Figure 3 – figure supplement 2AB and Supplementary file – table 7. We now explicitly explain our rationale of why we only considered participants in the sleep first group for our correlational analyses in the results section (page 6, lines 101 – 105):
"Polysomnography (PSG) was recorded during an adaptation night and during the respective sleep retention interval (i.e. learning night) except for the adult wake-first group (for sleep architecture descriptive parameters of the adaptation night and learning night as well as for adolescents and adults see Supplementary file – table 1 & 2)"
And (page 15, lines 311 – 320):
"[…] Furthermore, given that we only recorded polysomnography for the adults in the sleep first group and that adolescents in the wake first group showed enhanced task proficiency at the time point of the sleep retention interval due to additional training (Figure 3 – figure supplement 2A), we only considered adolescents and adults of the sleep-first group to ensure a similar level of juggling experience adolescents and adults of the sleep-first group to ensure a similar level of juggling experience (for summary statistics of sleep architecture and SO and spindle events of subjects that entered the correlational analyses see Supplementary file – table 6). Notably, we found no differences in electrophysiological parameters (i.e. coupling strength, event detection) between the adolescents of the wake first and sleep first group (Figure 3 – figure supplement 2B & Supplementary file – table 7)."
- To allow a more comprehensive assessment of the underlying data information with regards to general sleep descriptives (minutes, per cent of time spent in different sleep stages, overall sleep time etc.) as well as related to SOs, spindles and coupled events (e.g. number, density etc.) would be needed.
We agree with the reviewers that additional information about sleep architecture and SO as well as sleep spindle characteristics are needed for a more comprehensive assessment of our data. We now added summary tables for sleep architecture and SO/spindle event descriptive measures for the whole sample (Table R4) and for the sleep first groups that we used for our correlational analyses (Table R5) to the supplementary material in the updated manuscript. It is important to note, that due to the longer sleep opportunity of adolescents that we provided to accommodate the overall higher sleep need in younger participants, adolescents and adults differed in most general sleep architecture markers and SO as well as sleep spindle descriptive measures. In addition, changes in sleep architecture are prominent during the maturational phase from adolescence to adulthood, which might introduce additional variance between the two age groups.
Table R4. Summary of sleep architecture and SO/spindle event descriptive measures (at electrode C4) of adolescents and adults across the whole sample (mean ± standard deviation) in the learning night. Independent t-tests were used for comparisons
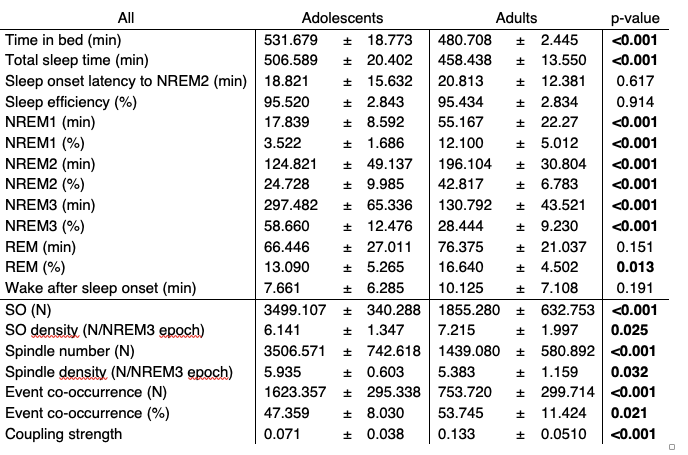
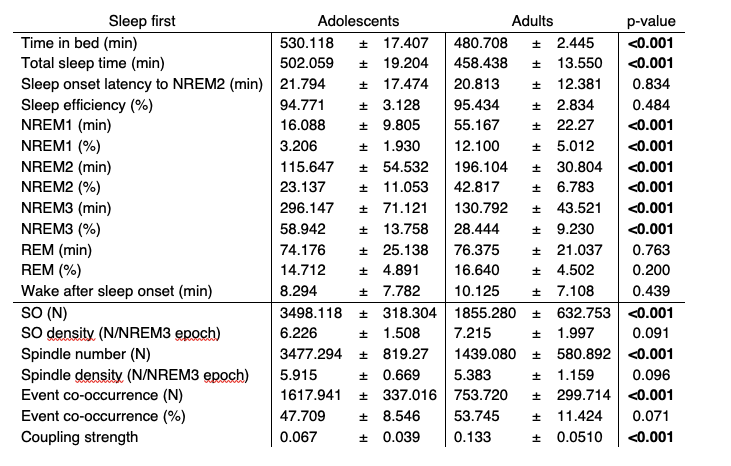
Table R5. Summary of sleep architecture and SO/spindle event descriptive measures (at electrode C4) of adolescents and adults in the sleep first group (mean ± standard deviation) in the learning night. Independent t-tests were used for comparisons
In order to ensure that our correlational analyses are not driven by these systematic differences between the two age groups, we used cluster-corrected partial correlations to control for sleep architecture markers (Figure R7) and SO/spindle descriptive measurements (Figure R8A). Critically, none of these possible confounders changed the pattern of our initial correlational analyses of coupling strength and task proficiency/learning curve. Additionally, we also controlled for differences in spindle event number by using a bootstrapped resampling approach. We randomly drew 200 spindle events in 100 iterations and subsequently recalculated the coupling strength for each subject. We found that resampled values and our original observation of coupling strength are almost perfectly correlated, indicating that differences in event number are unlikely to have an impact on coupling strength as long as there are at least 200 events (Figure R8B). Combined these analyses demonstrate that our correlations between coupling strength and behavior are not influenced by the reported differences in sleep architecture and SO/spindle descriptive measures.
Figure 7R
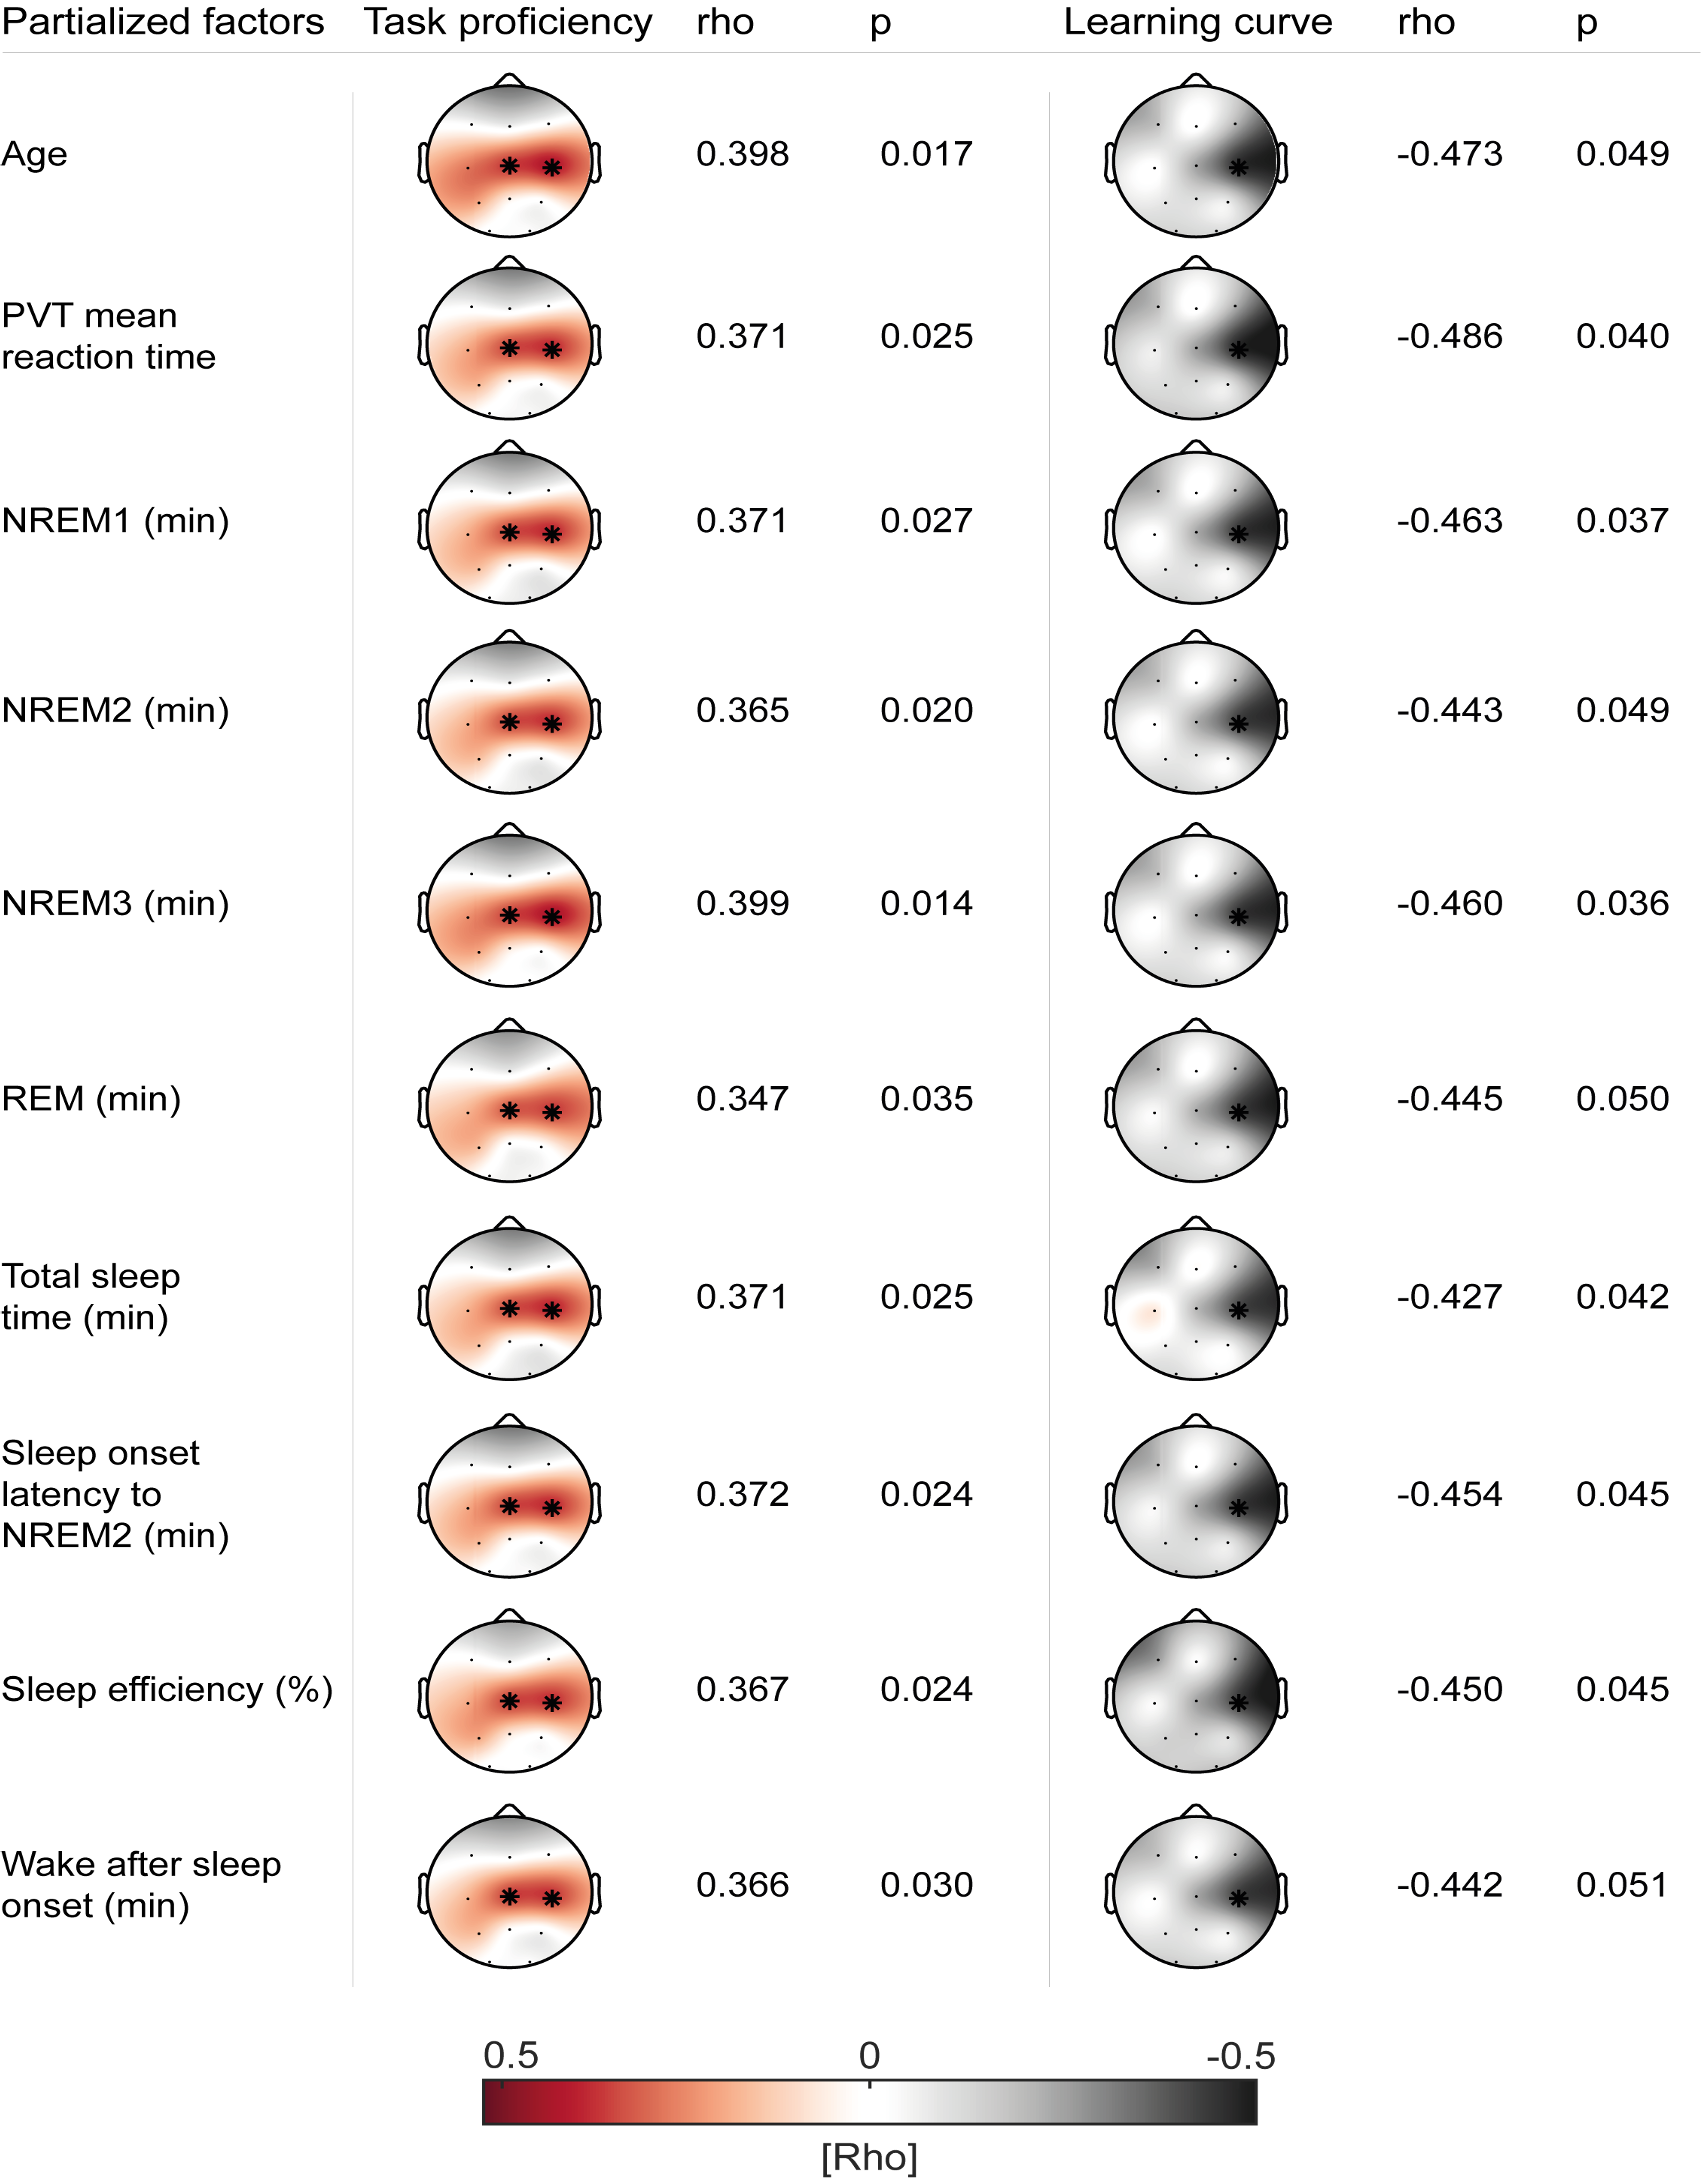
Summary of cluster-corrected partial correlations of coupling strength with task proficiency (left) and learning curve (right) controlling for possible confounding factors. Asterisks indicate location of the detected cluster. The pattern of initial results remained highly stable.
Figure R8
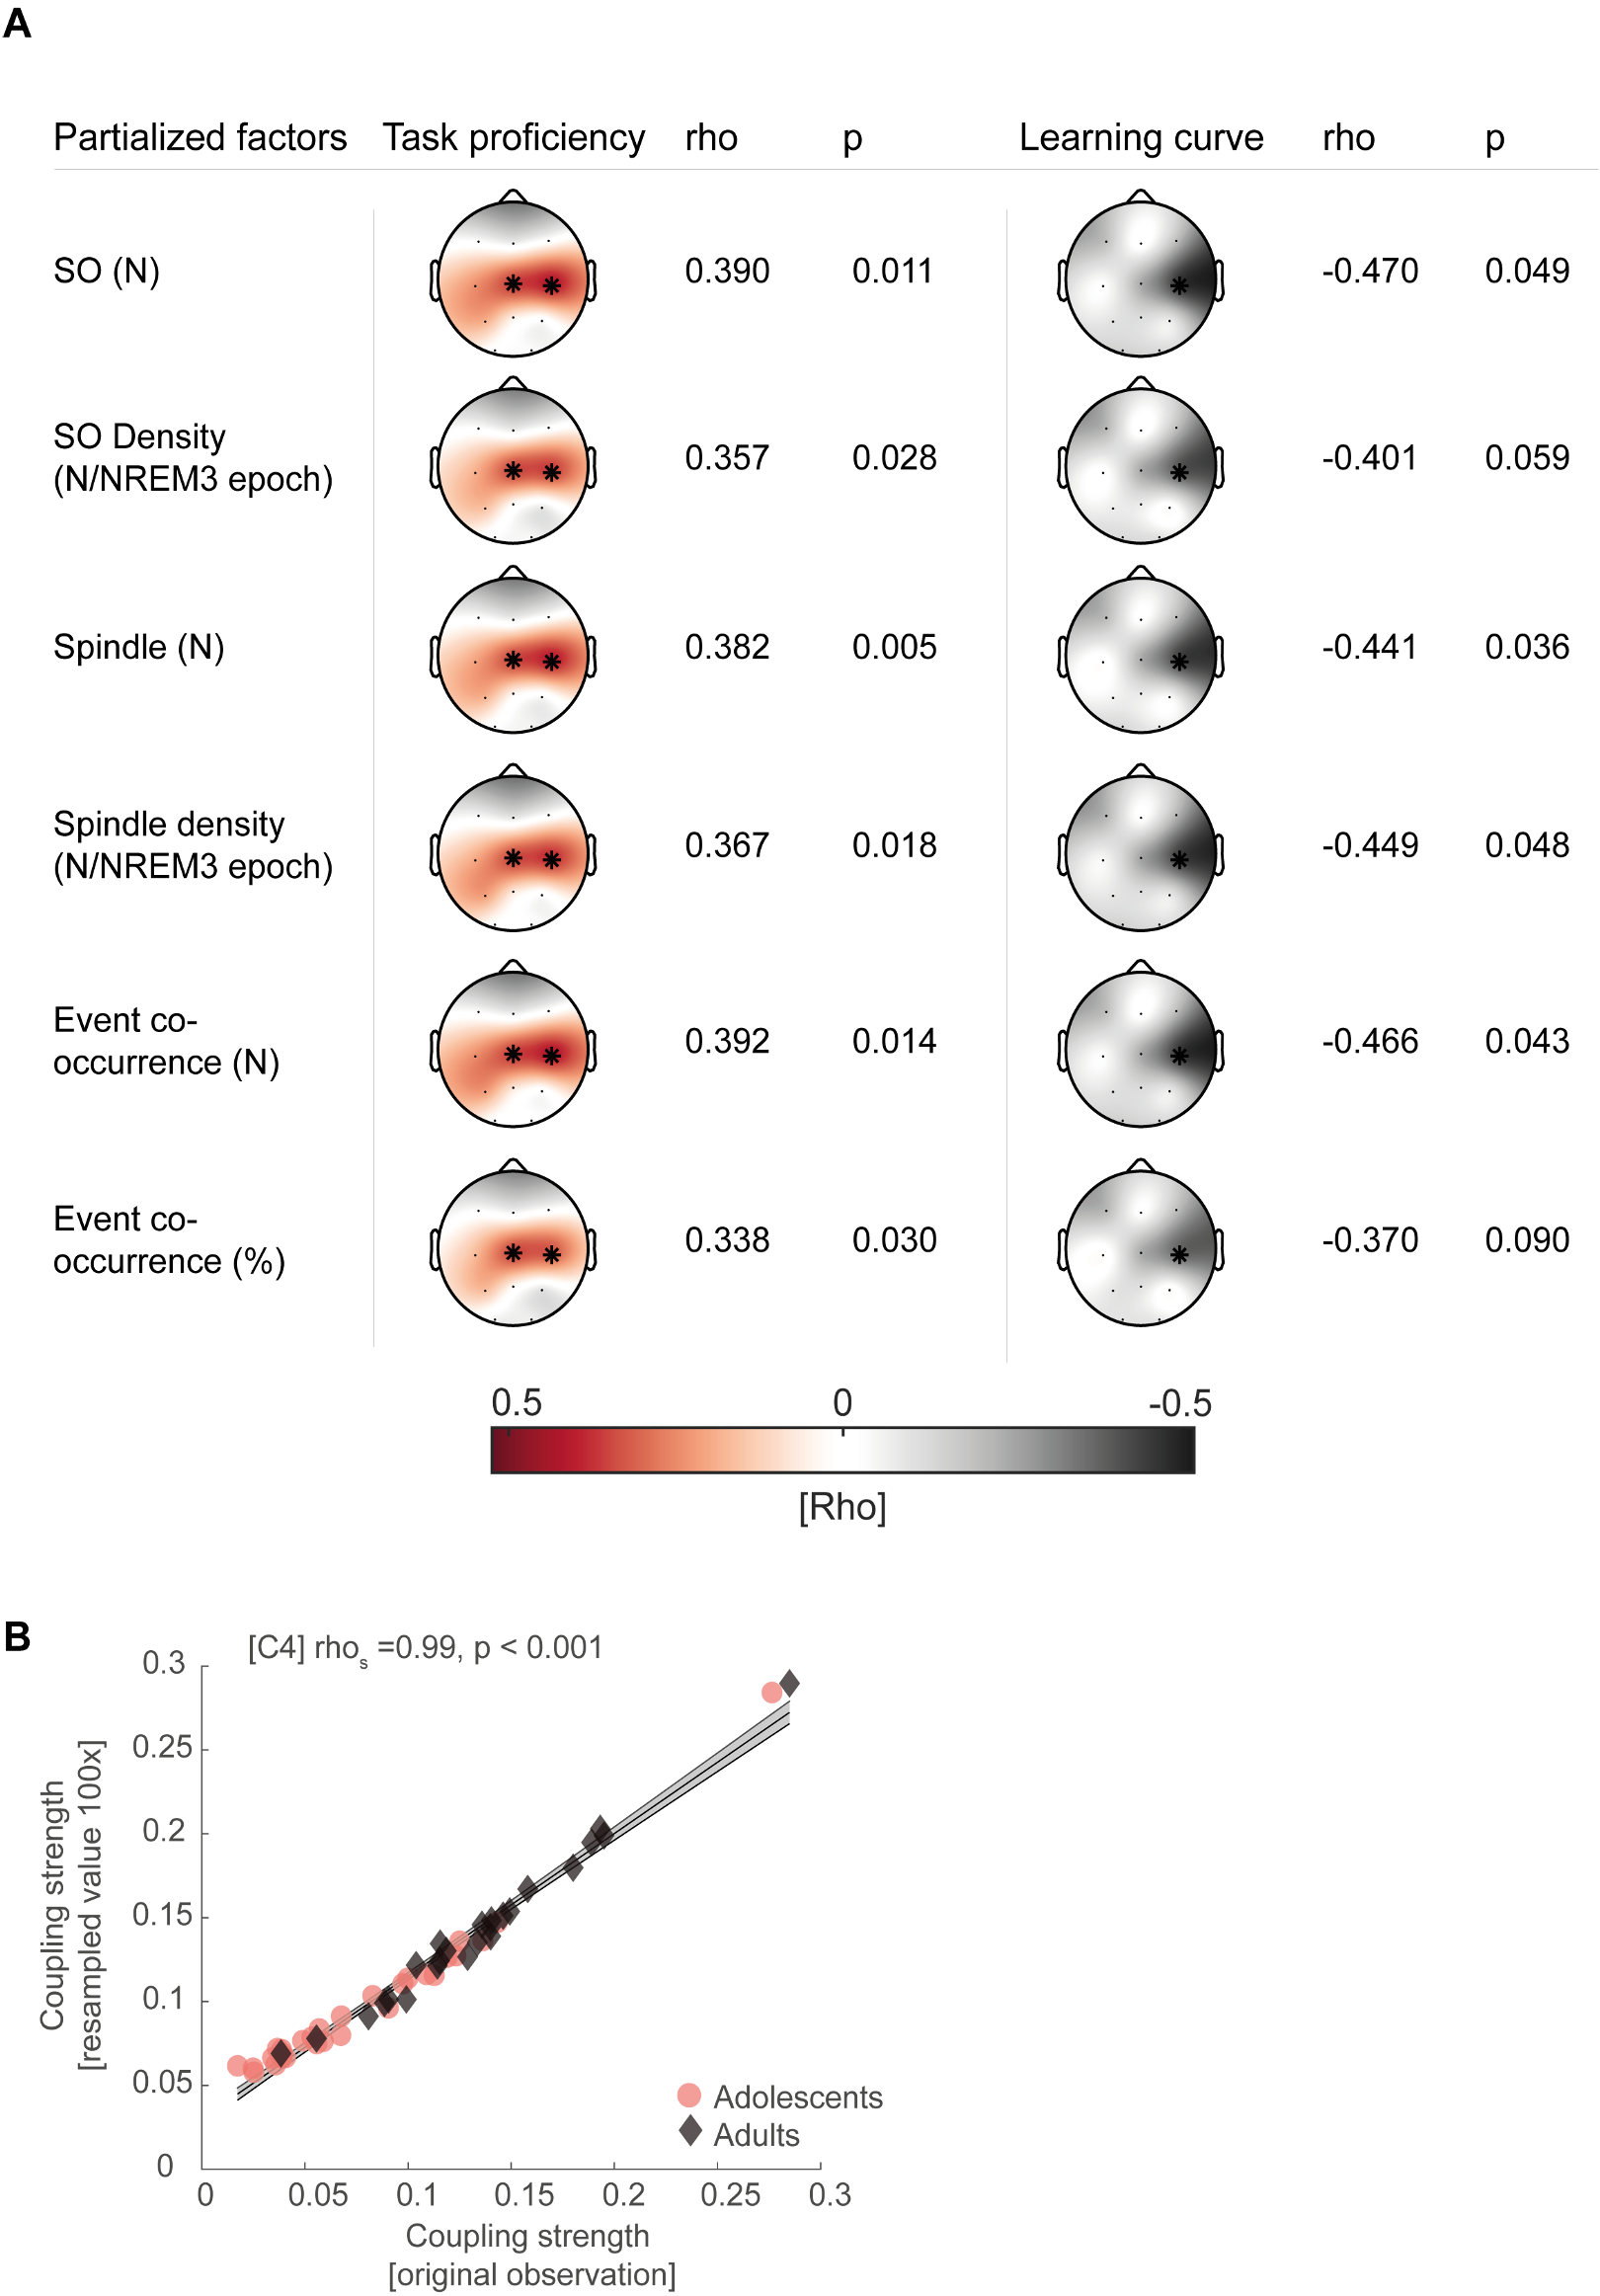
(A) Summary of cluster-corrected partial correlations of coupling strength with task proficiency (left) and learning curve (right) controlling SO/spindle descriptive measures at critical electrode C4. Asterisks indicate location of the detected cluster. The pattern of initial results remained highly stable. (B) Spearman correlation between resampled coupling strength (N = 200, 100 iterations) and original observation of coupling strength for adolescents (red circles) and adults (black diamonds), indicating that coupling strength is not influenced by spindle event number if at least 200 events are present. Grey-shaded area indicates 95% confidence intervals of the robust trend line.
We now provide general sleep descriptives (Table R4 & R5) in the revised version of the manuscript as Supplementary file – table 2 & table 6. These data are referred to in the results section (page 6, lines 101 – 105):
"Polysomnography (PSG) was recorded during an adaptation night and during the respective sleep retention interval (i.e. learning night) except for the adult wake-first group (for sleep architecture descriptive parameters of the adaptation night and learning night as well as for adolescents and adults see Supplementary file – table 1 & 2)."
And (page 15, lines 311 – 318):
"Furthermore, given that we only recorded polysomnography for the adults in the sleep first group and that adolescents in the wake first group showed enhanced task proficiency at the time point of the sleep retention interval due to additional training (Figure 3 – figure supplement 2A), we only considered adolescents and adults of the sleep-first group to ensure a similar level of juggling experience (for summary statistics of sleep architecture and SO and spindle events of subjects that entered the correlational analyses see Supplementary file – table 6)."
The additional control analyses (Figure R7 & R8) are also now added to the revised manuscript as Figure 3 – figure supplement 3 & 4 in the results section (page 16, lines 356 – 360):
"For a summary of the reported cluster-corrected partial correlations as well as analyses controlling for differences in sleep architecture see Figure 3 – figure supplement 3. Further, we also confirmed that our correlations are not influenced by individual differences in SO and spindle event parameters (Figure 3 – figure supplement 4)."
- The authors used a partial correlations to rule out that age drove the relationship between coupling strength, learning curve and task proficiency. It seems like this analysis was done specifically for electrode C4, after having already established that coupling strength at electrode C4 correlates in general with changes in the learning curve and task proficiency. I think the claim that results were not driven by age as confounding factor would be stronger if the authors used a cluster-corrected partial correlation in the first place (just as in the main analysis).
The reviewers are correct that initially we only conducted the partial correlation for electrode C4. Following the reviewers suggestion we now additionally computed cluster-corrected partial correlations similar to our main analysis. Like in our original analyses, we found a significant positive central cluster (Figure R6A, mean rho = 0.40, p = 0.017) showing that higher coupling strength related to better task proficiency after sleep and a negative cluster-corrected correlation at C4 showing that higher coupling strength was related to flatter learning curves after sleep (Figure R6B, rho = -0.47, p = 0.049) also when controlling for age.
Figure R6
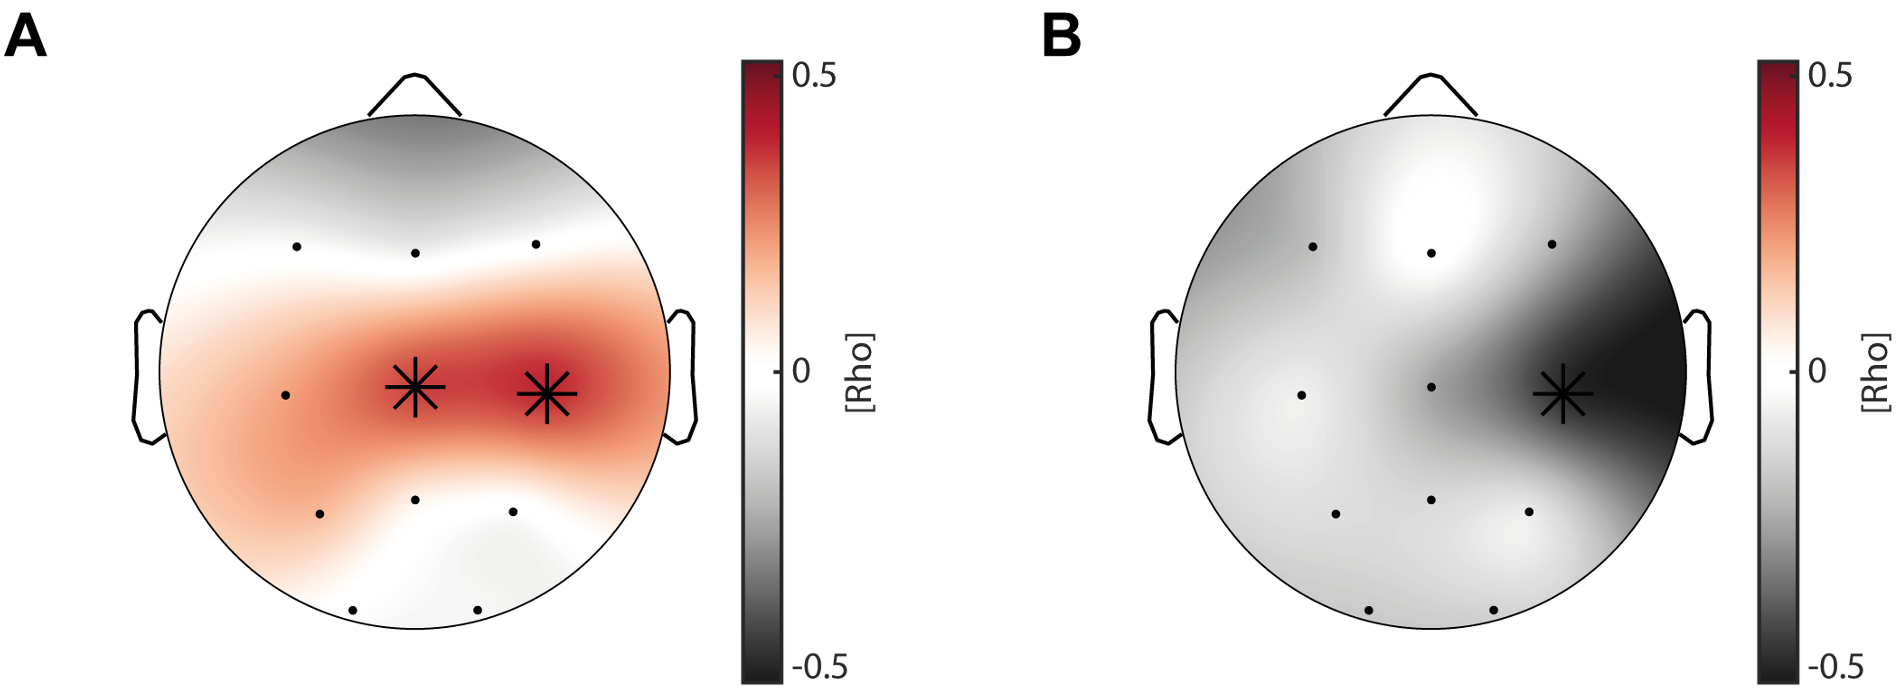
(A) Cluster-corrected partial correlation of individual coupling strength in the learning night and overnight change in task proficiency (post – pre retention) collapsed across adolescents and adults, controlling for age. Asterisks indicate cluster-corrected two-sided p < 0.05. A similar significant cluster to the original analysis (Figure 4A) emerged comprising electrodes Cz and C4. (B) Same conventions as in A. Like in the original analysis (Figure 4B) a negative correlation between coupling strength at C4 and learning curve change survived cluster-corrected partial correlations when controlling for age.
We now always report cluster-corrected partial correlations when controlling for possible confounding variables in the updated version of the manuscript (also see answer to issue #7). A summary of all computed partial correlations including Figure R6 can now be found as Figure 3 – figure supplement 3 & 4 in the revised manuscript.
Specifically we now state in the results section (page 16 – 17, lines 347 – 360):
"To rule out age as a confounding factor that could drive the relationship between coupling strength, learning curve and task proficiency in the mixed sample, we used cluster-corrected partial correlations to confirm their independence of age differences (task proficiency: mean rho = 0.40, p = 0.017; learning curve: rhos = -0.47, p = 0.049). Additionally, given that we found that juggling performance could underlie a circadian modulation we controlled for individual differences in alertness between subjects due to having just slept. We partialed out the mean PVT reaction time before the juggling performance test after sleep from the original analyses and found that our results remained stable (task proficiency: mean rho = 0.37, p = 0.025; learning curve: rhos = -0.49, p = 0.040). For a summary of the reported cluster-corrected partial correlations as well as analyses controlling for differences in sleep architecture see Figure 3 – figure supplement 3. Further, we also confirmed that our correlations are not influenced by individual differences in SO and spindle event parameters (Figure 3 – figure supplement 4)."
And in the methods section (page 35, lines 813 – 814):
"To control for possible confounding factors we computed cluster-corrected partial rank correlations (Figure 3 – figure supplement 3 and 4)."
References
Aru, J., Aru, J., Priesemann, V., Wibral, M., Lana, L., Pipa, G., Singer, W. & Vicente, R. (2015) Untangling cross-frequency coupling in neuroscience. Curr Opin Neurobiol, 31, 51-61.
Bothe, K., Hirschauer, F., Wiesinger, H. P., Edfelder, J., Gruber, G., Birklbauer, J. & Hoedlmoser, K. (2019) The impact of sleep on complex gross-motor adaptation in adolescents. Journal of Sleep Research, 28(4).
Bothe, K., Hirschauer, F., Wiesinger, H. P., Edfelder, J. M., Gruber, G., Hoedlmoser, K. & Birklbauer, J. (2020) Gross motor adaptation benefits from sleep after training. J Sleep Res, 29(5), e12961.
Campbell, I. G. & Feinberg, I. (2016) Maturational Patterns of Sigma Frequency Power Across Childhood and Adolescence: A Longitudinal Study. Sleep, 39(1), 193-201.
Dayan, E. & Cohen, L. G. (2011) Neuroplasticity subserving motor skill learning. Neuron, 72(3), 443-54. De Gennaro, L. & Ferrara, M. (2003) Sleep spindles: an overview. Sleep Med Rev, 7(5), 423-40.
De Gennaro, L., Ferrara, M., Vecchio, F., Curcio, G. & Bertini, M. (2005) An electroencephalographic fingerprint of human sleep. Neuroimage, 26(1), 114-22.
Dinges, D. F., Pack, F., Williams, K., Gillen, K. A., Powell, J. W., Ott, G. E., Aptowicz, C. & Pack, A. I. (1997) Cumulative sleepiness, mood disturbance, and psychomotor vigilance performance decrements during a week of sleep restricted to 4-5 hours per night. Sleep, 20(4), 267-77.
Dinges, D. F. & Powell, J. W. (1985) Microcomputer Analyses of Performance on a Portable, Simple Visual Rt Task during Sustained Operations. Behavior Research Methods Instruments & Computers, 17(6), 652-655.
Eichenlaub, J. B., Biswal, S., Peled, N., Rivilis, N., Golby, A. J., Lee, J. W., Westover, M. B., Halgren, E. & Cash, S. S. (2020) Reactivation of Motor-Related Gamma Activity in Human NREM Sleep. Front Neurosci, 14, 449.
Feinberg, I. & Campbell, I. G. (2013) Longitudinal sleep EEG trajectories indicate complex patterns of adolescent brain maturation. American Journal of Physiology - Regulatory, Integrative and Comparative Physiology, 304(4), R296-303.
Hahn, M., Heib, D., Schabus, M., Hoedlmoser, K. & Helfrich, R. F. (2020) Slow oscillation-spindle coupling predicts enhanced memory formation from childhood to adolescence. Elife, 9.
Helfrich, R. F., Lendner, J. D. & Knight, R. T. (2021) Aperiodic sleep networks promote memory consolidation. Trends Cogn Sci.
Helfrich, R. F., Lendner, J. D., Mander, B. A., Guillen, H., Paff, M., Mnatsakanyan, L., Vadera, S., Walker, M. P., Lin, J. J. & T., K. R. (2019) Bidirectional prefrontal-hippocampal dynamics organize information transfer during sleep in humans. Nature Communications, 10(1), 3572.
Helfrich, R. F., Mander, B. A., Jagust, W. J., Knight, R. T. & Walker, M. P. (2018) Old Brains Come Uncoupled in Sleep: Slow Wave-Spindle Synchrony, Brain Atrophy, and Forgetting. Neuron, 97(1), 221-230 e4.
Killgore, W. D. (2010) Effects of sleep deprivation on cognition. Prog Brain Res, 185, 105-29.
Kurth, S., Jenni, O. G., Riedner, B. A., Tononi, G., Carskadon, M. A. & Huber, R. (2010) Characteristics of sleep slow waves in children and adolescents. Sleep, 33(4), 475-80.
Maris, E. & Oostenveld, R. (2007) Nonparametric statistical testing of EEG- and MEG-data. J Neurosci Methods, 164(1), 177-90.
Muehlroth, B. E., Sander, M. C., Fandakova, Y., Grandy, T. H., Rasch, B., Shing, Y. L. & Werkle-Bergner, M. (2019) Precise Slow Oscillation-Spindle Coupling Promotes Memory Consolidation in Younger and Older Adults. Sci Rep, 9(1), 1940.
Muehlroth, B. E. & Werkle-Bergner, M. (2020) Understanding the interplay of sleep and aging: Methodological challenges. Psychophysiology, 57(3), e13523.
Niethard, N., Ngo, H. V. V., Ehrlich, I. & Born, J. (2018) Cortical circuit activity underlying sleep slow oscillations and spindles. Proceedings of the National Academy of Sciences of the United States of America, 115(39), E9220-E9229.
Purcell, S. M., Manoach, D. S., Demanuele, C., Cade, B. E., Mariani, S., Cox, R., Panagiotaropoulou, G., Saxena, R., Pan, J. Q., Smoller, J. W., Redline, S. & Stickgold, R. (2017) Characterizing sleep spindles in 11,630 individuals from the National Sleep Research Resource. Nature Communications, 8, 15930.
Van Dongen, H. P., Maislin, G., Mullington, J. M. & Dinges, D. F. (2003) The cumulative cost of additional wakefulness: dose-response effects on neurobehavioral functions and sleep physiology from chronic sleep restriction and total sleep deprivation. Sleep, 26(2), 117-26.
Wilhelm, I., Metzkow-Meszaros, M., Knapp, S. & Born, J. (2012) Sleep-dependent consolidation of procedural motor memories in children and adults: the pre-sleep level of performance matters. Developmental Science, 15(4), 506-15.
Winer, J. R., Mander, B. A., Helfrich, R. F., Maass, A., Harrison, T. M., Baker, S. L., Knight, R. T., Jagust, W. J. & Walker, M. P. (2019) Sleep as a potential biomarker of tau and beta-amyloid burden in the human brain. J Neurosci.
-
Reviewer #1 (Public Review):
Overall, the authors have done a nice job covering the relevant literature, presenting a story out of complicated data, and performing many thoughtful analyses.
However, I believe the paper requires quite major revisions.
Major issues:
I do not believe the current results present a clear, comprehensible story about sleep and motor memory consolidation. As presented, sleep predicts an increase in the subsequent learning curve, but there is a negative relationship between learning curve and task proficiency change (which is, as far as I can tell, similar to "memory retention"). This makes it seem as if sleep predicts more forgetting on initial trials within the subsequent block (or worse memory retention) - is this true? Regardless of whether it is statistically true, there appears another story in these data …
Reviewer #1 (Public Review):
Overall, the authors have done a nice job covering the relevant literature, presenting a story out of complicated data, and performing many thoughtful analyses.
However, I believe the paper requires quite major revisions.
Major issues:
I do not believe the current results present a clear, comprehensible story about sleep and motor memory consolidation. As presented, sleep predicts an increase in the subsequent learning curve, but there is a negative relationship between learning curve and task proficiency change (which is, as far as I can tell, similar to "memory retention"). This makes it seem as if sleep predicts more forgetting on initial trials within the subsequent block (or worse memory retention) - is this true? Regardless of whether it is statistically true, there appears another story in these data that is being sacrificed to fit a story about sleep. To my eye, the results may first and foremost tell a circadian (rather than sleep) story. Examining the data in Figure 2A and 2B, it appears that every AM learning period has a higher learning curve (slope) than every PM period. While this could, of course, be due to having just slept, the main story gleaned from such a result is not a sleep effect on retention, which has been the emphasis on motor memory consolidation research in the last couple of decades, but on new learning. The fact that this effect appears present in the first session (juggling blocks 1-3 in adolescents and blocks 1-5 in adults) makes this seem the more likely story here, since it has less to do with "preparing one to re-learn" and more to do with just learning and when that learning is optimal. But even if it does not reach statistical significance in the first session alone, it remains a concern and, in my opinion, should be considered a focus in the manuscript unless the authors can devise a reason to definitively rule it out.
Here is how I recommend the authors proceed on this point: include all sessions from all subjects into a mixed effect model, predicting the slope of the learning curve with time of day and age group as fixed effects and subjects as random effects:
learning curve slope ~ AM/PM [AM (0) or PM (1)] + age [adolescent (0) or adult (1)] + (1|subject)
...or something similar with other regressors of interest. If this is significant for AM/PM status, they should re-try the analysis using only the first session. If this is significant, then a sleep-centric story cannot be defended here at all, in my opinion. If it is not (which could simply result from low power, but the authors could decide this), the authors should decide if they think they can rule out circadian effects and proceed accordingly. I should note that, while to many, a sleep story would be more interesting or compelling, that is not my opinion, and I would not solely opt to reject this paper if it centered a time-of-day story instead.
The authors need to work out precisely what is happening in the behavior here, and let the physiology follow that story. They should allow themselves to consider very major revisions (and drop the physiology) if that is most consistent with the data. As presented, I am very unclear of what to take away from the study.
If indeed the authors keep the sleep aspect of this story, here are some comments regarding the physiology. The authors present several nice analyses in Figure 3. However, given the lack of behavioral difference between adolescents and adults (Fig 2D), they combine the groups when investigating behavior-physiology relationships. In some ways, then, Figure 3 has extraneous details to the point of motor learning and retention, and I believe the paper would benefit from more focus. If the authors keep their sleep story, I believe Figure 3 and 4 should be combined and some current figure panels in Figure 3 should be removed or moved to the supplementary information.
Why did the authors use Spearman rather than Pearson correlations in Figure 4? Was it to reduce the influence of the outlier subject? They should minimally clarify and justify this, since it is less conventional in this line of research. And it would be useful to know if the relationship is significant with Pearson correlations when robust regression is applied. I see the authors are using MATLAB, and the robustfit toolbox (https://www.mathworks.com/help/stats/robustfit.html) is a simple way to address this issue.
Additionally, with only a single night of recording data, it is impossible to disentangle possible trait-based sleep characteristics (e.g., Subject 1 has high SO-spindle coupling in general and retains motor memories well, but these are independent of each other) from a specific, state-based account (e.g., Subject 1's high SO-spindle coupling on night 1 specifically led to their improved retention or change in learning, etc., and this is unrelated to their general SO-spindle coupling or motor performance abilities). Clearly, many studies face this limitation, but this should be acknowledged.
-
Reviewer #2 (Public Review):
In this study Hahn and colleagues investigate the role of Slow-oscillation spindle coupling for motor memory consolidation and the impact of brain maturation on these interactions. The authors employed a real-life gross-motor task, where adolescents and adults learned to juggle. They demonstrate that during post-learning sleep SO-spindles are stronger coupled in adults as compared to adolescents. The authors further show, that the strength of SO-spindle coupling correlates with overnight changes in the learning curve and task proficiency, indicating a role of SO-spindle coupling in motor memory consolidation.
Overall, the topic and the results of the present study are interesting and timely. The authors employed state of the art analyse carefully taking the general variability of oscillatory features into …Reviewer #2 (Public Review):
In this study Hahn and colleagues investigate the role of Slow-oscillation spindle coupling for motor memory consolidation and the impact of brain maturation on these interactions. The authors employed a real-life gross-motor task, where adolescents and adults learned to juggle. They demonstrate that during post-learning sleep SO-spindles are stronger coupled in adults as compared to adolescents. The authors further show, that the strength of SO-spindle coupling correlates with overnight changes in the learning curve and task proficiency, indicating a role of SO-spindle coupling in motor memory consolidation.
Overall, the topic and the results of the present study are interesting and timely. The authors employed state of the art analyse carefully taking the general variability of oscillatory features into account. It also has to be acknowledged that the authors moved away from using rather artificial lab-tasks to study the consolidation of motor memories (as it is standard in the field), adding ecological validity to their findings. However, some features of their analyses need further clarification.Supporting and extending previous work of the authors (Hahn et al, 2020), SO-spindle coupling over centro-parietal areas was stronger in adults as compared to adolescents. Despite these differences in the EEG results the authors collapsed the data of adults and adolescents for their correlational analyses (Fig. 4a and 4b). Why would the authors think that this procedure is viable (also given the fact that different EEG systems were used to record the data)?
The authors might want to explicitly show that the reported correlations (with regards to both learning curve and task proficiency change) are not driven by any outliers.
The sleep data of all participants (thus from both sleep first and wake first) were used to determine the features of SO-spindle coupling in adolescents and adults. Were there any differences between groups (sleep first vs. wake first)? This might be in interesting in general but especially because only data of the sleep first group entered the subsequent correlational analyses.
To allow a more comprehensive assessment of the underlying data information with regards to general sleep descriptives (minutes, per cent of time spent in different sleep stages, overall sleep time etc.) as well as related to SOs, spindles and coupled events (e.g. number, density etc.) would be needed.
The authors used a partial correlations to rule out that age drove the relationship between coupling strength, learning curve and task proficiency. It seems like this analysis was done specifically for electrode C4, after having already established that coupling strength at electrode C4 correlates in general with changes in the learning curve and task proficiency. I think the claim that results were not driven by age as confounding factor would be stronger if the authors used a cluster-corrected partial correlation in the first place (just as in the main analysis).
-
