The photosensitive phase acts as a sensitive window for seasonal multisensory neuroplasticity in male and female starlings
Curation statements for this article:-
Curated by eLife

Evaluation Summary:
This paper will be of interest to a diverse range of scientist as the questions span animal behavior, neuroscience and sex differences in brain-behavior relations. The study used non-invasive brain imaging to track large changes in structures involved in controlling communication between brain regions. The data reveal exciting sex-specific changes in key brain regions involved in learning and memory. The study is well designed, and the key claims of the manuscript appear to be well supported by the data. The imaging approaches employed are thoughtful and rigorous.
(This preprint has been reviewed by eLife. We include the public reviews from the reviewers here; the authors also receive private feedback with suggested changes to the manuscript. Reviewer #1 and Reviewer #2 agreed to share their names with the authors.)
This article has been Reviewed by the following groups
Discuss this preprint
Start a discussion What are Sciety discussions?Listed in
- Evaluated articles (eLife)
Abstract
Traditionally, research unraveling seasonal neuroplasticity in songbirds has focused on the male song control system and testosterone. We longitudinally monitored the song and neuroplasticity in male and female starlings during multiple photoperiods using Diffusion Tensor and Fixel-Based techniques. These exploratory data-driven whole-brain methods resulted in a population-based tractogram uncovering microstructural sexual dimorphisms in the song control system and beyond. Male brains showed microstructural hemispheric asymmetries, whereas females had higher interhemispheric connectivity, which could not be attributed to brain size differences. Only females with large brains sing but differ from males in their song behavior by showing involvement of the hippocampus. Both sexes experienced multisensory neuroplasticity in the song control, auditory and visual system, and the cerebellum, mainly during the photosensitive period. This period with low gonadal hormones might represent a ‘sensitive window’ during which different sensory and motor systems in telencephalon and cerebellum can be seasonally re-shaped in both sexes.
Article activity feed
-

Author Response:
Reviewer #1:
The manuscript by Jasmien Orije and colleagues has used advanced Diffusion Tensor and Fixel-Based brain imaging methods to examine brain plasticity in male and female European starlings. Songbirds provide a unique animal model to interrogate how the brain controls a complex, learned behaviour: song. The authors used DT imaging to identify known and uncover new structural changes in grey and white matter in male and female brains. The choice of the European starling as a model songbird was smart as this bird has a larger brain to facilitate anatomical localization, clear sex differences in song behavior and well-characterized photoperiod-induced changes in reproductive state. The authors are commended for using both male and female starlings. The photoperiodic treatment used was optimal to capture the key …
Author Response:
Reviewer #1:
The manuscript by Jasmien Orije and colleagues has used advanced Diffusion Tensor and Fixel-Based brain imaging methods to examine brain plasticity in male and female European starlings. Songbirds provide a unique animal model to interrogate how the brain controls a complex, learned behaviour: song. The authors used DT imaging to identify known and uncover new structural changes in grey and white matter in male and female brains. The choice of the European starling as a model songbird was smart as this bird has a larger brain to facilitate anatomical localization, clear sex differences in song behavior and well-characterized photoperiod-induced changes in reproductive state. The authors are commended for using both male and female starlings. The photoperiodic treatment used was optimal to capture the key changes in physiological state. The high sampling frequency provides the capability to monitor key changes in physiology, behaviour and brain anatomy. Two exciting findings was the increased role of cerebellum and hippocampal recruitment in female birds engaged in singing behaviour. The development of non-invasive, multi-sampling brain imaging in songbirds provides a major advancement for studies that seek to understand the mechanism that control the motivation and production of singing behavior. The methods described herein set the foundation to develop targeted hypotheses to study how the vocal learning, such as language, is processed in discrete brain regions. Overall, the data presented in the study is extensive and includes a comprehensive analyses of regulated changes in brain microstructural plasticity in male and female songbirds.
Reviewer #2:
Orije et al. employed diffusion weighted imaging to longitudinally monitor the plasticity of the song control system during multiple photoperiods in male and female starlings. The authors found that both sexes experience similar seasonal neuroplasticity in multisensory systems and cerebellum during the photosensitive phase. The authors' findings are convincing and rely on a set of well-designed longitudinal investigations encompassing previously validated imaging methods. The authors' identification of a putative sensitive window during which sensory and motor systems can be seasonally re-shaped in both sexes is an interesting finding that advances our understanding of the neural basis of seasonal structural neuroplasticity in songbirds.
Overall, this is a strong paper whose major strengths are:
- The longitudinal and non-invasive measure of plasticity employed
- The use of two complementary MR assays of white matter microplasticity
- The careful experimental design
- The sound and balanced interpretation of the imaging findings
I do not have any major criticism but just a few minor suggestions:
- Pp 6-7. While the comparative description of canonical DTI with respect to fixel-based analysis is well written and of interest to readers with formal training in MR imaging, I found this entire section (and especially the paragraphs in page 7) too technical and out of context in a manuscript that is otherwise fundamentally about neuroplasticity in song birds. The accessibility of this manuscript to non-MR experts could be improved by moving this paragraph into the methods section, or by including it as supplemental material.
The main purpose of this section was to introduce and explain the diffusion parameters which are used throughout the rest of the paper. Furthermore, we wanted to familiarize the reader with the concept of the population based template and the different structures that can be visualized by them. We agree that the technical details might have distracted from this main message. Therefore, we have trimmed the technical details out of this section and left a short explanation of the biological relevance of the different diffusion parameters and the anatomical structures visible on the population template. The technical details that were taken out are now a part of the material and methods section.
The section now reads as follows:
In the current study, we analyzed the DWI scans in two distinct ways: 1) using the common approach of diffusion tensor derived metrics such as fractional anisotropy (FA) and; 2) using a novel method of fiber orientation distribution (FOD) derived fixel-based analysis. Both techniques infer the microstructural information based on the diffusion of water molecules, but they are conceptually different (table 1). Common DTI analysis extracts for each voxel several diffusion parameters, which are sensitive to various microstructural changes in both grey and white matter specified in table 1. Fixel-based analysis on the other hand explores both microscopic changes in apparent fiber density (FD) or macroscopic changes in fiber-bundle cross-section (log FC) (table 1). Positive fiber-bundle cross-section values indicate expansion, whereas negative values reflect shrinkage of a fiber bundle relative to the template (Raffelt, Tournier et al. 2017).
A population-based template created for the fixel-based analysis can be used as a study based atlas in which many of the avian anatomical structures can be identified (figure 2). We recognize many of the white matter structures such as the different lamina, occipito-mesencephalic tract (OM) and optic tract (TrO) among others. Interestingly, many of the nuclei within the song control system (i.e. HVC, robust nucleus of the arcopallium (RA), lateral magnocellular nucleus of the anterior nidopallium (LMAN), and Area X), auditory system (i.e. intercollicular nucleus complex, nucleus ovoidalis) and visual system (i.e. entopallium, nucleus rotundus) are identified by the empty spaces between tracts. The applied fixel-based approach is inherently sensitive to changes in white matter and cannot report on the microstructure within grey matter like brain nuclei; but rather sheds light on the fiber tracts surrounding and interconnecting them. As such, it provides an excellent tool to investigate neuroplasticity of different brain networks, and in the case of a nodular song control system focusing on changes in the fibers surrounding the song control nuclei, referred to as HVC surr, RA surr and Area X surr.
- Similarly, many sections, especially results, are in my opinion too detailed and analytical. While the employed description has the benefit of being systematic and rigorous, the ensuing narrative tends to be very technical and not easily interpretable by non experts. I think the manuscript may be substantially shortened (by at least 20% e.g. by removing overly technical or analytical descriptions of all results and regions affected) without losing its appeal and impact, but instead gaining in strength and focus especially if the new result narrative were aimed to more directly address the interesting set of questions the authors define in the introductory sections.
We rewrote the result section, taking out the statistic reporting when it was also reported in a figure to reduce the bulk of this section and make it more readable. We made some of the descriptions of the regions affected more approachable by replacing it with parts of the discussion. This way we incorporated some of the explanations why certain findings are unexpected or relevant, as suggested by reviewer #3. Parts of text that were originally in the discussion are indicated in purple.
- The possible effect of brain size has been elegantly controlled by using a medial split approach. Have the authors considered using tensor-based morphometry (i.e. using the 3D RARE scans they acquired) to account for where in the brain the small differences in brain size occur? That could be more informative and sensitive than a whole-brain volume quantification.
We have taken into consideration to add tensor-based morphometry, but we feel that log FC calculated with MrTrix can provide a similar account of the localization of these brain differences. Both methods are based on the Jacobean warps created between the individual images and the population template. They only differ in the starting images they use (3D RARE images in tensor-based morphometry or diffusion weighted images in log FC metric of MrTrix3) and the fact that MrTrix3 limits itself to the volume changes along a certain tract.
The log FC difference in figure 4 gives a similar account of the differences in brain size between both sexes. Additionally, figure 6 indicates the log FC differences between small and large brain birds.
- I think Figures Fig. 3 and Fig. 4 may benefit from a ROI-based quantification of parameters of interests across groups (similar to what has been done for Fig. 7 and its related Fig. 8). This could help readers assess the biological relevance of the parameter mapped. For instance, in Fig. 3, most FA differences are taking place in low FA (i.e. gray matter dense?) regions.
We supplied the figures with extracted ROI-based parameters of figure 3 and figure 4. In line with this reasoning we also added the same kind of supplementary figures for figure 5 and 6.
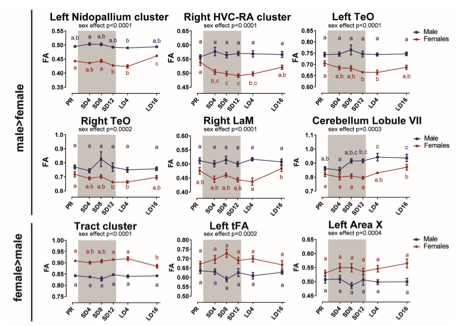
Figure 3 - figure supplement 1: Overview of the fractional anisotropy (FA) changes over time extracted from the relevant ROI-based clusters with significant sex differences. The grey area indicates the entire photosensitive period of short days (8L:16D). Significant sex differences are reported with their p-value under the respective ROI-based cluster. Different letters denote significant differences by comparison with each other in post-hoc t-tests with p < 0.05 (Tukey’s HSD correction for multiple comparisons) comparing the different time points to each other. If two time points share the same letter, the fractional anisotropy values are not significantly different from each other.
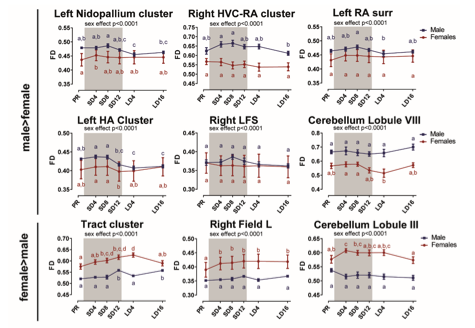
Figure 4 – figure supplement 2: Overview of the fiber density (FD) changes over time extracted from the relevant ROI-based clusters with significant sex differences. The grey area indicates the entire photosensitive period of short days (8L:16D). Significant sex differences are reported with their p-value under the respective ROI-based cluster. Different letters denote significant differences by comparison with each other in post-hoc t-tests with p < 0.05 (Tukey’s HSD correction for multiple comparisons) comparing the different time points to each other. If two time points share the same letter, the FD values are not significantly different from each other. Abbreviations: surr, surroundings.
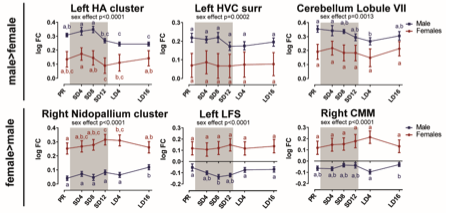
Figure 4 –figure supplement 3: Overview of the fiber-bundle cross-section (log FC) changes over time extracted from the relevant ROI-based clusters with significant sex differences. The grey area indicates the entire photosensitive period of short days (8L:16D). Significant sex differences are reported with their p-value under the respective ROI-based cluster. Different letters denote significant differences by comparison with each other in post-hoc t-tests with p < 0.05 (Tukey’s HSD correction for multiple comparisons) comparing the different time points to each other. If two time points share the same letter, the log FC values are not significantly different from each other. Abbreviations: surr, surroundings.
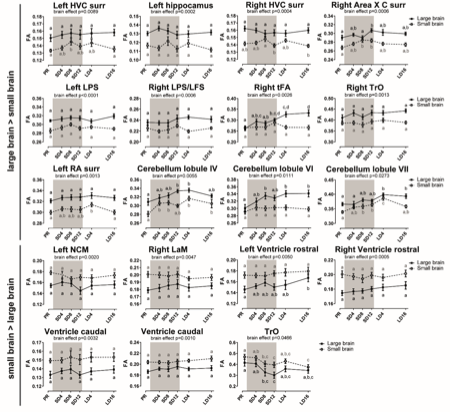
Figure 5 – figure supplement 1: Overview of the fractional anisotropy (FA) changes over time in extracted from the relevant ROI-based clusters with significant differences in brain size. The grey area indicates the entire photosensitive period of short days (8L:16D). Significant brain size differences are reported with their p-value under the respective ROI-based cluster. Different letters denote significant differences by comparison with each other in post-hoc t-tests with p < 0.05 (Tukey’s HSD correction for multiple comparisons) comparing the different time points to each other. If two time points share the same letter, the fractional anisotropy values are not significantly different from each other. Abbreviations: C, caudal; surr, surroundings.
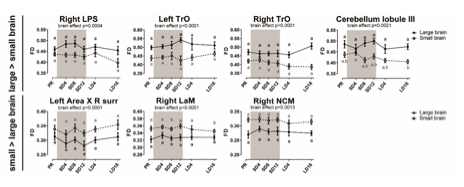
Figure 6- figure supplement 2: Overview of the fiber density (FD) changes over time in extracted from the relevant ROI-based clusters with significant differences in brain size. The grey area indicates the entire photosensitive period of short days (8L:16D). Significant brain size differences are reported with their p-value under the respective ROI-based cluster. Different letters denote significant differences by comparison with each other in post-hoc t-tests with p < 0.05 (Tukey’s HSD correction for multiple comparisons) comparing the different time points to each other. If two time points share the same letter, the FD values are not significantly different from each other. Abbreviations: C, caudal; surr, surroundings.
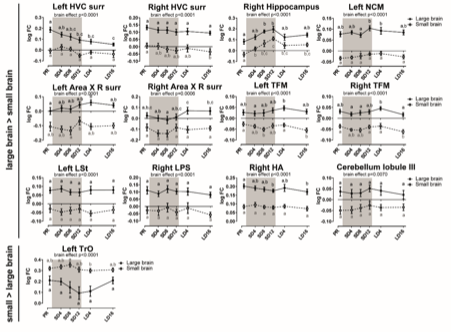
Figure 6- figure supplement 3: Overview of the fiber-bundle cross-section (log FC) changes over time in extracted from the relevant ROI-based clusters with significant differences in brain size. The grey area indicates the entire photosensitive period of short days (8L:16D). Significant brain size differences are reported with their p-value under the respective ROI-based cluster. Different letters denote significant differences by comparison with each other in post-hoc t-tests with p < 0.05 (Tukey’s HSD correction for multiple comparisons) comparing the different time points to each other. If two time points share the same letter, the log FC values are not significantly different from each other. Abbreviations: C, caudal; surr, surroundings.
- In Abstract: "We longitudinally monitored the song and neuroplasticity in male.." Perhaps something should be specified after the "the song"? Did the authors mean "the neuroplasticity of song system"?
No, this is not what we meant, we monitor song behavior and neuroplasticity independently. In our study, we do not limit ourselves to the neuroplasticity of the song system, but instead use a whole brain approach. The monitoring of the song behavior in itself might be useful for other songbird researchers.
We clarified this in the abstract as follows:
We longitudinally monitored the song behavior and neuroplasticity in male and female starlings during multiple photoperiods using Diffusion Tensor and Fixel-Based techniques.
Reviewer #3:
In their paper, Orije et al used MRI imaging to study sexual dimorphisms in brains of European starlings during multiple photoperiods and how this seasonal neuroplasticity is dependent in brain size, song rates and hormonal levels. The authors main findings include difference in hemispheric asymmetries between the sexes, multisensory neuroplasticity in the song control system and beyond it in both sexes and some dependence of singing behavior in females with large brains. The authors use different methods to quantify the changes in the MRI data to support various possible mechanisms that could be the basis of the differences they see. They also record the birds' song rates and hormonal levels to correlate the neural findings with biological relevant variables.
The analysis is very impressive, taking into account the massive data set that was recorded and processed. Whole-brain data driven analysis prevented the authors from being biased to well-known sexually dimorphic brain areas. Sampling of a large number of subjects across many time points allowed for averaging in cases where individual measurements could not show statistical significance. The conclusions of the paper are mostly well supported by data (except of some confounds that the authors mention in the text). However, the extensive statistically significant results that are described in the paper, make it hard to follow at times.
- In the introduction the authors mention the pre optic area as a mediator for increase singing and therefore seasonal neuroplasticity. Did the authors find any differences in that area or other well know nuclei that are involved in courtship (PAG for example)?
Interestingly, we did not detect any seasonal changes in the pre-optic area or PAG. Whereas prior studies reported volume changes in the POM within 1-2 days after testosterone administration in canaries (Shevchouk, Ball et al. 2019). In male European starlings, POM volumes changed seasonally, although this seems to depend on whether or not the males possessed a nest box (Riters, Eens et al. 2000). In our setup, our starlings are not provided with nest boxes. The lack of seasonal change in POM could have a biological reason, besides the limitations of our methodology. Since these are small regions and are grey matter like structures, they are less likely to be picked up with our diffusion MRI methods.
- Following the first comment, what is the minimum volume of an area of interest that could be detected using the voxel analysis?
The up-sampled voxel size is (0.1750.1750.175) mm3. In the voxel-based statistical analysis a significance threshold is set at a cluster size of minimum 10 voxels: 0.05 mm3.
- It would be useful to have a figure describing the song system in European starlings and how the auditory areas, the cerebellum and the hippocampus are connected to it, before describing the results. It would make it easier for the broader community to make a better sense of the results.
An additional figure was added to the introduction to give a schematic overview of the song control system, the auditory system and the proposed cerebellar and hippocampal projections. This scheme includes both a 2D, and a 3D representation as well as a movie of the 3D representation of the different nuclei and the tractography.
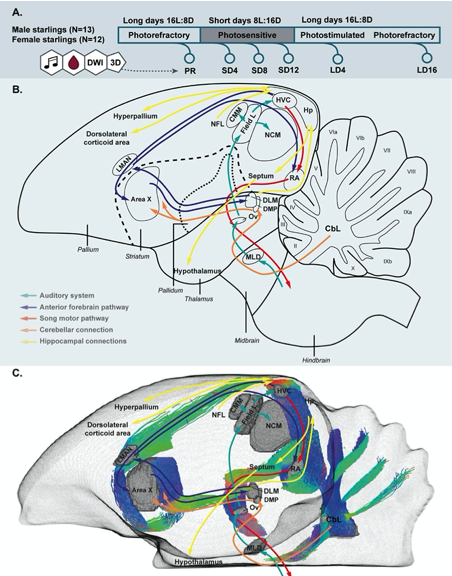
Figure 1: Simplified overview of the experimental setup (A), schematic overview of the song control and auditory system of the songbird brain and the cerebellar and hippocampal connections to the rest of the brain (B) and unilateral DWI-based 3D representation of the different nuclei and the interconnecting tracts as deduced from the tractogram (C). Male and female starlings were measured repeatedly as they went through different photoperiods. At each time point, their songs were recorded, blood samples were collected and T2-weighted 3D anatomical and diffusion weighted images (DWI) were acquired. The 3D anatomical images were used to extract whole brain volume (A). The song control system is subdivided in the anterior forebrain pathway (blue arrows) and the song motor pathway (red arrows). The auditory pathway is indicated by green arrows. The orange arrows indicate the connection of the lateral cerebellar nucleus (CbL) to the dorsal thalamic region further connecting to the song control system as suggested by (Person, Gale et al. 2008, Pidoux, Le Blanc et al. 2018) (B,C). Nuclei in (C) are indicated in grey, the tractogram is color-coded according to the standard red-green-blue code (red = left-right orientation (L-R), blue = dorso-ventral (D-V) and green = rostro-caudal (R-C)). For abbreviations see abbreviation list.
Figure 1 – figure supplement 1: Movie of the unilateral 3D representation of the different nuclei and the interconnecting tracts rotating along the vertical axis.
- In the results section the authors clearly describe which brain areas are sexually dimorphic or change during the photoperiod and what is the underlying reason for the difference. However, only in the discussion section it is clearer why some of those differences are expected or surprising. It would be useful to incorporate some of those explanations in the results section other than just having a long list of brain areas and metrics. For example, I found the involvement of visual and auditory areas in the female brain in the mating season very interesting.
Next to the reductions in technical explanation suggested by reviewer #2, We replaced some of the description of significant regions with parts of the discussion and vice versa(indicated in purple). This way we incorporated some of the explanations why certain findings are unexpected or relevant. Furthermore, we added some extra info on the reason why these changes are relevant for the visual system and the cerebellum.
In line 420: Neuroplasticity of the visual system could be relevant to prepare the birds for the breeding season, where visual cues like ultraviolet plumage colors are important for mate selection (Bennett, Cuthill et al. 1997).
In line 424: This shows that multisensory neuroplasticity is not limited to the cerebrum, but also involves the cerebellum, something that has not yet been observed in songbirds.
-
Evaluation Summary:
This paper will be of interest to a diverse range of scientist as the questions span animal behavior, neuroscience and sex differences in brain-behavior relations. The study used non-invasive brain imaging to track large changes in structures involved in controlling communication between brain regions. The data reveal exciting sex-specific changes in key brain regions involved in learning and memory. The study is well designed, and the key claims of the manuscript appear to be well supported by the data. The imaging approaches employed are thoughtful and rigorous.
(This preprint has been reviewed by eLife. We include the public reviews from the reviewers here; the authors also receive private feedback with suggested changes to the manuscript. Reviewer #1 and Reviewer #2 agreed to share their names with the authors.)
-
Reviewer #1 (Public Review):
The manuscript by Jasmien Orije and colleagues has used advanced Diffusion Tensor and Fixel-Based brain imaging methods to examine brain plasticity in male and female European starlings. Songbirds provide a unique animal model to interrogate how the brain controls a complex, learned behaviour: song. The authors used DT imaging to identify known and uncover new structural changes in grey and white matter in male and female brains. The choice of the European starling as a model songbird was smart as this bird has a larger brain to facilitate anatomical localization, clear sex differences in song behavior and well-characterized photoperiod-induced changes in reproductive state. The authors are commended for using both male and female starlings. The photoperiodic treatment used was optimal to capture the key …
Reviewer #1 (Public Review):
The manuscript by Jasmien Orije and colleagues has used advanced Diffusion Tensor and Fixel-Based brain imaging methods to examine brain plasticity in male and female European starlings. Songbirds provide a unique animal model to interrogate how the brain controls a complex, learned behaviour: song. The authors used DT imaging to identify known and uncover new structural changes in grey and white matter in male and female brains. The choice of the European starling as a model songbird was smart as this bird has a larger brain to facilitate anatomical localization, clear sex differences in song behavior and well-characterized photoperiod-induced changes in reproductive state. The authors are commended for using both male and female starlings. The photoperiodic treatment used was optimal to capture the key changes in physiological state. The high sampling frequency provides the capability to monitor key changes in physiology, behaviour and brain anatomy. Two exciting findings was the increased role of cerebellum and hippocampal recruitment in female birds engaged in singing behaviour. The development of non-invasive, multi-sampling brain imaging in songbirds provides a major advancement for studies that seek to understand the mechanism that control the motivation and production of singing behavior. The methods described herein set the foundation to develop targeted hypotheses to study how the vocal learning, such as language, is processed in discrete brain regions. Overall, the data presented in the study is extensive and includes a comprehensive analyses of regulated changes in brain microstructural plasticity in male and female songbirds.
-
Reviewer #2 (Public Review):
Orije et al. employed diffusion weighted imaging to longitudinally monitor the plasticity of the song control system during multiple photoperiods in male and female starlings. The authors found that both sexes experience similar seasonal neuroplasticity in multisensory systems and cerebellum during the photosensitive phase. The authors' findings are convincing and rely on a set of well-designed longitudinal investigations encompassing previously validated imaging methods. The authors' identification of a putative sensitive window during which sensory and motor systems can be seasonally re-shaped in both sexes is an interesting finding that advances our understanding of the neural basis of seasonal structural neuroplasticity in songbirds.
Overall, this is a strong paper whose major strengths are:
The …
Reviewer #2 (Public Review):
Orije et al. employed diffusion weighted imaging to longitudinally monitor the plasticity of the song control system during multiple photoperiods in male and female starlings. The authors found that both sexes experience similar seasonal neuroplasticity in multisensory systems and cerebellum during the photosensitive phase. The authors' findings are convincing and rely on a set of well-designed longitudinal investigations encompassing previously validated imaging methods. The authors' identification of a putative sensitive window during which sensory and motor systems can be seasonally re-shaped in both sexes is an interesting finding that advances our understanding of the neural basis of seasonal structural neuroplasticity in songbirds.
Overall, this is a strong paper whose major strengths are:
The longitudinal and non-invasive measure of plasticity employed
The use of two complementary MR assays of white matter microplasticity
The careful experimental design
The sound and balanced interpretation of the imaging findings
I do not have any major criticism but just a few minor suggestions:
# Pp 6-7. While the comparative description of canonical DTI with respect to fixel-based analysis is well written and of interest to readers with formal training in MR imaging, I found this entire section (and especially the paragraphs in page 7) too technical and out of context in a manuscript that is otherwise fundamentally about neuroplasticity in song birds. The accessibility of this manuscript to non-MR experts could be improved by moving this paragraph into the methods section, or by including it as supplemental material.
# Similarly, many sections, especially results, are in my opinion too detailed and analytical. While the employed description has the benefit of being systematic and rigorous, the ensuing narrative tends to be very technical and not easily interpretable by non experts. I think the manuscript may be substantially shortened (by at least 20% e.g. by removing overly technical or analytical descriptions of all results and regions affected) without losing its appeal and impact, but instead gaining in strength and focus especially if the new result narrative were aimed to more directly address the interesting set of questions the authors define in the introductory sections.
# The possible effect of brain size has been elegantly controlled by using a medial split approach. Have the authors considered using tensor-based morphometry (i.e. using the 3D RARE scans they acquired) to account for where in the brain the small differences in brain size occur? That could be more informative and sensitive than a whole-brain volume quantification.
# I think Figures Fig. 3 and Fig. 4 may benefit from a ROI-based quantification of parameters of interests across groups (similar to what has been done for Fig. 7 and its related Fig. 8). This could help readers assess the biological relevance of the parameter mapped. For instance, in Fig. 3, most FA differences are taking place in low FA (i.e. gray matter dense?) regions.
# In Abstract: "We longitudinally monitored the song and neuroplasticity in male.." Perhaps something should be specified after the "the song"? Did the authors mean "the neuroplasticity of song system"?
-
Reviewer #3 (Public Review):
In their paper, Orije et al used MRI imaging to study sexual dimorphisms in brains of European starlings during multiple photoperiods and how this seasonal neuroplasticity is dependent in brain size, song rates and hormonal levels. The authors main findings include difference in hemispheric asymmetries between the sexes, multisensory neuroplasticity in the song control system and beyond it in both sexes and some dependence of singing behavior in females with large brains. The authors use different methods to quantify the changes in the MRI data to support various possible mechanisms that could be the basis of the differences they see. They also record the birds' song rates and hormonal levels to correlate the neural findings with biological relevant variables.
The analysis is very impressive, taking into …
Reviewer #3 (Public Review):
In their paper, Orije et al used MRI imaging to study sexual dimorphisms in brains of European starlings during multiple photoperiods and how this seasonal neuroplasticity is dependent in brain size, song rates and hormonal levels. The authors main findings include difference in hemispheric asymmetries between the sexes, multisensory neuroplasticity in the song control system and beyond it in both sexes and some dependence of singing behavior in females with large brains. The authors use different methods to quantify the changes in the MRI data to support various possible mechanisms that could be the basis of the differences they see. They also record the birds' song rates and hormonal levels to correlate the neural findings with biological relevant variables.
The analysis is very impressive, taking into account the massive data set that was recorded and processed. Whole-brain data driven analysis prevented the authors from being biased to well-known sexually dimorphic brain areas. Sampling of a large number of subjects across many time points allowed for averaging in cases where individual measurements could not show statistical significance. The conclusions of the paper are mostly well supported by data (except of some confounds that the authors mention in the text). However, the extensive statistically significant results that are described in the paper, make it hard to follow at times.
In the introduction the authors mention the pre optic area as a mediator for increase singing and therefore seasonal neuroplasticity. Did the authors find any differences in that area or other well know nuclei that are involved in courtship (PAG for example)?
Following the first comment, what is the minimum volume of an area of interest that could be detected using the voxel analysis?
It would be useful to have a figure describing the song system in European starlings and how the auditory areas, the cerebellum and the hippocampus are connected to it, before describing the results. It would make it easier for the broader community to make a better sense of the results.
In the results section the authors clearly describe which brain areas are sexually dimorphic or change during the photoperiod and what is the underlying reason for the difference. However, only in the discussion section it is clearer why some of those differences are expected or surprising. It would be useful to incorporate some of those explanations in the results section other than just having a long list of brain areas and metrics. For example, I found the involvement of visual and auditory areas in the female brain in the mating season very interesting.
-
