Modeling the impact of racial and ethnic disparities on COVID-19 epidemic dynamics
Curation statements for this article:-
Curated by eLife

Evaluation Summary:
This excellent paper by Ma and colleagues assesses the role of assortative mixing in regards to racial and ethnic disparities to estimate herd immunity thresholds (HIT) for SARS-CoV-2. The paper is conceptual in nature and builds on similar models which have been particularly useful to understand the dynamics of sexually transmitted diseases. The model is explained well and the paper is clearly written. The conclusions are justified by the analysis. One limitation is that the model is trained against a single cross-sectional seroprevalence estimate (one in NYC & one in Long Island) which allows for multiple models (ranging from homogeneous mixing to proportionate mixing) to recapitulate the data and in turn does not allow general estimates of HIT for these regions. It is also unclear if a more realistic epidemic simulation that included repeated waves of infection &/or vaccine roll out would change the conclusions regarding HIT according to race and ethnicity.
(This preprint has been reviewed by eLife. We include the public reviews from the reviewers here; the authors also receive private feedback with suggested changes to the manuscript. Reviewer #1, Reviewer #2 and Reviewer #3 agreed to share their names with the authors.)
This article has been Reviewed by the following groups

Discuss this preprint
Start a discussion What are Sciety discussions?Listed in
- Evaluated articles (eLife)
- Evaluated articles (ScreenIT)
Abstract
The impact of variable infection risk by race and ethnicity on the dynamics of SARS-CoV-2 spread is largely unknown.
Methods:
Here, we fit structured compartmental models to seroprevalence data from New York State and analyze how herd immunity thresholds (HITs), final sizes, and epidemic risk change across groups.
Results:
A simple model where interactions occur proportionally to contact rates reduced the HIT, but more realistic models of preferential mixing within groups increased the threshold toward the value observed in homogeneous populations. Across all models, the burden of infection fell disproportionately on minority populations: in a model fit to Long Island serosurvey and census data, 81% of Hispanics or Latinos were infected when the HIT was reached compared to 34% of non-Hispanic whites.
Conclusions:
Our findings, which are meant to be illustrative and not best estimates, demonstrate how racial and ethnic disparities can impact epidemic trajectories and result in unequal distributions of SARS-CoV-2 infection.
Funding:
K.C.M. was supported by National Science Foundation GRFP grant DGE1745303. Y.H.G. and M.L. were funded by the Morris-Singer Foundation. M.L. was supported by SeroNet cooperative agreement U01 CA261277.
Article activity feed
-

-

Author Response:
Reviewer #1 (Public Review):
Strengths:
- The model structure is appropriate for the scientific question.
- The paper addresses a critical feature of SARS-CoV-2 epidemiology which is its much higher prevalence in Hispanic or Latino and Black populations. In this sense, the paper has the potential to serve as a tool to enhance social justice.
- Generally speaking, the analysis supports the conclusions.
Other considerations:
- The clean distinction between susceptibility and exposure models described in the paper is conceptually useful but is unlikely to capture reality. Rather, susceptibility to infection is likely to vary more by age whereas exposure is more likely to vary by ethnic group / race. While age cohort are not explicitly distinguished in the model, the authors would do well to at least vary …
Author Response:
Reviewer #1 (Public Review):
Strengths:
- The model structure is appropriate for the scientific question.
- The paper addresses a critical feature of SARS-CoV-2 epidemiology which is its much higher prevalence in Hispanic or Latino and Black populations. In this sense, the paper has the potential to serve as a tool to enhance social justice.
- Generally speaking, the analysis supports the conclusions.
Other considerations:
- The clean distinction between susceptibility and exposure models described in the paper is conceptually useful but is unlikely to capture reality. Rather, susceptibility to infection is likely to vary more by age whereas exposure is more likely to vary by ethnic group / race. While age cohort are not explicitly distinguished in the model, the authors would do well to at least vary susceptibility across ethnic groups according to different age cohort structure within these groups. This would allow a more precise estimate of the true effect of variability in exposures. Alternatively, this could be mentioned as a limitation of the the current model.
We agree that this would be an important extension for future work and have indicated this in the Discussion, along with the types of data necessary to fit such models:
“Fourth, due to data availability, we have only considered variability in exposure due to one demographic characteristic; models should ideally strive to also account for the effects of age on susceptibility and exposure within strata of race and ethnicity and other relevant demographics, such as socioeconomic status and occupation \cite{Mulberry2021-tc}. These models could be fit using representative serological studies with detailed cross-tabulated seropositivity estimates.”
- I appreciated that the authors maintained an agnostic stance on the actual value of HIT (across the population & within ethnic groups) based on the results of their model. If there was available data, then it might be possible to arrive at a slightly more precise estimate by fitting the model to serial incidence data (particularly sorted by ethnic group) over time in NYC & Long Island. First, this would give some sense of R_effective. Second, if successive waves were modeled, then the shift in relative incidence & CI among these groups that is predicted in Figure 3 & Sup fig 8 may be observed in the actual data (this fits anecdotally with what I have seen in several states). Third, it may (or may not) be possible to estimate values of critical model parameters such as epsilon. It would be helpful to mention this as possible future work with the model.
Caveats about the impossibility of truly measuring HIT would still apply (due to new variants, shifting use & effective of NPIs, etc….). However, as is, the estimates of possible values for HIT are so wide as to make the underlying data used to train the model almost irrelevant. This makes the potential to leverage the model for policy decisions more limited.
We have highlighted this important limitation in the Discussion:
“Finally, we have estimated model parameters using a single cross-sectional serosurvey. To improve estimates and the ability to distinguish between model structures, future studies should use longitudinal serosurveys or case data stratified by race and ethnicity and corrected for underreporting; the challenge will be ensuring that such data are systematically collected and made publicly available, which has been a persistent barrier to research efforts \cite{Krieger2020-ss}. Addressing these data barriers will also be key for translating these and similar models into actionable policy proposals on vaccine distribution and non-pharmaceutical interventions.”
- I think the range of R0 in the figures should be extended to go as as low as 1. Much of the pandemic in the US has been defined by local Re that varies between 0.8 & 1.2 (likely based on shifts in the degree of social distancing). I therefore think lower HIT thresholds should be considered and it would be nice to know how the extent of assortative mixing effects estimates at these lower R_e values.
We agree this would be of interest and have extended the range of R0 values. Figure 1 has been updated accordingly (see below); we also updated the text with new findings: “After fitting the models across a range of $\epsilon$ values, we observed that as $\epsilon$ increases, HITs and epidemic final sizes shifted higher back towards the homogeneous case (Figure \ref{fig:model2}, Figure 1-figure supplement 4); this effect was less pronounced for $R_0$ values close to 1.”
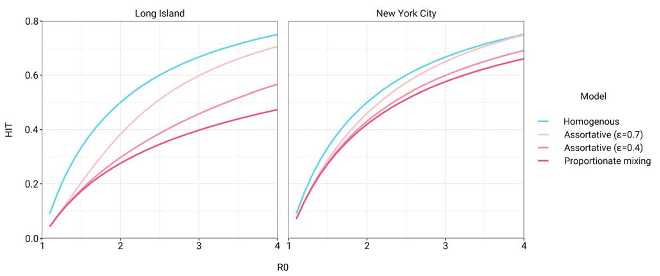
Figure 1: Incorporating assortativity in variable exposure models results in increased HITs across a range of $R_0$ values. Variable exposure models were fitted to NYC and Long Island serosurvey data.
- line 274: I feel like this point needs to be considered in much more detail, either with a thoughtful discussion or with even with some simple additions to the model. How should these results make policy makers consider race and ethnicity when thinking about the key issues in the field right now such as vaccine allocation, masking, and new variants. I think to achieve the maximal impact, the authors should be very specific about how model results could impact policy making, and how we might lower the tragic discrepancies associated with COVID. If the model / data is insufficient for this purpose at this stage, then what type of data could be gathered that would allow more precise and targeted policy interventions?
We have conducted additional analyses exploring the important suggestion by the reviewers that social distancing could affect these conclusions. The text and figures have been updated accordingly:
“Finally, we assessed how robust these findings were to the impact of social distancing and other non- pharmaceutical interventions (NPIs). We modeled these mitigation measures by scaling the transmission
rate by a factor $\alpha$ beginning when 5% cumulative incidence in the population was reached. Setting the duration of distancing to be 50 days and allowing $\alpha$ to be either 0.3 or 0.6 (i.e. a 70% or 40% reduction in transmission rates, respectively), we assessed how the $R_0$ versus HIT and final epidemic size relationships changed. We found that the $R_0$ versus HIT relationship was similar to in the unmitigated epidemic (Figure 1-figure supplement 5). In contrast, final epidemic sizes depended on the intensity of mitigation measures, though qualitative trends across models (e.g. increased assortativity leads to greater final sizes) remained true (Figure 1-figure supplement 6). To explore this further, we systematically varied $\alpha$ and the duration of NPIs while holding $R_0$ constant at 3. We found again that the HIT was consistent, whereas final epidemic sizes were substantially affected by the choice of mitigation parameters (Figure 1-figure supplement 7); the distribution of cumulative incidence at the point of HIT was also comparable with and without mitigation measures (Figure 2-figure supplement 8). The most stringent NPI intensities did not necessarily lead to the smallest epidemic final sizes, an idea which has been explored in studies analyzing optimal control measures \cite{Neuwirth2020- nb,Handel2007-ee}. Longitudinal changes in incidence rate ratios also were affected by NPIs, but qualitative trends in the ordering of racial and ethnic groups over time remained consistent (Figure 3- figure supplement 3).
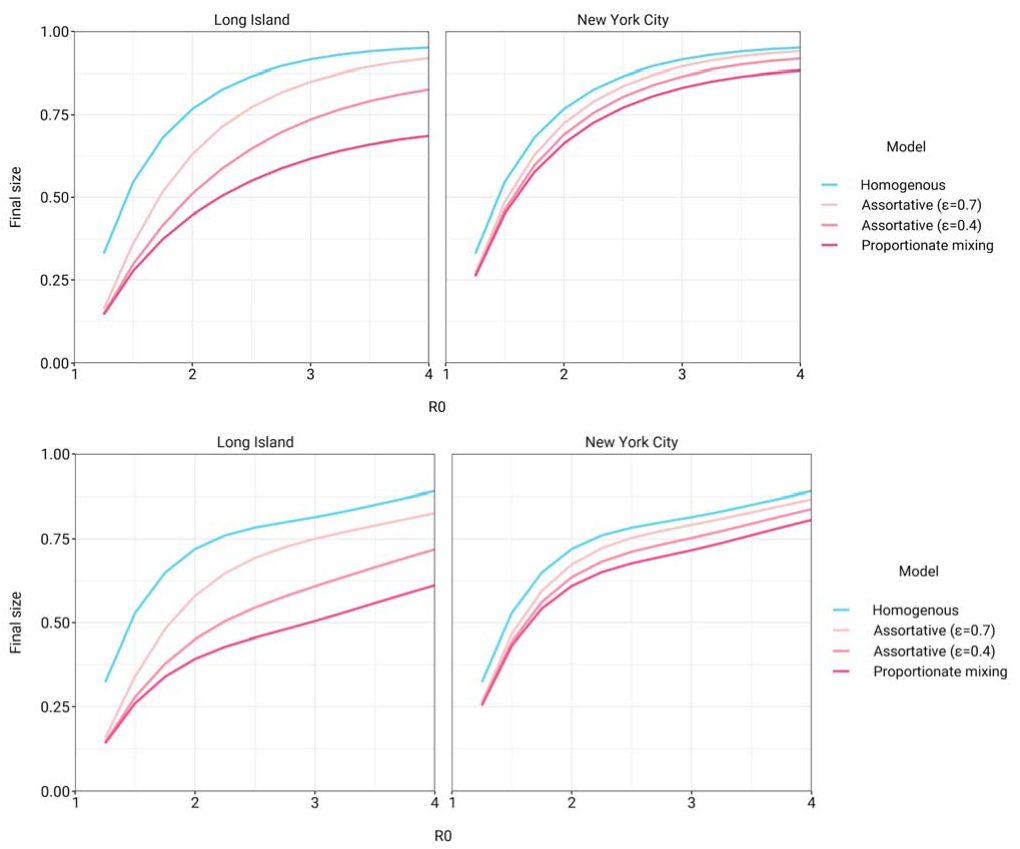
Figure 1-figure supplement 6: Final epidemic sizes versus $R_0$ in variable exposure models with mitigation measures for $\alpha = 0.3$ (top) and $\alpha = 0.6$ (bottom). NPIs were initiated when cumulative incidence reached 5% in all models and continued for 50 days. Models were fitted to NYC and Long Island serosurvey data.
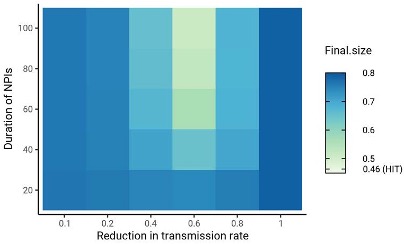
Figure 1-figure supplement 7: Sensitivity analysis on the impact of intensity and duration of NPIs on final epidemic sizes. HIT values for the same mitigation parameters were 46.4 $\pm$ 0.5% (range). The smallest final size, corresponding to $\alpha = 0.6$ and duration = 100, was 51%. Census-informed assortativity models were fit to Long Island seroprevalence data. NPIs were initiated when cumulative incidence reached 5% in all models.
See points 1 and 2 above for examples of additional data required.
Minor issues:
-This is subjective but I found the words "active" and "high activity" to describe increases in contacts per day to be confusing. I would just say more contacts per day. It might help to change "contacts" to "exposure contacts" to emphasize that not all contacts are high risk.
To clarify this, we have replaced instances of “activity level” (and similar) with “total contact rate”, indicating the total number of contacts per unit time per individual; e.g. “The estimated total contact rate ratios indicate higher contacts for minority groups such as Hispanics or Latinos and non-Hispanic Black people, which is in line with studies using cell phone mobility data \cite{Chang2020-in}; however, the magnitudes of the ratios are substantially higher than we expected given the findings from those studies.”
We have also clarified our definition of contacts: “We define contacts to be interactions between individuals that allow for transmission of SARS-CoV-2 with some non-zero probability.”
-The abstract has too much jargon for a generalist journal. I would avoid words like "proportionate mixing" & "assortative" which are very unique to modeling of infectious diseases unless they are first defined in very basic language.
We have revised the abstract to convey these same concepts in a more accessible manner: “A simple model where interactions occur proportionally to contact rates reduced the HIT, but more realistic models of preferential mixing within groups increased the threshold toward the value observed in homogeneous populations.”
-I would cite some of the STD models which have used similar matrices to capture assortative mixing.
We have added a reference in the assortative mixing section to a review of heterogeneous STD models: “Finally, under the \textit{assortative mixing} assumption, we extended this model by partitioning a fraction $\epsilon$ of contacts to be exclusively within-group and distributed the rest of the contacts according to proportionate mixing (with $\delta_{i,j}$ being an indicator variable that is 1 when $i=j$ and 0 otherwise) \cite{Hethcote1996-bf}:”
-Lines 164-5: very good point but I would add that members of ethnic / racial groups are more likely to be essential workers and also to live in multigenerational houses
We have added these helpful examples into the text: “Variable susceptibility to infection across racial and ethnic groups has been less well characterized, and observed disparities in infection rates can already be largely explained by differences in mobility and exposure \cite{Chang2020-in,Zelner2020- mb,Kissler2020-nh}, likely attributable to social factors such as structural racism that have put racial and ethnic minorities in disadvantaged positions (e.g., employment as frontline workers and residence in overcrowded, multigenerational homes) \cite{Henry_Akintobi2020-ld,Thakur2020-tw,Tai2020- ok,Khazanchi2020-xu}.”
-Line 193: "Higher than expected" -> expected by who?
We have clarified this phrase: “The estimated total contact rate ratios indicate higher exposure contacts for minority groups such as Hispanics or Latinos and non-Hispanic Black people, which is in line with studies using cell phone mobility data \cite{Chang2020-in}; however, the magnitudes of the ratios are substantially higher than we expected given the findings from those studies.”
-A limitation that needs further mention is that fact that race & ethnic group, while important, could be sub classified into strata that inform risk even more (such as SES, job type etc….)
We agree and have added this to the Discussion: “Fourth, due to data availability, we have only considered variability in exposure due to one demographic characteristic; models should ideally strive to also account for the effects of age on susceptibility and exposure within strata of race and ethnicity and other relevant demographics, such as socioeconomic status and occupation \cite{Mulberry2021-tc}. These models could be fit using representative serological studies with detailed cross-tabulated seropositivity estimates.”
Reviewer #2 (Public Review):
Overall I think this is a solid and interesting piece that is an important contribution to the literature on COVID-19 disparities, even if it does have some limitations. To this point, most models of SARS-CoV-2 have not included the impact of residential and occupational segregation on differential group-specific covid outcomes. So, the authors are to commended on their rigorous and useful contribution on this valuable topic. I have a few specific questions and concerns, outlined below:
We thank the reviewer for the supportive comments.
- Does the reliance on serosurvey data collected in public places imply a potential issue with left-censoring, i.e. by not capturing individuals who had died? Can the authors address how survival bias might impact their results? I imagine this could bring the seroprevalence among older people down in a way that could bias their transmission rate estimates.
We have included this important point in the limitations section on potential serosurvey biases: “First, biases in the serosurvey sampling process can substantially affect downstream results; any conclusions drawn depend heavily on the degree to which serosurvey design and post-survey adjustments yield representative samples \cite{Clapham2020-rt}. For instance, because the serosurvey we relied on primarily sampled people at grocery stores, there is both survival bias (cumulative incidence estimates do not account for people who have died) and ascertainment bias (undersampling of at-risk populations that are more likely to self-isolate, such as the elderly) \cite{Rosenberg2020-qw,Accorsi2021-hx}. These biases could affect model estimates if, for instance, the capacity to self-isolate varies by race or ethnicity -- as suggested by associations of neighborhood-level mobility versus demographics \cite{Kishore2020- sy,Kissler2020-nh} -- leading to an overestimate of cumulative incidence and contact rates in whites.”
- It might be helpful to think in terms of disparities in HITs as well as disparities in contact rates, since the HIT of whites is necessarily dependent on that of Blacks. I'm not really disagreeing with the thrust of what their analysis suggests or even the factual interpretation of it. But I do think it is important to phrase some of the conclusions of the model in ways that are more directly relevant to health equity, i.e. how much infection/vaccination coverage does each group need for members of that group to benefit from indirect protection?
We agree with this important point and indeed this was the goal, in part, of the analyses in Figure 2. We have added additional text to the Discussion highlighting this: “Projecting the epidemic forward indicated that the overall HIT was reached after cumulative incidence had increased disproportionately in minority groups, highlighting the fundamentally inequitable outcome of achieving herd immunity through infection. All of these factors underscore the fact that incorporating heterogeneity in models in a mechanism-free manner can conceal the disparities that underlie changes in epidemic final sizes and HITs. In particular, overall lower HIT and final sizes occur because certain groups suffer not only more infection than average, but more infection than under a homogeneous mixing model; incorporating heterogeneity lowers the HIT but increases it for the highest-risk groups (Figure \ref{fig:hitcomp}).”
For vaccination, see our response to Reviewer #1 point 4.
- The authors rely on a modified interaction index parameterized directly from their data. It would be helpful if they could explain why they did not rely on any sources of mobility data. Are these just not broken down along the type of race/ethnicity categories that would be necessary to complete this analysis? Integrating some sort of external information on mobility would definitely strengthen the analysis.
This is a great suggestion, but this type of data has generally not been available due to privacy concerns from disaggregating mobility data by race and ethnicity (Kishore et al., 2020). Instead, we modeled NPIs as mentioned in Reviewer #1 point 4, with the caveat that reduction in mobility was assumed to be identical across groups. We added this into the text explicitly as a limitation: “Third, we have assumed the impact of non-pharmaceutical interventions such as stay-at-home policies, closures, and the like to equally affect racial and ethnic groups. Empirical evidence suggests that during periods of lockdown, certain neighborhoods that are disproportionately wealthy and white tend to show greater declines in mobility than others \cite{Kishore2020-sy,Kissler2020-nh}. These simplifying assumptions were made to aid in illustrating the key findings of this model, but for more detailed predictive models, the extent to which activity level differences change could be evaluated using longitudinal contact survey data \cite{Feehan2020-ta}, since granular mobility data are typically not stratified by race and ethnicity due to privacy concerns \cite{Kishore2020-mg}.”
Reviewer #3 (Public Review):
Ma et al investigate the effect of racial and ethnic differences in SARS-CoV-2 infection risk on the herd immunity threshold of each group. Using New York City and Long Island as model settings, they construct a race/ethnicity-structured SEIR model. Differential risk between racial and ethnic groups was parameterized by fitting each model to local seroprevalence data stratified demographically. The authors find that when herd immunity is reached, cumulative incidence varies by more than two fold between ethnic groups, at approximately 75% of Hispanics or Latinos and only 30% of non-Hispanic Whites.
This result was robust to changing assumptions about the source of racial and ethnic disparities. The authors considered differences in disease susceptibility, exposure levels, as well as a census-driven model of assortative mixing. These results show the fundamentally inequitable outcome of achieving herd immunity in an unmitigated epidemic.
The authors have only considered an unmitigated epidemic, without any social distancing, quarantine, masking, or vaccination. If herd immunity is achieved via one of these methods, particularly vaccination, the disparities may be mitigated somewhat but still exist. This will be an important question for epidemiologists and public health officials to consider throughout the vaccine rollout.
We thank the reviewer for the detailed and helpful summary and suggestions.
-
Reviewer #3 (Public Review):
Ma et al investigate the effect of racial and ethnic differences in SARS-CoV-2 infection risk on the herd immunity threshold of each group. Using New York City and Long Island as model settings, they construct a race/ethnicity-structured SEIR model. Differential risk between racial and ethnic groups was parameterized by fitting each model to local seroprevalence data stratified demographically. The authors find that when herd immunity is reached, cumulative incidence varies by more than two fold between ethnic groups, at approximately 75% of Hispanics or Latinos and only 30% of non-Hispanic Whites.
This result was robust to changing assumptions about the source of racial and ethnic disparities. The authors considered differences in disease susceptibility, exposure levels, as well as a census-driven model of …
Reviewer #3 (Public Review):
Ma et al investigate the effect of racial and ethnic differences in SARS-CoV-2 infection risk on the herd immunity threshold of each group. Using New York City and Long Island as model settings, they construct a race/ethnicity-structured SEIR model. Differential risk between racial and ethnic groups was parameterized by fitting each model to local seroprevalence data stratified demographically. The authors find that when herd immunity is reached, cumulative incidence varies by more than two fold between ethnic groups, at approximately 75% of Hispanics or Latinos and only 30% of non-Hispanic Whites.
This result was robust to changing assumptions about the source of racial and ethnic disparities. The authors considered differences in disease susceptibility, exposure levels, as well as a census-driven model of assortative mixing. These results show the fundamentally inequitable outcome of achieving herd immunity in an unmitigated epidemic.
The authors have only considered an unmitigated epidemic, without any social distancing, quarantine, masking, or vaccination. If herd immunity is achieved via one of these methods, particularly vaccination, the disparities may be mitigated somewhat but still exist. This will be an important question for epidemiologists and public health officials to consider throughout the vaccine rollout.
-
Reviewer #2 (Public Review):
Overall I think this is a solid and interesting piece that is an important contribution to the literature on COVID-19 disparities, even if it does have some limitations. To this point, most models of SARS-CoV-2 have not included the impact of residential and occupational segregation on differential group-specific covid outcomes. So, the authors are to commended on their rigorous and useful contribution on this valuable topic. I have a few specific questions and concerns, outlined below:
Does the reliance on serosurvey data collected in public places imply a potential issue with left-censoring, i.e. by not capturing individuals who had died? Can the authors address how survival bias might impact their results? I imagine this could bring the seroprevalence among older people down in a way that could bias their …
Reviewer #2 (Public Review):
Overall I think this is a solid and interesting piece that is an important contribution to the literature on COVID-19 disparities, even if it does have some limitations. To this point, most models of SARS-CoV-2 have not included the impact of residential and occupational segregation on differential group-specific covid outcomes. So, the authors are to commended on their rigorous and useful contribution on this valuable topic. I have a few specific questions and concerns, outlined below:
Does the reliance on serosurvey data collected in public places imply a potential issue with left-censoring, i.e. by not capturing individuals who had died? Can the authors address how survival bias might impact their results? I imagine this could bring the seroprevalence among older people down in a way that could bias their transmission rate estimates.
It might be helpful to think in terms of disparities in HITs as well as disparities in contact rates, since the HIT of whites is necessarily dependent on that of Blacks. I'm not really disagreeing with the thrust of what their analysis suggests or even the factual interpretation of it. But I do think it is important to phrase some of the conclusions of the model in ways that are more directly relevant to health equity, i.e. how much infection/vaccination coverage does each group need for members of that group to benefit from indirect protection?
The authors rely on a modified interaction index parameterized directly from their data. It would be helpful if they could explain why they did not rely on any sources of mobility data. Are these just not broken down along the type of race/ethnicity categories that would be necessary to complete this analysis? Integrating some sort of external information on mobility would definitely strengthen the analysis.
-
Reviewer #1 (Public Review):
Strengths:
The model structure is appropriate for the scientific question.
The paper addresses a critical feature of SARS-CoV-2 epidemiology which is its much higher prevalence in Hispanic or Latino and Black populations. In this sense, the paper has the potential to serve as a tool to enhance social justice.
Generally speaking, the analysis supports the conclusions.
Other considerations:
The clean distinction between susceptibility and exposure models described in the paper is conceptually useful but is unlikely to capture reality. Rather, susceptibility to infection is likely to vary more by age whereas exposure is more likely to vary by ethnic group / race. While age cohort are not explicitly distinguished in the model, the authors would do well to at least vary susceptibility across ethnic groups according …
Reviewer #1 (Public Review):
Strengths:
The model structure is appropriate for the scientific question.
The paper addresses a critical feature of SARS-CoV-2 epidemiology which is its much higher prevalence in Hispanic or Latino and Black populations. In this sense, the paper has the potential to serve as a tool to enhance social justice.
Generally speaking, the analysis supports the conclusions.
Other considerations:
The clean distinction between susceptibility and exposure models described in the paper is conceptually useful but is unlikely to capture reality. Rather, susceptibility to infection is likely to vary more by age whereas exposure is more likely to vary by ethnic group / race. While age cohort are not explicitly distinguished in the model, the authors would do well to at least vary susceptibility across ethnic groups according to different age cohort structure within these groups. This would allow a more precise estimate of the true effect of variability in exposures. Alternatively, this could be mentioned as a limitation of the the current model.
I appreciated that the authors maintained an agnostic stance on the actual value of HIT (across the population & within ethnic groups) based on the results of their model. If there was available data, then it might be possible to arrive at a slightly more precise estimate by fitting the model to serial incidence data (particularly sorted by ethnic group) over time in NYC & Long Island. First, this would give some sense of R_effective. Second, if successive waves were modeled, then the shift in relative incidence & CI among these groups that is predicted in Figure 3 & Sup fig 8 may be observed in the actual data (this fits anecdotally with what I have seen in several states). Third, it may (or may not) be possible to estimate values of critical model parameters such as epsilon. It would be helpful to mention this as possible future work with the model.
Caveats about the impossibility of truly measuring HIT would still apply (due to new variants, shifting use & effective of NPIs, etc....). However, as is, the estimates of possible values for HIT are so wide as to make the underlying data used to train the model almost irrelevant. This makes the potential to leverage the model for policy decisions more limited.
I think the range of R0 in the figures should be extended to go as as low as 1. Much of the pandemic in the US has been defined by local Re that varies between 0.8 & 1.2 (likely based on shifts in the degree of social distancing). I therefore think lower HIT thresholds should be considered and it would be nice to know how the extent of assortative mixing effects estimates at these lower R_e values.
line 274: I feel like this point needs to be considered in much more detail, either with a thoughtful discussion or with even with some simple additions to the model. How should these results make policy makers consider race and ethnicity when thinking about the key issues in the field right now such as vaccine allocation, masking, and new variants. I think to achieve the maximal impact, the authors should be very specific about how model results could impact policy making, and how we might lower the tragic discrepancies associated with COVID. If the model / data is insufficient for this purpose at this stage, then what type of data could be gathered that would allow more precise and targeted policy interventions?
Minor issues:
-This is subjective but I found the words "active" and "high activity" to describe increases in contacts per day to be confusing. I would just say more contacts per day. It might help to change "contacts" to "exposure contacts" to emphasize that not all contacts are high risk.
-The abstract has too much jargon for a generalist journal. I would avoid words like "proportionate mixing" & "assortative" which are very unique to modeling of infectious diseases unless they are first defined in very basic language.
-I would cite some of the STD models which have used similar matrices to capture assortative mixing.
-Lines 164-5: very good point but I would add that members of ethnic / racial groups are more likely to be essential workers and also to live in multigenerational houses
-Line 193: "Higher than expected" -> expected by who?
-A limitation that needs further mention is that fact that race & ethnic group, while important, could be sub classified into strata that inform risk even more (such as SES, job type etc....)
-
Evaluation Summary:
This excellent paper by Ma and colleagues assesses the role of assortative mixing in regards to racial and ethnic disparities to estimate herd immunity thresholds (HIT) for SARS-CoV-2. The paper is conceptual in nature and builds on similar models which have been particularly useful to understand the dynamics of sexually transmitted diseases. The model is explained well and the paper is clearly written. The conclusions are justified by the analysis. One limitation is that the model is trained against a single cross-sectional seroprevalence estimate (one in NYC & one in Long Island) which allows for multiple models (ranging from homogeneous mixing to proportionate mixing) to recapitulate the data and in turn does not allow general estimates of HIT for these regions. It is also unclear if a more realistic epidemic …
Evaluation Summary:
This excellent paper by Ma and colleagues assesses the role of assortative mixing in regards to racial and ethnic disparities to estimate herd immunity thresholds (HIT) for SARS-CoV-2. The paper is conceptual in nature and builds on similar models which have been particularly useful to understand the dynamics of sexually transmitted diseases. The model is explained well and the paper is clearly written. The conclusions are justified by the analysis. One limitation is that the model is trained against a single cross-sectional seroprevalence estimate (one in NYC & one in Long Island) which allows for multiple models (ranging from homogeneous mixing to proportionate mixing) to recapitulate the data and in turn does not allow general estimates of HIT for these regions. It is also unclear if a more realistic epidemic simulation that included repeated waves of infection &/or vaccine roll out would change the conclusions regarding HIT according to race and ethnicity.
(This preprint has been reviewed by eLife. We include the public reviews from the reviewers here; the authors also receive private feedback with suggested changes to the manuscript. Reviewer #1, Reviewer #2 and Reviewer #3 agreed to share their names with the authors.)
-

SciScore for 10.1101/2021.01.15.21249881: (What is this?)
Please note, not all rigor criteria are appropriate for all manuscripts.
Table 1: Rigor
NIH rigor criteria are not applicable to paper type.Table 2: Resources
No key resources detected.
Results from OddPub: Thank you for sharing your code and data.
Results from LimitationRecognizer: We detected the following sentences addressing limitations in the study:We note several limitations with this study. First, biases in the serosurvey sampling process can substantially affect downstream results; any conclusions drawn depend heavily on the degree to which serosurvey design and post-survey adjustments yield representative samples [49]. Other sources of uncertainty, such as antibody test sensitivity and specificity, could also be incorporated into epidemic model predictions in future work …
SciScore for 10.1101/2021.01.15.21249881: (What is this?)
Please note, not all rigor criteria are appropriate for all manuscripts.
Table 1: Rigor
NIH rigor criteria are not applicable to paper type.Table 2: Resources
No key resources detected.
Results from OddPub: Thank you for sharing your code and data.
Results from LimitationRecognizer: We detected the following sentences addressing limitations in the study:We note several limitations with this study. First, biases in the serosurvey sampling process can substantially affect downstream results; any conclusions drawn depend heavily on the degree to which serosurvey design and post-survey adjustments yield representative samples [49]. Other sources of uncertainty, such as antibody test sensitivity and specificity, could also be incorporated into epidemic model predictions in future work [50]. Second, we have assumed that seropositivity implies complete immunity and that immunity does not wane. These are strong assumptions that can be revisited as empirical studies on the length of natural immunity are conducted. Third, we have for simplicity modeled an unmitigated epidemic, where overall transmission rates (per infected and susceptible individual) remain constant, and individual group-specific rates do as well. That is, we did not model the impact of non-pharmaceutical interventions such as stay-at-home policies, closures, or the like, either in reducing the overall transmission rate or in the relative changes in activity levels for different groups. Empirical evidence suggests that during periods of lockdown, certain neighborhoods that are disproportionately wealthy and white tend to show greater declines in mobility than others [27, 51]. These simplifying assumptions were made to aid in illustrating the key findings of this model, but for more detailed predictive models, the extent to which activity level differences change can b...
Results from TrialIdentifier: No clinical trial numbers were referenced.
Results from Barzooka: We did not find any issues relating to the usage of bar graphs.
Results from JetFighter: We did not find any issues relating to colormaps.
Results from rtransparent:- Thank you for including a conflict of interest statement. Authors are encouraged to include this statement when submitting to a journal.
- Thank you for including a funding statement. Authors are encouraged to include this statement when submitting to a journal.
- No protocol registration statement was detected.
-
