Evolution of cytokine production capacity in ancient and modern European populations
Curation statements for this article:-
Curated by eLife

Evaluation Summary:
Dominguez-Andrés et al. collect a large amount of immune-related trait association data from a cohort made up of 534 individuals of Western European ancestry. The goal was to track the evolutionary trajectories of cytokine production capacity over time in a number of patients with different exposure to infectious organisms, infectious disease, autoimmune and inflammatory diseases, using the 500 Functional Genomics cohort of the Human Functional Genomics Project. From this analysis it was hypothesized that the Neolithic transition was characterized by strong changes in the adaptive response to pathogens in human biology. Overall, the manuscript is interesting but could be improved by significant enhancements to statistical methodology.
(This preprint has been reviewed by eLife. We include the public reviews from the reviewers here; the authors also receive private feedback with suggested changes to the manuscript. Reviewer #2 agreed to share their name with the authors.)
This article has been Reviewed by the following groups
Discuss this preprint
Start a discussion What are Sciety discussions?Listed in
- Evaluated articles (eLife)
Abstract
As our ancestors migrated throughout different continents, natural selection increased the presence of alleles advantageous in the new environments. Heritable variations that alter the susceptibility to diseases vary with the historical period, the virulence of the infections, and their geographical spread. In this study we built polygenic scores for heritable traits that influence the genetic adaptation in the production of cytokines and immune-mediated disorders, including infectious, inflammatory, and autoimmune diseases, and applied them to the genomes of several ancient European populations. We observed that the advent of the Neolithic was a turning point for immune-mediated traits in Europeans, favoring those alleles linked with the development of tolerance against intracellular pathogens and promoting inflammatory responses against extracellular microbes. These evolutionary patterns are also associated with an increased presence of traits related to inflammatory and auto-immune diseases.
Article activity feed
-

-

Author Response:
Reviewer #1 (Public Review):
This paper focuses on the role of historical evolutionary patterns that lead to genetic adaptation in cytokine production and immune mediated diseases including infectious, inflammatory, and autoimmune diseases. The overall goal of this research was to track the evolutionary trajectories of cytokine production capacity over time in a number of patients with different exposure to infectious organisms, infectious disease, autoimmune and inflammatory diseases using the 500 Functional Genomics cohort of the Human Functional Genomics Project. The identified cohort is made up of 534 individuals of Western European ancestry. Much of this focus is on the impact and limitations of certain datasets that they have chosen to use such as the "average genotyped dosage" to be substituted for missing …
Author Response:
Reviewer #1 (Public Review):
This paper focuses on the role of historical evolutionary patterns that lead to genetic adaptation in cytokine production and immune mediated diseases including infectious, inflammatory, and autoimmune diseases. The overall goal of this research was to track the evolutionary trajectories of cytokine production capacity over time in a number of patients with different exposure to infectious organisms, infectious disease, autoimmune and inflammatory diseases using the 500 Functional Genomics cohort of the Human Functional Genomics Project. The identified cohort is made up of 534 individuals of Western European ancestry. Much of this focus is on the impact and limitations of certain datasets that they have chosen to use such as the "average genotyped dosage" to be substituted for missing variants and data interpretation.
We fully agree with the reviewer, we replace missing variants in a sample with its average dosage in the entire dataset. This makes it so missing variants in a sample do not bias the trends over time we observe. If we were to correct it using only samples from within their own era we would be inflating differences between the different era's. Whereas only using shared variants would increase the noise for older samples due to higher error rates associated with DNA degradation.
Moreover, some data pairings in the data set are not complete or had varying time points .
The stimulation periods were chosen based on extensive studies that showed that the timepoints used were best suited for assessing monocyte-derived and lymphocyte-derived cytokines per stimulus. Not all the stimuli induce the production of all cytokines, so the selection of the cytokine-stimulus pairs was performed for those pairs in which a cytokine production could be measured (PMID: 1385767; PMID: 19380112; PMID: 27814509; PMID: 27814508; PMID: 27814507). The differences in the cytokine availability and time points are adjusted to the optimal time of production per stimuli. Monocyte-derived cytokines (IL-1b, IL-6 and TNFa) are early response cytokines, produced by innate immune cells shortly after stimulation. IFNg, IL-17 and IL-22 are lymphocyte-derived cytokines, produced by adaptive immune cells, in this case T helper cells. These cells need to differentiate for several days before they start to produce these cytokines, this is the reason why the time point of the measurements of these cytokines is 7 days. In the case of IFNg, it can also be produced by NK cells, so it was measured after 48h after stimulation in whole blood samples. We have included these considerations in the new version of the text (lines 82 to 87).
Similarly, a split was done to look at before and after the Neolithic era and the linear regression correspond to those two eras. However, the authors do not comment or show the data to demonstrate why they choose that specific breakpoint as opposed to looking at every historical era transition, i.e., from early upper paleolithic to late upper paleolithic to Mesolithic to Neolithic to post-Neolithic to modern.
We thank the reviewer for this remark and acknowledge that we do not address the rationale behind our choice to look at this split specifically sufficiently. We hypothesized that the start of the Neolithic with its increase in population density and contact with animals would also be a turning point for many immune responses and immune related traits. We added various analyses to better highlight this and also show differences between different adjacent time periods.
-The original figures showed only models using two separate linear regression lines and the different thresholds for missing genotype rates showed consistent results. In the new figures we depict LOESS regression models to better show the difference in mean PRS at every point in time and we additionally show boxplots with the different major age periods pooling the paleolithic and mesolithic samples together as pre-neolithic samples in order to account for the lower sample number in the earlier historical periods. To highlight this we have added a new section in lines 123 to 129 and new versions of the figures 1, 2, 3 and 4.
-In the new figure 2 we add LOESS regression models for which we do not bias our analysis into defining a break at a certain time period. We furthermore show boxplots with pairwise comparisons (student’s T-test) for broader time periods highlighting the changes in PRS that would correspond with major changes in human lifestyle such as the shift from a hunter-gatherer to a neolithic lifestyle or the rapid urbanization of human society.
-In the new Figure 3 we confirm that the various traits showing a clear change in PRS start at the advent of the Neolithic or post-Neolithic era using both the LOESS regression and pairwise comparisons (student T-test).
-Similarly the heatmap in our original figure 4 has also been revised to only show the large sample set.
Lastly, the authors should highlight additional limitations of this current study in terms of the generalizability to other populations or to clearly state that this is limited to the European population at the specified latitude and longitudes used.
We thank the reviewer for his feedback and agree we should put more emphasis on this. In our study we focus on summary statistics obtained from European populations and only employ European aDNA samples, so our results should not be extrapolated to other populations from other geographical areas. We have included this in the Discussion of the new version of the manuscript (lines 289 to 292). However, our findings are mostly in agreement with previous studies in other populations, which adds robustness to the results of our study.
Reviewer #2 (Public Review):
In "Evolution of cytokine production capacity in ancient and modern European populations", Dominguez-Andrés et al. collect a large amount of trait association data from various studies on immune-mediated disorders and cytokine production, and use this data to create polygenic scores in ancient genomes. They then use the scores to attempt to test whether the Neolithic transition was characterized by strong changes in the adaptive response to pathogens. The impact of pathogens in human prehistory and the evolutionary response to them is an intriguing line of inquiry that is now beginning to be approachable with the rapidly increasing availability of ancient genomes.
While the study shows a commendable collection of association data, great expertise in immune biology and an interesting study question, the manuscript suffers from severe statistical issues, which makes me doubt the validity and robustness of their conclusions. I list my concerns below, in rough order of how important I believe they are to the claims of the paper:
—In addition to the magnitude of an effect away from the null, P-values are a function of the amount of data one has to fit a model or test a hypothesis. In this case, the authors have vastly more data after the Neolithic Revolution than before, and so have much higher power to reject the null hypothesis of "no relationship to time" after the revolution than before. One can see this in the plots the authors provided, which show vastly more data after the Neolithic, and consequently a greater ability to fit a significant linear model (in any direction) afterwards as well.
We thank the reviewer for raising this very important point. In order to account for this difference in sample size for the different historical periods we pooled all samples prior to the neolithic era together to test for differences in mean PRS between neighbouring historical periods. This way we lose some strength in terms of the carbon-dated age of each sample but we gain the ability to compare more different pairings than just pre- and post-neolithic samples. We added various analyses to better highlight this and also show differences between different adjacent time periods:
-The original figures showed only models using two separate linear regression lines and the different thresholds for missing genotype rates showed consistent results. In the new figures we depict LOESS regression models to better show the difference in mean PRS at every point in time and we additionally show boxplots with the different major age periods pooling the paleolithic and mesolithic samples together as pre-neolithic samples in order to account for the lower sample number in the earlier historical periods. To highlight this we have added a new section in lines 123 to 129 and new versions of the Figures 1, 2, 3 and 4.
-In the new figure 2 we add LOESS regression models for which we do not bias our analysis into defining a break at a certain time period. We furthermore show boxplots with pairwise comparisons (student’s T-test) for broader time periods highlighting the changes in PRS that would correspond with major changes in human lifestyle such as the shift from a hunter-gatherer to a neolithic lifestyle or the rapid urbanization of human society.
-In the new figure 3 we confirm that the various traits showing a clear change in PRS start at the advent of the Neolithic or post-Neolithic era using both the LOESS regression and pairwise comparisons (student T-test).
-Similarly the heatmap in our original figure 4 has also been revised to only show the large sample set.
—The authors argue that Figure S2 makes their results robust to sample size differences, but showing a consistency in direction before and after downsampling in the post-neolithic samples is not enough, because:
- you still lack power to detect changes in direction before the Neolithic.
- even for the post-Neolithic, the relationship may be in the same direction but no longer significant after downsampling. How much the significance of the linear model fit is affected by the downsampling is not shown.
We thank the reviewer for pointing this out. The low sample count dating back to before the Neolithic era makes it indeed hard to accurately detect changes in PRS significantly correlated with time. Instead, we now aim to pool these samples together and compare the distribution of their PRS with those of Neolithic samples to better be able to detect significant differences in PRS between these historical time periods.
In order to show the significance of each linear model as well we now show the -Log10 of the P value multiplied by the sign of the correlation coefficient. This way we can better highlight the consistency in direction as well as significance and show that downsampling affects the order of significance. Please see the new Figure 4-figure supplement 1. We have also discussed this more in depth on lines 267-272 of the new version of the text.
—The authors chose to test "relationship between PRS with time" before and after the Neolithic as a way to demonstrate that "the advent of the Neolithic was a turning point for immune-mediated traits in Europeans". A more appropriate way to test this would be creating a model that incorporates both sets of scores together, accounts for both sample size and genetic drift in the change of polygenic scores, and shows a significant shift occurs particularly in the Neolithic, rather in any other time period, instead of choosing the Neolithic as an "a priori" partition of the data. My guess is that one could have partitioned the data into pre- and post-Mesolithic and gotten similar results, largely due to imbalances in data availability.
We agree with the reviewer that the exact pairing of the groups might influence the conclusions, showing the importance of remaining unbiased in our a priori partitioning of the data like the reviewer accurately pointed out. We aim to account for sample imbalances by pooling the paleolithic and mesolithic samples together and instead of just testing pre- versus post- Neolithic samples we perform a pairwise comparison between neighbouring historical periods using a T test thereby taking into account the sample size of each group.
—The authors only talk about partitions before and after the Neolithic, but plots are colored by multiple other periods. Why is the pre- and post-Neolithic the only transition that is mentioned?
Our initial hypothesis was that the pre-versus post-Neolithic shift was a turning point for immune responses. However, based on the suggestions of the reviewers, we have decided to perform the analysis in a more unbiased way, so we show the comparison of different individual era's. The new analyses and the new Figures provided address these issues.
—Extrapolating polygenic scores to the distant past is especially problematic given recent findings about the poor portability of scores across populations (Martin et al. 2017, 2019) and the sensitivity of tests of polygenic adaptation to the choice of GWAS reference used to derive effect size estimates (Berg et al. 2019, Sohail et al. 2019). In addition to being more heavily under-represented, paleolithic hunter-gatherers are the most differentiated populations in the time series relative to the GWAS reference data, and so presumably they are also the genomes for which PGS estimates built using such a reference would have higher error (see, e.g. Rosenberg et al. 2019). Some analyses showing how believable these scores are is warranted (perhaps by comparing to phenotypes in distant present-day populations with equivalent amounts of differentiation to the GWAS panel).
A similar study regarding standing height in ancient populations (PMID: 31594846) validated this approach when comparing polygenic scores based on modern populations with skeletal remains from ancient individuals. We do acknowledge the absolute results of the polygenic scores are less accurate for aDNA samples compared to a modern European cohort. The effect size estimates gained using a modern cohort are less accurate for aDNA samples than unrelated modern samples, and this is certainly an unavoidable limitation of the study.This is the reason why we focus on the direction of change of the trends and not on the absolute polygenic scores since such subtle differences do not affect the conclusions of our study.
—In multiple parts of the paper, the authors mention "adaptation" as equivalent to the patterns they claim to have found, but alternative hypotheses like genetic drift are not tested (see e.g. Guo et al. 2018 for a review of methods that could be used for this).
We thank the reviewer for this feedback. Based on this, we have added an Fst based test for selection to determine whether the changes we see in PRS over time are due to selection or due to genetic drift. This test shows that changes between the pre-Neolithic to Neolithic are not significantly different from drift whereas after the onset of the Neolithic we do see significant amount of selection. We have explained this further in the manuscript on lines 130-135 and included the new Table S2.

New Table S2 : Tests for selection as opposed to genetic drift were performed between populations from adjacent time periods. A two tailed test was used to determine whether mean trait Fst between pre-Neolithic - Neolithic, Neolithic - post-Neolithic, and post-Neolithic - Modern samples was significantly different compared to 10000 random LD and MAF matched mean Fst’s calculated using a same amount of SNP’s.
—250 kb window is too short a physical distance for ensuring associated loci that are included in the score are not in LD, and much shorter than standard approaches for building polygenic scores in a population genomic context (e.g. see Berg et al. 2019, Berisa et al. 2016). Is this a robust correction for LD?
We thank the reviewer for this remark, we tested multiple thresholds for window sizes, increasing the window size from 250 kb to 500 kb and 1000 kb (please see below new Figure 1-figure supplement 2) Although the level of significance changes for a few traits, the direction of the change remains stable across the three thresholds, demonstrating the robustness of our results. We have chosen this approach because the aDNA samples present a too high error rate and contain a relatively high amount of missing data to accurately determine LD, and determining LD using a modern reference cohort would bias our analysis by assuming the aDNA samples have a similar LD structure as modern samples.
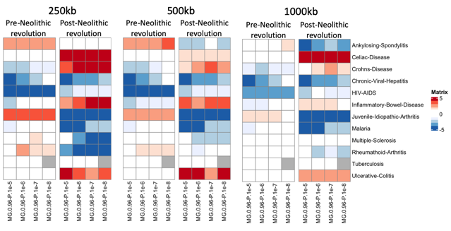
New Figure 1-figure supplement 2: PRS correlation pre- and post-Neolithic revolution using polygenic scores calculated at varying window sizes.
We have edited the manuscript accordingly to show the consistency between these varying window sizes on lines 111-113.
—If one substitutes dosage with the average genotyped dosage for a variant from the entire dataset, then one is biasing towards the partitions of the dataset that are over-represented, in this case, post-Neolithic samples.
We fully agree with the reviewer, however the substitution of missing dosages with average dosages prevents the introduction of the bias in our models caused by varying amounts of missing SNPs in the older samples. Although our average scores on an absolute level are largely influenced by the more abundant post-Neolithic samples, this reduces the odds of wrongfully observing significant trends caused by the sparsity of the data. While the absolute scores might be biased towards a certain value, the differences and thus the direction of the change in PRS is affected by the non-missing variants in each sample.
—It seems from Figure 2, that some scores are indeed very sensitive to the choice of P-value cutoff (e.g., Malaria, Tuberculosis) and to the amount of missing data (e.g. HIV). This should be highlighted in the main text.
The reviewer is right, and this is largely due to the fewer number of SNPs that are included in the model at stricter p-value cutoffs, which is in part a limitation of the available GWAS summary statistics. Using fewer SNPs in our PRS calculations reduces the variability between different samples which weakens our ability to accurately model changes in these specific complex traits and detect statistical significance. We have highlighted this in the main text on lines 193-196.
—Some of the score distributions look a bit strange, like the Tuberculosis ones in Figure 2, which appear concentrated into particular values. Could this be because some of the scores are made with very few component SNPs?
We thank the reviewer for pointing this out and this is indeed correct. At stricter thresholds fewer significant QTLs will be included in the polygenic score model. We chose to still show these plots to point out those results might more easily differ if more variants could be included. At more lenient thresholds more variants can be included increasing the power of the model but the score might be less informative for the trait that way.
-
Reviewer #2 (Public Review):
In "Evolution of cytokine production capacity in ancient and modern European populations", Dominguez-Andrés et al. collect a large amount of trait association data from various studies on immune-mediated disorders and cytokine production, and use this data to create polygenic scores in ancient genomes. They then use the scores to attempt to test whether the Neolithic transition was characterized by strong changes in the adaptive response to pathogens. The impact of pathogens in human prehistory and the evolutionary response to them is an intriguing line of inquiry that is now beginning to be approachable with the rapidly increasing availability of ancient genomes.
While the study shows a commendable collection of association data, great expertise in immune biology and an interesting study question, the …
Reviewer #2 (Public Review):
In "Evolution of cytokine production capacity in ancient and modern European populations", Dominguez-Andrés et al. collect a large amount of trait association data from various studies on immune-mediated disorders and cytokine production, and use this data to create polygenic scores in ancient genomes. They then use the scores to attempt to test whether the Neolithic transition was characterized by strong changes in the adaptive response to pathogens. The impact of pathogens in human prehistory and the evolutionary response to them is an intriguing line of inquiry that is now beginning to be approachable with the rapidly increasing availability of ancient genomes.
While the study shows a commendable collection of association data, great expertise in immune biology and an interesting study question, the manuscript suffers from severe statistical issues, which makes me doubt the validity and robustness of their conclusions. I list my concerns below, in rough order of how important I believe they are to the claims of the paper:
— In addition to the magnitude of an effect away from the null, P-values are a function of the amount of data one has to fit a model or test a hypothesis. In this case, the authors have vastly more data after the Neolithic Revolution than before, and so have much higher power to reject the null hypothesis of "no relationship to time" after the revolution than before. One can see this in the plots the authors provided, which show vastly more data after the Neolithic, and consequently a greater ability to fit a significant linear model (in any direction) afterwards as well.
— The authors argue that Figure S2 makes their results robust to sample size differences, but showing a consistency in direction before and after downsampling in the post-neolithic samples is not enough, because:
you still lack power to detect changes in direction before the Neolithic.
even for the post-Neolithic, the relationship may be in the same direction but no longer significant after downsampling. How much the significance of the linear model fit is affected by the downsampling is not shown.
— The authors chose to test "relationship between PRS with time" before and after the Neolithic as a way to demonstrate that "the advent of the Neolithic was a turning point for immune-mediated traits in Europeans". A more appropriate way to test this would be creating a model that incorporates both sets of scores together, accounts for both sample size and genetic drift in the change of polygenic scores, and shows a significant shift occurs particularly in the Neolithic, rather in any other time period, instead of choosing the Neolithic as an "a priori" partition of the data. My guess is that one could have partitioned the data into pre- and post-Mesolithic and gotten similar results, largely due to imbalances in data availability.
— The authors only talk about partitions before and after the Neolithic, but plots are colored by multiple other periods. Why is the pre- and post-Neolithic the only transition that is mentioned?
— Extrapolating polygenic scores to the distant past is especially problematic given recent findings about the poor portability of scores across populations (Martin et al. 2017, 2019) and the sensitivity of tests of polygenic adaptation to the choice of GWAS reference used to derive effect size estimates (Berg et al. 2019, Sohail et al. 2019). In addition to being more heavily under-represented, paleolithic hunter-gatherers are the most differentiated populations in the time series relative to the GWAS reference data, and so presumably they are also the genomes for which PGS estimates built using such a reference would have higher error (see, e.g. Rosenberg et al. 2019). Some analyses showing how believable these scores are is warranted (perhaps by comparing to phenotypes in distant present-day populations with equivalent amounts of differentiation to the GWAS panel).
— In multiple parts of the paper, the authors mention "adaptation" as equivalent to the patterns they claim to have found, but alternative hypotheses like genetic drift are not tested (see e.g. Guo et al. 2018 for a review of methods that could be used for this).
— 250 kb window is too short a physical distance for ensuring associated loci that are included in the score are not in LD, and much shorter than standard approaches for building polygenic scores in a population genomic context (e.g. see Berg et al. 2019, Berisa et al. 2016). Is this a robust correction for LD?
— If one substitutes dosage with the average genotyped dosage for a variant from the entire dataset, then one is biasing towards the partitions of the dataset that are over-represented, in this case, post-Neolithic samples.
— It seems from Figure 2, that some scores are indeed very sensitive to the choice of P-value cutoff (e.g., Malaria, Tuberculosis) and to the amount of missing data (e.g. HIV). This should be highlighted in the main text.
— Some of the score distributions look a bit strange, like the Tuberculosis ones in Figure 2, which appear concentrated into particular values. Could this be because some of the scores are made with very few component SNPs?
-
Reviewer #1 (Public Review):
This paper focuses on the role of historical evolutionary patterns that lead to genetic adaptation in cytokine production and immune mediated diseases including infectious, inflammatory, and autoimmune diseases. The overall goal of this research was to track the evolutionary trajectories of cytokine production capacity over time in a number of patients with different exposure to infectious organisms, infectious disease, autoimmune and inflammatory diseases using the 500 Functional Genomics cohort of the Human Functional Genomics Project. The identified cohort is made up of 534 individuals of Western European ancestry. Much of this focus is on the impact and limitations of certain datasets that they have chosen to use such as the "average genotyped dosage" to be substituted for missing variants and data …
Reviewer #1 (Public Review):
This paper focuses on the role of historical evolutionary patterns that lead to genetic adaptation in cytokine production and immune mediated diseases including infectious, inflammatory, and autoimmune diseases. The overall goal of this research was to track the evolutionary trajectories of cytokine production capacity over time in a number of patients with different exposure to infectious organisms, infectious disease, autoimmune and inflammatory diseases using the 500 Functional Genomics cohort of the Human Functional Genomics Project. The identified cohort is made up of 534 individuals of Western European ancestry. Much of this focus is on the impact and limitations of certain datasets that they have chosen to use such as the "average genotyped dosage" to be substituted for missing variants and data interpretation. Moreover, some data pairings in the data set are not complete or had varying time points . Similarly, a split was done to look at before and after the Neolithic era and the linear regression correspond to those two eras. However, the authors do not comment or show the data to demonstrate why they choose that specific breakpoint as opposed to looking at every historical era transition, i.e., from early upper paleolithic to late upper paleolithic to Mesolithic to Neolithic to post-Neolithic to modern. Lastly, the authors should highlight additional limitations of this current study in terms of the generalizability to other populations or to clearly state that this is limited to the European population at the specified latitude and longitudes used.
-
Evaluation Summary:
Dominguez-Andrés et al. collect a large amount of immune-related trait association data from a cohort made up of 534 individuals of Western European ancestry. The goal was to track the evolutionary trajectories of cytokine production capacity over time in a number of patients with different exposure to infectious organisms, infectious disease, autoimmune and inflammatory diseases, using the 500 Functional Genomics cohort of the Human Functional Genomics Project. From this analysis it was hypothesized that the Neolithic transition was characterized by strong changes in the adaptive response to pathogens in human biology. Overall, the manuscript is interesting but could be improved by significant enhancements to statistical methodology.
(This preprint has been reviewed by eLife. We include the public reviews from the …
Evaluation Summary:
Dominguez-Andrés et al. collect a large amount of immune-related trait association data from a cohort made up of 534 individuals of Western European ancestry. The goal was to track the evolutionary trajectories of cytokine production capacity over time in a number of patients with different exposure to infectious organisms, infectious disease, autoimmune and inflammatory diseases, using the 500 Functional Genomics cohort of the Human Functional Genomics Project. From this analysis it was hypothesized that the Neolithic transition was characterized by strong changes in the adaptive response to pathogens in human biology. Overall, the manuscript is interesting but could be improved by significant enhancements to statistical methodology.
(This preprint has been reviewed by eLife. We include the public reviews from the reviewers here; the authors also receive private feedback with suggested changes to the manuscript. Reviewer #2 agreed to share their name with the authors.)
-
