Modality-specific tracking of attention and sensory statistics in the human electrophysiological spectral exponent
Curation statements for this article:-
Curated by eLife

Evaluation Summary:
This manuscript reports on two separate investigations. In the first, the authors provide novel evidence from two anaesthesia challenges that the slope of the 1/f structure of the power spectrum of the EEG fluctuates in a manner that tracks the presumed excitation : inhibition (E:I) balance of the tissue generating the EEG signal. Next they show that fluctuations in this slope also covary in systematic and modality- and stimulus-specific ways with behavioural performance on a multimodal attention task. These observations have potential foundational implications for how this previously unappreciated component of the EEG can be interpreted in terms of brain physiology and function. While the methodology employed is novel and interesting, the data as they stand, do not yet support the strong conclusions proposed by the authors.
(This preprint has been reviewed by eLife. We include the public reviews from the reviewers here; the authors also receive private feedback with suggested changes to the manuscript. Reviewer #1 and Reviewer #2 agreed to share their names with the authors.)
This article has been Reviewed by the following groups
Discuss this preprint
Start a discussion What are Sciety discussions?Listed in
- Evaluated articles (eLife)
Abstract
A hallmark of electrophysiological brain activity is its 1/f-like spectrum – power decreases with increasing frequency. The steepness of this ‘roll-off’ is approximated by the spectral exponent, which in invasively recorded neural populations reflects the balance of excitatory to inhibitory neural activity (E:I balance). Here, we first establish that the spectral exponent of non-invasive electroencephalography (EEG) recordings is highly sensitive to general (i.e., anaesthesia-driven) changes in E:I balance. Building on the EEG spectral exponent as a viable marker of E:I, we then demonstrate its sensitivity to the focus of selective attention in an EEG experiment during which participants detected targets in simultaneous audio-visual noise. In addition to these endogenous changes in E:I balance, EEG spectral exponents over auditory and visual sensory cortices also tracked auditory and visual stimulus spectral exponents, respectively. Individuals’ degree of this selective stimulus–brain coupling in spectral exponents predicted behavioural performance. Our results highlight the rich information contained in 1/f-like neural activity, providing a window into diverse neural processes previously thought to be inaccessible in non-invasive human recordings.
Article activity feed
-

-

Author Response:
Reviewer #1 (Public Review):
"Modality-specific tracking of attention and sensory statistics in the human electrophysiological spectral exponent," Waschke et al. This paper follows upon a recent paper by a subset of the same authors that laid out the signal processing-bases for decomposing the EEG signal into periodic (i.e., "oscillatory") and aperiodic components (Donoghue et al., 2020). Here, the focus is on establishing physiological and functional interpretations of one of these aperiodic components: the exponent term of the 1/f(to the x power) fit to the power spectrum (a.k.a., its 'slope'). This is very important work that will have strong and lasting impact on how people design and interpret the results from EEG experiments, and is also likely to trigger many reanalyses of previously published data sets. …
Author Response:
Reviewer #1 (Public Review):
"Modality-specific tracking of attention and sensory statistics in the human electrophysiological spectral exponent," Waschke et al. This paper follows upon a recent paper by a subset of the same authors that laid out the signal processing-bases for decomposing the EEG signal into periodic (i.e., "oscillatory") and aperiodic components (Donoghue et al., 2020). Here, the focus is on establishing physiological and functional interpretations of one of these aperiodic components: the exponent term of the 1/f(to the x power) fit to the power spectrum (a.k.a., its 'slope'). This is very important work that will have strong and lasting impact on how people design and interpret the results from EEG experiments, and is also likely to trigger many reanalyses of previously published data sets. However, the manuscript could do a better job of explain WHY this is so. In this reviewer's opinion, more linkage with elements of Donoghue et al. (2020). would help considerably.
First, a brief summary of what this manuscript does, and why it is important. The first section reanalyzes data sets in human subjects undergoing ketamine or propofol anaesthesia, known to influence the E:I balance in the neural circuits that give rise to the EEG. This is an important step in establishing the physiological validity of the fundamental proposition that flattening of the 1/f component reflects an increase in the E:I balance whereas steepening reflects a decrease. This is because these effects of these two anaesthetic agents has been well established in several invasive studies. The second section demonstrates the functional properties of 1/f slope, in that tracks shifts of attention between visual and auditory stimuli in an electrode-specific manner (i.e., posterior for visual, central for auditory), and it also captures aperiodic stucture in these stimuli. It's not too strong to say that, after this paper, EEG-related research will never be the same again. The reason for this, however, isn't stated as clearly as it could be.
Thank you for your positive appraisal of our work! We appreciate that you see significant benefit to this work, and also understand that you see significant room from improvements in the way results are presented, framed and discussed and want to express our thanks for these helpful comments. Below, we elaborate on them and the changes they prompted in greater detail.
With regard to exposition, the manuscript could be improved in terms of building on Donoghue et al. (2020). To simplify, a main take-away from Donoghue et al. (2020) is that many past interpretations of EEG signals have mistakenly attributed to task- (or state-) related changes to changes in one or more oscillatory components of the signal. Perhaps most egregiously, what can appear as a change in power in the alpha band can often be shown to be better explained as no change in alpha but instead a change in either the slope or the offset of the 1/f component of the power spectrum. (E.g., the bump at 10 Hz will increase or decrease if the slope of the 1/f component changes, even though the 'true' oscillator centered at 10 Hz hasn't changed.) In this paper, the authors demonstrate that many conditions, physiological state and cognitive challenge, influence 1/f slope in ways that are systematic and that occur independent of changes that may or may not be occuring simultaneously in oscillatory alpha. Broadly, the authors should consider two modifications: first, point out for each key experimental finding how attributing everything to changes in oscillatory alpha (or sometimes other frequencies) would lead to flawed inference; second, don't stop at demonstrating that the slope effects hold when alpha dynamics are partialed out, but also report the converse -- in what ways is oscillatory alpha sensitive to aspects of physiology and/or behavior that 1/f slope is not? Even if there aren't any such cases (which seems unlikely) it would be informative for this to be tested and reported.
We agree that a stronger focus on the differentiation between oscillatory and 1/f aspects of EEG activity can help to improve the didactic strength of our manuscript. Wherever possible, we have tried to make clear that the separation of different oscillatory activity and aperiodic signals is essential to not confuse one for the other. This is not only the case for the analysis of anaesthesia data were changes in alpha and beta power have to be separated from changes in spectral exponent but also applies to the proposed attention contrast where common effects of alpha power have to be taken into account and differentiated from spectral exponents. Similarly, an alignment of stimulus spectra with EEG activity could appear as a twofold power change (e.g., increase over low, decrease over high frequencies) if no separation of oscillatory and aperiodic signal parts is performed.
We agree that explicitly contrasting spectral exponents with estimates of low-frequency or alpha power is essential. The original version of the manuscript already included such a comparison for the effect of attention on EEG spectral exponents and alpha power, respectively. To expand this approach, we inverted models and used stimulus spectral exponents (auditory or visual) as dependent variables while using either EEG spectral exponents, low-frequency power or alpha power as predictors (among the same covariates as in the winning models of the original approach). In a next step, we used likelihood ratio tests to compare model fit separately at each electrode, resulting in a topography of model comparisons.
(a) Attention contrasts
As expected, based on decades of EEG research, and as can be seen in figure 3C, average EEG alpha power changed as a function of attentional focus, in a topographically specific manner. Importantly, the observed increase of alpha power from auditory to visual attention took place over and above the reported changes in EEG spectral exponents (as we had reported in the control analyses section). In other words, both EEG spectral exponents and EEG alpha power capture attention-related changes in brain dynamics, but are at least partially sensitive to distinct sources or mechanisms. In the updated version of the manuscript, we emphasize that changes in spectral exponents often can be mistaken for changes in alpha power (as in Donoghue et al., 2020), calling for a dedicated spectral parameterization approach. Attention-related changes in spectral exponents and alpha power might depict results of distinct modes of thalamic activity that transitions from tonic to bursty firing and shapes cortical activity to selectively process attended sensory input. In the updated version of the manuscript, we discuss the potential role of thalamic activity in greater detail. The updated parts of the discussion section are pasted below for convenience.
“Despite these differences in the sensitivity of EEG signals, our results provide clear evidence for a modality-specific flattening of EEG spectra through the selective allocation of attentional resources. This attention allocation likely surfaces as subtle changes in E:I balance (Borgers et al., 2005; Harris and Thiele, 2011). Importantly, these results cannot be explained by observed attention-dependent differences in neural alpha power (8–12 Hz, Fig 3) which have been suggested to capture cortical inhibition or idling states (Cooper et al., 2003; Pfurtscheller et al., 1996). Also note that the employed spectral parameterization approach enabled to us to separate 1/f like signals from oscillatory activity and hence offered distinct estimates of spectral exponent and alpha power that would otherwise have been conflated (Donoghue et al., 2020).
How could attentional goals come to shape spectral exponents and alpha oscillations? Both attention-related changes in EEG activity might trace back to distinct functions of thalamo-cortical circuits. On the one hand, bursts of thalamic activity that project towards sensory cortical areas might sculpt cortical excitability in an attention-dependent manner by inhibiting irrelevant distracting information (Klimesch et al., 2007; Saalmann and Kastner, 2011). On the other hand, tonic thalamic activity likely drives cortical desynchronization via glutamatergic projections and, with attentional focus, results in boosted representations of stimulus information within brain signals (Cohen and Maunsell, 2011; Harris and Thiele, 2011; Sherman, 2001).
Our findings of separate attentional modulations of both, EEG spectral exponents and alpha power, point towards the involvement of both thalamic modes in the realization of attentional states. Recently, momentary trade-offs between both modes of thalamic activity have been suggested to give way to attention-related modulations of alpha power and E:I balance, as captured by EEG spectral exponents (Kosciessa et al., 2021). Here, task difficulty remained constant throughout the experiment an fluctuations between both modes might not follow momentary demand (Kosciessa et al., 2021; Pettine et al., 2021) but varying sensory-cognitive resources.
Additionally, modulations of both alpha power and EEG spectral exponents appeared uncorrelated across individuals - further evidence that they reflect separate neural sources. Future studies that combine a systemic manipulation of E:I (e.g., through GABAergic agonists) with the investigation of attentional load in humans are needed to specify with greater detail how thalamic activity modes drive alpha oscillations and EEG spectral exponents. Specifying potential demand- and resource-dependent trade-offs between different modes of attention-related modulations of cortical activity and sensory processing will offer crucial insights into the neural basis of adaptive behaviour.”
(b) Stimulus spectral exponent tracking
We inverted all models and instead of modelling EEG spectral exponents, we used auditory or visual stimulus exponents as dependent variables. Predictors were identical to the previously reported models (see supplementary table for all details) but additionally included either single trial estimates of alpha power, low-frequency power, or EEG spectral exponents. Note that alpha power estimates were extracted using the same spectral parameterization approach that was used to estimate spectral exponents. Trials without an oscillation in the alpha range were excluded from all models to render likelihood comparisons interpretable (11.2% 3.4 %). Since oscillations were only seldomly detected in the low-frequency range (1–5 Hz), we instead used single trial power averaged across this range. For each electrode, 4 likelihood ratio tests were performed, one for each stimulus modality and one for each predictor (low-frequency or alpha power). Strikingly, low-frequency power resulted in worse model fits (non-positive likelihood ratio test statistics) compared to EEG spectral exponents across all electrodes and both stimulus modalities. The same was true for EEG alpha power when modelling auditory stimulus exponents. However, when modelling visual stimulus exponents, EEG alpha power displayed significantly improved model fit at one parietal electrode. In line with this observation, we observed a positive relationship between single trial alpha power and visual stimulus exponents at this parietal site (see below).
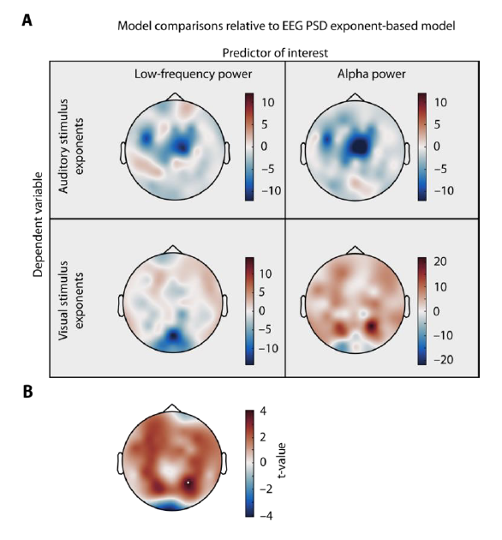
Figure R5 Model comparison topographies. (a) Single trial auditory (upper row) or visual stimulus exponents (lower row) were modelled based on electrode wise low frequency power (left column) or alpha power (right) column, among other covariates. Models were compare d to a model of same size that only differed in the main predictor that consisted of single trial EEG spectral exponents. Topographies display the likelihood ratio test statistic, illustrating no improvements in model fit compared to EEG spectral exponent based models in all but one model family, illustrating the unique predictive power of aperiodic EEG activity in this context. Alpha power at one parietal electrode explained significantly more variance in visual stimulus exponents. (b) T values representi ng the main effect of alpha power on visual stimulus exponents. Highlighted electrode represents p< .05 after FDR correction.
(c) Behavioural relevance of spectral exponent tracking
Given the results from (b), we refrained from re-running PLS analysis focussing on the behavioural relevance of the links between low-frequency and alpha power with stimulus exponents. In our view, the absence of a significant link between single trial stimulus input and a measure of neural activity in this case precludes any further analysis on the between-subject level.
Reviewer #2 (Public Review):
The paper investigates two separate studies looking at the spectral exponent of the EEG 1/f-like spectrum: one a study of the effect of anesthesia type (propofol vs. ketamine), using publicly available data, and the other a traditional study of auditory and visual processing relying on selective attention to one modality vs. the other. The authors make a strong case that the value of the spectral exponent depends on the relevant condition, in both studies, but the case for the spectral exponent's dependence on the Excitation:Inhibition balance is much weaker.
The paper presents the two separate studies as tightly linked, but by the end of the paper it appears they may be quite separate.
The anesthesia study is brief and compelling. With respect to the effect of anesthesia type on spectral exponent, the results are very strong, and, given the results of Gao et al. (2017) and the stated properties of propofol vs. ketamine, the connection to E:I balance follows naturally.
The auditory and spectral 1/f tracking study suffers from some weaknesses.
Most importantly, the design is elegant and the results presented are very compelling. 1) Modality-specific attention selectively reduces the EEG spectral exponent (for relevant electrodes reflecting cortical processing of that modality); 2) Changing the value of the spectral exponent in the stimulus results in a similar change in the value of the spectral exponent of the response, but only for the selectively attended modality (and only for relevant electrodes); and 3) the amount of modality-specific spectral-exponent tracking predicts behavior. The interactions and main effects found all support the importance of the spectral exponent as a physiologically and behaviorally important index.
The main problem is a weakness in analysis regarding whether the mechanistic origin of the above effects may be due to temporal tracking of the stimulus waveform (visual contrast/acoustic envelope) by the response waveform. [In the speech literature this would be referred to as "speech tracking", or, sometimes, as speech entrainment (in the weak sense of "entrainment").] As pointed out by the authors, this is not a steady state response because the instantaneous fluctuation rate of the stimulus is constantly changing, and so cannot be analyzed as such (it is also distinct from the evoked responses analyzed). But it is a good match for other analysis methods, for instance Ed Lalor's VESPA and AESPA methods, and their reverse-correlation descendants. Specifically, Lalor et al., 2009 analyzed EEG responses to a non-sinusoidal envelope modulation of a broadband noise carrier and found strong evidence for robust temporal locking. The success of such linear methods there (AESPA for auditory; VESPA for visual) implies that a change in the stimulus spectrum exponent would produce a similar change in the response spectrum exponent, having nothing to do with E:I balance.
The evoked response analysis clearly aims to go in this direction, but since it does not reflect ongoing response properties, it cannot alone speak to this.
Because this plausible mechanism for the spectral-exponent-tracking has not been explored, it is much harder to associate the observed spectral-exponent-tracking as originating from E:I balance. The study does not then hold together well with the anesthesia study, and weakens the links to E:I balance rather than strengthening it.
Thank you for this in-depth assessment of our work and your general positive appraisal of it. Importantly, your major point of concern seems to at least partially trace back to a regrettable misunderstanding caused by the way we presented our results in the original version of the manuscript. While the first study aimed at establishing the validity of the EEG spectral exponent as a non-invasive marker of E:I, the second study had two objectives. First, to test attention-related changes in EEG spectral exponents that we assume to depict topographically specific changes in E:I. Second, to test the link between aperiodic stimulus features and aperiodic EEG activity by comparing stimulus spectral exponents and EEG spectral exponents. We understand that the reviewer is doubtful of the link between stimulus-related EEG spectral exponent changes and E:I – and so are we.
In the updated version of the manuscript, we have tried to make it very clear that despite the displayed and inferred links between EEG spectral exponents and E:I balance, the positive relationship between stimulus spectral exponents and EEG spectral exponents does not necessarily reflect changes in E:I. Nevertheless, we feel that study 1 and 2 integrate well as they offer a comprehensive view on 1/f-like EEG activity and its sensitivity to (1) specific anaesthesia effects, (2) attentional focus, and (3) aperiodic stimulus features in a behaviourally-relevant way. While (1) and (2) can be mapped on to one underlying mechanism, cortical E:I balance, (3) rather represents bottom-up sensory cortical effects similar to those described in SSEP or speech tracking literature. The interaction of attentional focus and stimulus tracking illustrates the connection between top-down (or anaesthesia-driven) changes in E:I as captured by the EEG spectral exponent, and bottom-up sensory-related changes in EEG activity.
Reviewer #3 (Public Review):
The balance between excitation and inhibition in the cortex is an interesting topic, and it has already been a focus of study for a while. The current manuscript focuses on the 1/f slope of the EEG spectra as the neural substrate of the change in the balance between excitation and inhibition. While the approach they use to analyze their data is interesting, unfortunately, for the reasons I'll outline below the study's conclusions are not supported by the data, and the findings do not add any new insight conceptually or mechanistically to our understanding of attention, excitation or inhibition. While the study aims to "test the conjecture that 1/f-like EEG activity captures changes in the E:I balance of underlying neural populations.", ultimately the central conclusions of the work is just conjecture in that they are inference formed without sufficient evidence.
Anaesthesia study: EEG spectral exponents as a non-invasive approximation of E:I balance The authors observe the 1/f slope was different over pre-selected central electrodes sites between 4 participants undergoing ketamine and propofol anaesthesia. The rather small sample size is a cause for concern, as are the authors' rationale for looking at the central electrodes -they claim these electrodes receive contributions from many cortical and subcortical sources, but that can be said of any other electrodes at the scalp. But I believe the most critical weakness here is the authors' claim that during anaesthesia is that propofol is "known" to result in a "net" increase of inhibition, while ketamine an increase in net excitation. We still know very little about what neurophysiologically is happening under anaesthesia and the concept of "net" inhibition and excitation is rather a gross simplification of what happens to the central nervous system under these two agents. Just as an example, propofol has been found to have some excitatory influence on brain function, with dosage of the anaesthetic also playing role: https://www.ncbi.nlm.nih.gov/pmc/articles/PMC2717965/. On the other hand, ketamine has been observed to inhibit interneurons and cortical stimulus-locked responses, but cause excitation in the auditory cortex : https://physoc.onlinelibrary.wiley.com/doi/10.1113/JP279705.
Suffice to say the interaction between anaesthetic agents and the brain is rather complex. Decades of research has shown that the EEG spectra changes during anaesthesia. To rather arbitrarily say one agent has a net inhibitory impact while another excitatory impact, then link those to qualitative changes in the EEG spectra of 4 participants, and further link that back to E:I ratio is committing the scientific fallacy of Begging the Claim.
We thank the reviewer for their insightful comments. Of course, we do not wish to challenge the complex nature of anaesthetic effects by any means and apologize if the original version of our manuscript had left that impression. Below, we outline that despite the complex impact of anaesthesia on central nervous activity, there exists plenty of evidence justifying our assumption of differentially altered E:I balance through propofol and ketamine, at least in cortical areas.
First of all, we agree with the reviewer that a change in E:I balance certainly is not the only change that takes place in the central nervous system during anaesthesia. As has been shown before, propofol and ketamine affect the overall level of neural activity (Taub et al., 2013) and spiking (Quirk et al., 2209; Kajiwara et al., 2020), propofol is associated with frontal alpha oscillations and widespread changes in beta power (Purdon et al., 2012). In the updated version of the manuscript, we have added notions to these common patterns and discuss the oscillatory changes we observe in the current dataset.
Importantly, while there might not be a single identifiable mechanism behind the host of different anaesthesia-induced changes in brain activity, there is relative clarity on the fact that higher doses of propofol drive a change in excitatory and inhibitory activity towards inhibition whereas ketamine drives disinhibition and hence shifts E:I towards excitation. In fact, the study by Deane et al. (2020) reports increased excitation and disinhibition in auditory cortex during ketamine anaesthesia, accompanied by stronger (not weaker, as stated by the reviewer) evoked responses. These findings speak to the validity of the simplification of a net increase of excitation under ketamine anaesthesia. Furthermore, the modelling results by McCarthy et al. (2008) target a dose- and cell-ensemble specific effect of propofol anaesthesia: paradoxical excitation. The observation that low doses of propofol can induce a temporary increase of excitatory activity is in stark contrast to the general GABA-A-potentiating and hence inhibiting nature of propofol (Concas et al., 1991). Importantly, however, higher doses of propofol as used in the analysed dataset are widely accepted to lead to relatively increased inhibition, even after initial paradoxical excitation (Concas et al., 1991; Zhang et al., 2009; Brown et al., 2011; Ching et al., 2010). Taken together, previous invasive physiology justifies the simplification of propofol as leading to net increased inhibition and ketamine leading to net excitation. Finally, our focus on the spectral exponent does not stem from a disregard of oscillatory changes in EEG activity but rather strictly follows from previous work that demonstrated the spectral exponent as a marker of E:I balance (Gao et al., 2017; Colombo et al., 2020; Lendner et al., 2021; Chini et al., 2021). Hence, the central goal of the presented analyses and results lies in the transfer of these previous results to non-invasive EEG recordings and the parameterization approach used by us. We hope that this becomes clearer in the updated version of the manuscript and have pasted relevant parts below.
“Both anaesthetics exert widespread effects on the overall level of neural activity (Taub et al., 2013) as well as on oscillatory activity in the range of alpha and beta (8–12 Hz; ~15–30 Hz). Importantly, however, propofol is known to commonly result in a net increase of inhibition (Concas et al., 1991; Franks, 2008) whereas ketamine results in a relative increase of excitation (Deane et al., 2020; Miller et al., 2016). In accordance with invasive work and single cell modelling (Chini et al., 2021; Gao et al., 2017), propofol anaesthesia should thus lead to an increase in the spectral exponent (steepening of the spectrum) and ketamine anaesthesia to a decrease (flattening). Based on previous results, the effect of anaesthesia on EEG spectral exponents is expected to be highly consistent and display little topographical variation (Lendner et al., 2020). For simplicity, we focused on a set of 5 central electrodes that receive contributions from many cortical and subcortical sources (see Fig 1) but report topographically-resolved effects in the supplements (see Fig 1 supplement 1). Here, propofol anaesthesia led to an overall increase in EEG power which was especially pronounced in the alpha-beta range. Ketamine anaesthesia decreased the frequency of alpha oscillations and supressed power in the beta range. Importantly, however, EEG spectral exponents that were estimated while accounting for changes in oscillatory activity increased under propofol and decreased under ketamine anaesthesia in all participants (both ppermuted < .0009, Fig 1). These results replicate previous invasive findings and support the validity of EEG spectral exponents as markers of overall E:I balance in humans.”
“[…] While the EEG spectral exponent as a remote, summary measure of brain electric activity can obviously not quantify local E:I in a given neural population, the non-invasive approximation demonstrated here enables inferences on global neural processes previously only accessible in animals and using invasive methods. Future studies should use a larger sample to directly compare dose-response relationships between GABA-A agonists or antagonists (e.g., Flumanezil) and the EEG spectral exponent as well as common oscillatory changes.”
Regarding the reviewer’s comment on our choice of electrodes we first wish to highlight that several previous studies have revealed that anaesthesia effects commonly appear throughout the cortex of humans (Zhang et al., 2009; Lendner et al., 2020). Nevertheless, we understand that a priori choices of electrodes always are arbitrary to some degree. Hence, we performed pairwise comparisons of EEG spectral exponents between awake rest and anaesthesia (ketamine vs. propofol) at all 60 electrodes, resulting in the topographies of t-values shown below. As can be discerned from these topographies, ketamine anaesthesia entailed a reduction of spectral exponents across most areas of the scalp, peaking at frontal and central sites. Propofol led to increased EEG spectral components across all electrodes without a clear spatial pattern. The absence of an effect at the left mastoid likely traces back to artefactual recordings at that electrode site. In the updated version of the manuscript, we report topographies of comparisons in the supplements (figure 1 supplement 2).
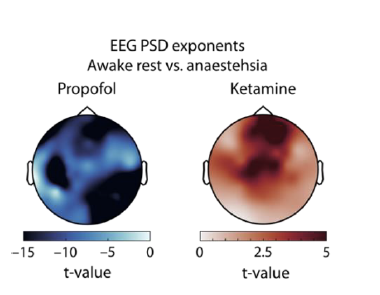
Figure R8 Topographically resolved t statistics comparing EEG spectral exponents between awake rest and different anaesthetics. Propofol leads to a wide spread increase in spectral exponents that is present across the entire scalp (left). Ketamine leads to a reduction in spectral exponents that is widely distributed but appears to peak at frontal and central electrodes (right).
We acknowledge the small sample size of study 1 and have also added a more explicit notion to that in the updated version of our manuscript. Nevertheless, due to their consistency and the used permutation-based statistics which are appropriate for small sample sizes, the results of study can be interpreted. Furthermore, we realized that we had not included two additional participants of the publicly available dataset in our previous analysis. Both sets of recordings (ketamine / propofol) were included in the revised analyses of the data, further strengthening the reported results. Hence, despite the small sample size (now N = 5 per group), we believe that the used methods and the consistency of effects allows for a careful but clear interpretation, especially since they are in close agreement with previous invasive and modelling results as well as recent causal manipulation studies (Gao et al., 2017; Chini et al., 2021).
Cross-modal study: EEG spectral exponents track modality-specific, attention-induced changes in E:I Here the authors observe a difference in 1/f slope depending on if the participants (n=24) were paying attention to the auditory or visual stream. My central issue here is again with the authors' assumptions: cross-modal attention reflects attention-induced E/I. While attention to a single sensory modality can result in decreased activity in cortical regions that process information from an unattended sensory modality, there is no basis here to say that the task-irrelevant region is actually inhibited. The authors here do observe differences in 1/f slope as a function of attentional location, and these differences do account for some of the variances in behavior in the task.
But unfortunately other than a purely descriptive exercise, there is not any sort of mechanistic insight is revealed here with regards to attentional allocation, excitation, and inhibition.
We wish to take this opportunity to briefly elaborate on our hypotheses behind the reported attention contrasts and their interpretation. Spectral exponents of invasively recorded neural field potentials have previously been shown to reflect pronounced changes in E:I balance, including recent causal optogenetic work explicitly testing this link (Gao et al., 2017; Chini, Pfeffer & Haganu-Opatz 2021). In a first step, we analysed data from different anaesthetics to establish the potency of non-invasive EEG recordings to track similar changes (see above). Building on these findings, we tested whether smaller, attention-related and topographically-specific changes in E:I balance can equally be observed by means of EEG spectral exponent changes. Importantly, topographically concise changes in E:I with attention have been reported previously in non-human animals (e.g., Kanashiro et al., 2017; Ni et al., 2018). We found an attention-related topographical pattern of EEG spectral exponents in support of such an idea: spectral exponents at occipital channels decreased during visual attention, pointing towards a relative increase of excitatory activity in visual cortical areas. The same effect was reduced at central electrodes and for auditory attention. These findings demonstrate the potency EEG spectral exponents to detect topographically-specific attention-related changes in brain activity that likely trace back to changes in E:I balance. Of note, we do not imply a role of E:I in the inhibition of unattended sensory input and activity in associated cortical areas but rather point to a potentially separate role of neural alpha power in this context. While it is generally difficult to draw strictly mechanistic insights based on correlational designs, our results at least strongly suggest a mechanistic role of modality-specific attention for EEG dynamics and E:I balance. Furthermore, by demonstrating separate effects of aperiodic activity and alpha power dynamics, we pave the way for a new line of studies (see comments by R1) on the neural dynamics of selective attention and their behavioural relevance in humans.
-
Evaluation Summary:
This manuscript reports on two separate investigations. In the first, the authors provide novel evidence from two anaesthesia challenges that the slope of the 1/f structure of the power spectrum of the EEG fluctuates in a manner that tracks the presumed excitation : inhibition (E:I) balance of the tissue generating the EEG signal. Next they show that fluctuations in this slope also covary in systematic and modality- and stimulus-specific ways with behavioural performance on a multimodal attention task. These observations have potential foundational implications for how this previously unappreciated component of the EEG can be interpreted in terms of brain physiology and function. While the methodology employed is novel and interesting, the data as they stand, do not yet support the strong conclusions proposed by the …
Evaluation Summary:
This manuscript reports on two separate investigations. In the first, the authors provide novel evidence from two anaesthesia challenges that the slope of the 1/f structure of the power spectrum of the EEG fluctuates in a manner that tracks the presumed excitation : inhibition (E:I) balance of the tissue generating the EEG signal. Next they show that fluctuations in this slope also covary in systematic and modality- and stimulus-specific ways with behavioural performance on a multimodal attention task. These observations have potential foundational implications for how this previously unappreciated component of the EEG can be interpreted in terms of brain physiology and function. While the methodology employed is novel and interesting, the data as they stand, do not yet support the strong conclusions proposed by the authors.
(This preprint has been reviewed by eLife. We include the public reviews from the reviewers here; the authors also receive private feedback with suggested changes to the manuscript. Reviewer #1 and Reviewer #2 agreed to share their names with the authors.)
-
Reviewer #1 (Public Review):
"Modality-specific tracking of attention and sensory statistics in the human electrophysiological spectral exponent," Waschke et al. This paper follows upon a recent paper by a subset of the same authors that laid out the signal processing-bases for decomposing the EEG signal into periodic (i.e., "oscillatory") and aperiodic components (Donoghue et al., 2020). Here, the focus is on establishing physiological and functional interpretations of one of these aperiodic components: the exponent term of the 1/f(to the x power) fit to the power spectrum (a.k.a., its 'slope'). This is very important work that will have strong and lasting impact on how people design and interpret the results from EEG experiments, and is also likely to trigger many reanalyses of previously published data sets. However, the manuscript …
Reviewer #1 (Public Review):
"Modality-specific tracking of attention and sensory statistics in the human electrophysiological spectral exponent," Waschke et al. This paper follows upon a recent paper by a subset of the same authors that laid out the signal processing-bases for decomposing the EEG signal into periodic (i.e., "oscillatory") and aperiodic components (Donoghue et al., 2020). Here, the focus is on establishing physiological and functional interpretations of one of these aperiodic components: the exponent term of the 1/f(to the x power) fit to the power spectrum (a.k.a., its 'slope'). This is very important work that will have strong and lasting impact on how people design and interpret the results from EEG experiments, and is also likely to trigger many reanalyses of previously published data sets. However, the manuscript could do a better job of explain WHY this is so. In this reviewer's opinion, more linkage with elements of Donoghue et al. (2020). would help considerably.
First, a brief summary of what this manuscript does, and why it is important. The first section reanalyzes data sets in human subjects undergoing ketamine or propofol anaesthesia, known to influence the E:I balance in the neural circuits that give rise to the EEG. This is an important step in establishing the physiological validity of the fundamental proposition that flattening of the 1/f component reflects an increase in the E:I balance whereas steepening reflects a decrease. This is because these effects of these two anaesthetic agents has been well established in several invasive studies. The second section demonstrates the functional properties of 1/f slope, in that tracks shifts of attention between visual and auditory stimuli in an electrode-specific manner (i.e., posterior for visual, central for auditory), and it also captures aperiodic stucture in these stimuli. It's not too strong to say that, after this paper, EEG-related research will never be the same again. The reason for this, however, isn't stated as clearly as it could be.
With regard to exposition, the manuscript could be improved in terms of building on Donoghue et al. (2020). To simplify, a main take-away from Donoghue et al. (2020) is that many past interpretations of EEG signals have mistakenly attributed to task- (or state-) related changes to changes in one or more oscillatory components of the signal. Perhaps most egregiously, what can appear as a change in power in the alpha band can often be shown to be better explained as no change in alpha but instead a change in either the slope or the offset of the 1/f component of the power spectrum. (E.g., the bump at 10 Hz will increase or decrease if the slope of the 1/f component changes, even though the 'true' oscillator centered at 10 Hz hasn't changed.) In this paper, the authors demonstrate that many conditions, physiological state and cognitive challenge, influence 1/f slope in ways that are systematic and that occur independent of changes that may or may not be occuring simultaneously in oscillatory alpha. Broadly, the authors should consider two modifications: first, point out for each key experimental finding how attributing everything to changes in oscillatory alpha (or sometimes other frequencies) would lead to flawed inference; second, don't stop at demonstrating that the slope effects hold when alpha dynamics are partialed out, but also report the converse -- in what ways is oscillatory alpha sensitive to aspects of physiology and/or behavior that 1/f slope is not? Even if there aren't any such cases (which seems unlikely) it would be informative for this to be tested and reported.
Some more specific suggestions follow in the Recommendations for the authors.
-
Reviewer #2 (Public Review):
The paper investigates two separate studies looking at the spectral exponent of the EEG 1/f-like spectrum: one a study of the effect of anesthesia type (propofol vs. ketamine), using publicly available data, and the other a traditional study of auditory and visual processing relying on selective attention to one modality vs. the other. The authors make a strong case that the value of the spectral exponent depends on the relevant condition, in both studies, but the case for the spectral exponent's dependence on the Excitation:Inhibition balance is much weaker.
The paper presents the two separate studies as tightly linked, but by the end of the paper it appears they may be quite separate.
The anesthesia study is brief and compelling. With respect to the effect of anesthesia type on spectral exponent, the …
Reviewer #2 (Public Review):
The paper investigates two separate studies looking at the spectral exponent of the EEG 1/f-like spectrum: one a study of the effect of anesthesia type (propofol vs. ketamine), using publicly available data, and the other a traditional study of auditory and visual processing relying on selective attention to one modality vs. the other. The authors make a strong case that the value of the spectral exponent depends on the relevant condition, in both studies, but the case for the spectral exponent's dependence on the Excitation:Inhibition balance is much weaker.
The paper presents the two separate studies as tightly linked, but by the end of the paper it appears they may be quite separate.
The anesthesia study is brief and compelling. With respect to the effect of anesthesia type on spectral exponent, the results are very strong, and, given the results of Gao et al. (2017) and the stated properties of propofol vs. ketamine, the connection to E:I balance follows naturally.
The auditory and spectral 1/f tracking study suffers from some weaknesses.
Most importantly, the design is elegant and the results presented are very compelling. 1) Modality-specific attention selectively reduces the EEG spectral exponent (for relevant electrodes reflecting cortical processing of that modality); 2) Changing the value of the spectral exponent in the stimulus results in a similar change in the value of the spectral exponent of the response, but only for the selectively attended modality (and only for relevant electrodes); and 3) the amount of modality-specific spectral-exponent tracking predicts behavior. The interactions and main effects found all support the importance of the spectral exponent as a physiologically and behaviorally important index.
The main problem is a weakness in analysis regarding whether the mechanistic origin of the above effects may be due to temporal tracking of the stimulus waveform (visual contrast/acoustic envelope) by the response waveform. [In the speech literature this would be referred to as "speech tracking", or, sometimes, as speech entrainment (in the weak sense of "entrainment").] As pointed out by the authors, this is not a steady state response because the instantaneous fluctuation rate of the stimulus is constantly changing, and so cannot be analyzed as such (it is also distinct from the evoked responses analyzed). But it is a good match for other analysis methods, for instance Ed Lalor's VESPA and AESPA methods, and their reverse-correlation descendants. Specifically, Lalor et al., 2009 analyzed EEG responses to a non-sinusoidal envelope modulation of a broadband noise carrier and found strong evidence for robust temporal locking. The success of such linear methods there (AESPA for auditory; VESPA for visual) implies that a change in the stimulus spectrum exponent would produce a similar change in the response spectrum exponent, having nothing to do with E:I balance.
The evoked response analysis clearly aims to go in this direction, but since it does not reflect ongoing response properties, it cannot alone speak to this.
Because this plausible mechanism for the spectral-exponent-tracking has not been explored, it is much harder to associate the observed spectral-exponent-tracking as originating from E:I balance. The study does not then hold together well with the anesthesia study, and weakens the links to E:I balance rather than strengthening it.
-
Reviewer #3 (Public Review):
The balance between excitation and inhibition in the cortex is an interesting topic, and it has already been a focus of study for a while.
The current manuscript focuses on the 1/f slope of the EEG spectra as the neural substrate of the change in the balance between excitation and inhibition.
While the approach they use to analyze their data is interesting, unfortunately, for the reasons I'll outline below the study's conclusions are not supported by the data, and the findings do not add any new insight conceptually or mechanistically to our understanding of attention, excitation or inhibition.
While the study aims to "test the conjecture that 1/f-like EEG activity captures changes in the E:I balance of underlying neural populations.", ultimately the central conclusions of the work is just conjecture in …Reviewer #3 (Public Review):
The balance between excitation and inhibition in the cortex is an interesting topic, and it has already been a focus of study for a while.
The current manuscript focuses on the 1/f slope of the EEG spectra as the neural substrate of the change in the balance between excitation and inhibition.
While the approach they use to analyze their data is interesting, unfortunately, for the reasons I'll outline below the study's conclusions are not supported by the data, and the findings do not add any new insight conceptually or mechanistically to our understanding of attention, excitation or inhibition.
While the study aims to "test the conjecture that 1/f-like EEG activity captures changes in the E:I balance of underlying neural populations.", ultimately the central conclusions of the work is just conjecture in that they are inference formed without sufficient evidence.Anaesthesia study: EEG spectral exponents as a non-invasive approximation of E:I balance
The authors observe the 1/f slope was different over pre-selected central electrodes sites between 4 participants undergoing ketamine and propofol anaesthesia. The rather small sample size is a cause for concern, as are the authors' rationale for looking at the central electrodes -they claim these electrodes receive contributions from many cortical and subcortical sources, but that can be said of any other electrodes at the scalp.
But I believe the most critical weakness here is the authors' claim that during anaesthesia is that propofol is "known" to result in a "net" increase of inhibition, while ketamine an increase in net excitation. We still know very little about what neurophysiologically is happening under anaesthesia and the concept of "net" inhibition and excitation is rather a gross simplification of what happens to the central nervous system under these two agents. Just as an example, propofol has been found to have some excitatory influence on brain function, with dosage of the anaesthetic also playing role: https://www.ncbi.nlm.nih.gov/pmc/articles/PMC2717965/. On the other hand, ketamine has been observed to inhibit interneurons and cortical stimulus-locked responses, but cause excitation in the auditory cortex : https://physoc.onlinelibrary.wiley.com/doi/10.1113/JP279705.Suffice to say the interaction between anaesthetic agents and the brain is rather complex. Decades of research has shown that the EEG spectra changes during anaesthesia. To rather arbitrarily say one agent has a net inhibitory impact while another excitatory impact, then link those to qualitative changes in the EEG spectra of 4 participants, and further link that back to E:I ratio is committing the scientific fallacy of Begging the Claim.
Cross-modal study: EEG spectral exponents track modality-specific, attention-induced changes in E:I
Here the authors observe a difference in 1/f slope depending on if the participants (n=24) were paying attention to the auditory or visual stream. My central issue here is again with the authors' assumptions: cross-modal attention reflects attention-induced E/I. While attention to a single sensory modality can result in decreased activity in cortical regions that process information from an unattended sensory modality, there is no basis here to say that the task-irrelevant region is actually inhibited.
The authors here do observe differences in 1/f slope as a function of attentional location, and these differences do account for some of the variances in behavior in the task.But unfortunately other than a purely descriptive exercise, there is not any sort of mechanistic insight is revealed here with regards to attentional allocation, excitation, and inhibition.
-
