Whole-brain connectivity atlas of glutamatergic and GABAergic neurons in the mouse dorsal and median raphe nuclei
Curation statements for this article:-
Curated by eLife

Evaluation Summary:
This work from Xu et al. uses state of the art viral tracing technologies in Cre-transgenic mouse lines to map the inputs and outputs of glutamatergic and GABAergic neuronal populations in the dorsal (DR) and median raphe (MR) nucleus. A large amount of high-quality anatomical dataset was collected with the advanced fMOST whole-brain imaging system. Data analysis was thorough with significant scientific insights. All figures are of high quality. Overall, this study nicely complements previously published work on whole-brain connectivity of the DR and MR which have chiefly focused on the main neuromodulatory neurons found in these nuclei, i.e. serotonin and dopamine neurons, and will be a valuable contribution to understanding neural circuits of the raphe system.
(This preprint has been reviewed by eLife. We include the public reviews from the reviewers here; the authors also receive private feedback with suggested changes to the manuscript. Reviewer #1 agreed to share their name with the authors.)
This article has been Reviewed by the following groups
Discuss this preprint
Start a discussion What are Sciety discussions?Listed in
- Evaluated articles (eLife)
Abstract
The dorsal raphe nucleus (DR) and median raphe nucleus (MR) contain populations of glutamatergic and GABAergic neurons that regulate diverse behavioral functions. However, their whole-brain input-output circuits remain incompletely elucidated. We used viral tracing combined with fluorescence micro-optical sectioning tomography to generate a comprehensive whole-brain atlas of inputs and outputs of glutamatergic and GABAergic neurons in the DR and MR. We found that these neurons received inputs from similar upstream brain regions. The glutamatergic and GABAergic neurons in the same raphe nucleus had divergent projection patterns with differences in critical brain regions. Specifically, MR glutamatergic neurons projected to the lateral habenula through multiple pathways. Correlation and cluster analysis revealed that glutamatergic and GABAergic neurons in the same raphe nucleus received heterogeneous inputs and sent different collateral projections. This connectivity atlas further elucidates the anatomical architecture of the raphe nuclei, which could facilitate better understanding of their behavioral functions.
Article activity feed
-

-

Author Response:
Reviewer #1:
General overview and merit of academic rigor:
Xu et. al put forth an innovative experimental pipeline to examine the connections of the raphe nuclei. This manuscript details elegantly designed viral tract-tracing methods coupled with fMOST intact imaging and sophisticated analyses. All figures are of good quality. The studies presented in the current manuscript will be a valuable contribution to the field, therefore an enthusiastic recommendation for publication is endorsed presently. However, there is a cluster of revisions and clarifications warranted before publication.
Major concerns:
- The manuscript's English needs to be proofread extensively for readability and clarity.
We invited two native English experts to proofread the manuscript's English and revise the whole manuscript.
- The term MR …
Author Response:
Reviewer #1:
General overview and merit of academic rigor:
Xu et. al put forth an innovative experimental pipeline to examine the connections of the raphe nuclei. This manuscript details elegantly designed viral tract-tracing methods coupled with fMOST intact imaging and sophisticated analyses. All figures are of good quality. The studies presented in the current manuscript will be a valuable contribution to the field, therefore an enthusiastic recommendation for publication is endorsed presently. However, there is a cluster of revisions and clarifications warranted before publication.
Major concerns:
- The manuscript's English needs to be proofread extensively for readability and clarity.
We invited two native English experts to proofread the manuscript's English and revise the whole manuscript.
- The term MR (median raphe) is used in the atlas of Paxinos and Franklin. But, the entire study follows the Allen Reference Atlas nomenclature, in which the same raphe nucleus is called the "Superior center nucleus" (CS). To keep consistency, I suggest using "CS" instead of "MR". Alternatively, in the Introduction, please make a clear statement that the MR is equivalent to CS in the Allen Reference Atlas.
As suggested, we added the statement that MR is equivalent to CS in the Allen CCFv3 in Line 15-18.
“The dorsal raphe nucleus (DR) and median raphe nucleus (MR, equivalent to the superior central nucleus raphe in the Allen Mouse Brain Common Coordinate Framework version 3 (Allen CCFv3)) belong to the rostral group of the raphe nuclei and contain most of brain’s serotonergic neurons (Wang et al., 2020; Watson, et al., 2012).”
- In the Introduction, it is unclear the rationale behind the decision to selectively study the DR and MR here (why other raphe nuclei are not included?).
We have revised the Introduction and described why to selectively study the DR and MR in Line 15-25.
“The dorsal raphe nucleus (DR) and median raphe nucleus (MR, equivalent to the superior central nucleus raphe in the Allen Mouse Brain Common Coordinate Framework version 3 (Allen CCFv3)) belong to the rostral group of the raphe nuclei and contain most of brain’s serotonergic neurons (Wang et al., 2020; Watson, et al., 2012). The DR and MR are involved in a multitude of functions (Domonkos et al.,2016; Huang et al., 2019; Szőnyi et al., 2019); moreover, they have different, and even antagonistic roles in the regulation of specific functions, including emotional behavior, social behavior, and aggression (Balázsfi et al., 2018; Ohmura et al., 2020; Teissier et al., 2015). The diverse regulatory processes are related to the connectivity of heterogeneous raphe groups (Muzerelle et al., 2016; Nectow et al., 2017; Schneeberger et al., 2019). Deciphering precise input and output organization of different neuron types in the DR and MR is fundamental for understanding their specific functions.”
- In the Results, I did not find any figure panel or images to show the anatomical location of the MR. Figure 1 shows only one injection site in DR. It is necessary to also show at least one representative injection site in the MR.
As suggested, we added more information of injection site in Figure 1—figure supplement 2 and Figure 4—figure supplement 1.
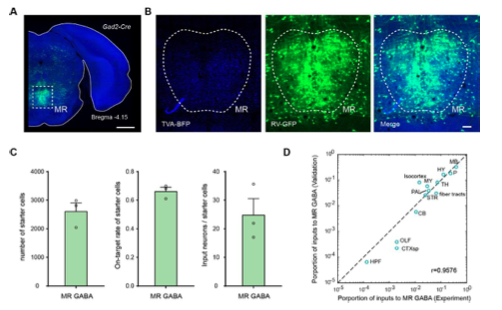
Figure1—figure supplement 2. Validation of the labeling of whole-brain inputs. (A) Representative coronal section of the injection site showing the starter cells (cyan). The image is from a representative sample that label the inputs to MR Gad2+ neurons. Scale bar, 1mm. (B) Enlarged view of dotted box area in (A). Scale bar, 100 μm. (C) The number and on-target rate of labeled starter neurons, and the ratio of input neurons to starter cell. The data are from validation samples that label the inputs to MR Gad2+ neurons. Data are shown as mean ± s.e.m., n = 3. (D) Comparison of inputs to MR Gad2+ neurons.
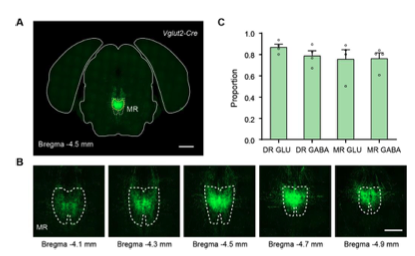
Figure 4—figure supplement 1. Validation of the injection sites of whole-brain outputs. (A) Representative coronal section of the injection site of a representative sample that label the outputs of MR Vglut2+ neurons. The dataset has been registered to the Allen CCFv3. White dotted lines, MR in the Allen CCFv3; Yellow lines, segmented injection site. (B) Representative coronal sections of the injection site of the representative sample in (A). (C) Proportion of signal of the injection site in the DR/MR. Data are shown as mean ± s.e.m., n = 4 per group. Scale bars, A, 1 mm; B, 500 μm.
- This study is designed to map the input/output of two major populations of neurons (Glu+ and GABAergic) in the DR and MR using two cre-driver lines (Vglut2-cre and Gad2-cre). Please clarify how these two cre lines were characterized and whether those cre expressions are consistent with endogenous gene expressions. What are their distribution patterns in the DR and MR? Are they intermingled or relatively segregated? How are their distributions in comparison with that of serotonergic neurons?
The Vglut2-Cre and Gad2-Cre mice were purchased from Jackson Laboratory and carried out genotyping according to the instructions. To verify the expressions characterization and distribution pattern of Vglut2+ and Gad2+ neurons, we crossed the Cre driver line mice with reporter line respectively (Figure 1—figure supplement 1). In the DR, Vglut2+ neurons were mostly found in the rostral part of the DR, while Gad2+ neurons were widely distributed and densely assembled in the lateral DR. In the MR, Vglut2+ neurons were mainly found in the caudal part of the MR, and the Vglut2+ neurons in the rostral part of the MR were mainly distributed laterally; moreover, Gad2+ neurons were distributed throughout the MR. And there are obvious differences between the overall distribution pattern of Vglut2+ and Gad2+ neurons in the same raphe nucleus. Compared with the distribution of serotonergic neurons (http://connectivity.brain-map.org/ transgenic/experiment/100140881), the distribution of Vglut2+ neurons seem to be relatively segregated with them, and the distribution of Gad2+ neurons are intermingled with them.
As Gad2-Cre generally labels all mature GABAergic neurons, while Vglut2-Cre only labels a population of glutamatergic neurons, and there are also numerous Vglut3+ neurons in the DR and MR, we decide to perform experiments to characterize the specificity of the labeled Vglut2+ starter cells. We performed in situ hybridization to characterize the specificity of labeled starter cells in the Vglut2-Cre mice and found that they were Vglut2 positive, with a few simultaneously being Vglut3 positive (Figure 1B,C; Figure1—figure supplement 3), which was confirmed by immunohistochemical staining (Figure 1—figure supplement 4).
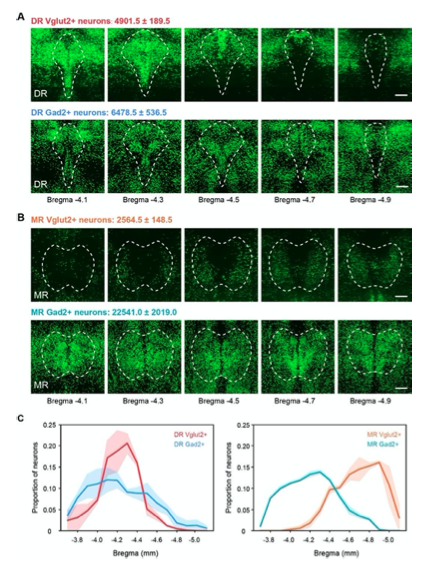
Figure 1—figure supplement 1. Distribution and total number of Vglut2+ and Gad2+ neurons in the DR and MR. (A) Representative coronal sections of maximum intensity projection showing the distribution of Vglut2+ and Gad2+ neurons in the DR. The projections are 200 μm thick. Scale bar, 200 μm. The total number of Vglut2+ and Gad2+ neurons in the DR are presented as mean ± s.e.m., n = 2. (B) Representative coronal sections of maximum intensity projection showing the distribution of Vglut2+ and Gad2+ neurons in the MR. The projections are 200 μm thick. Scale bar, 200 μm. The total number of Vglut2+ and Gad2+ neurons in the MR are presented as mean ± s.e.m., n = 2. (C) Density plot of specific neuron types in the DR and MR along the anterior-posterior axis. Bin width, 100 μm. The shaded area indicates s.e.m., n=2.
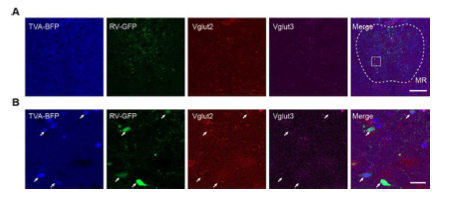
Figure 1—figure supplement 3. Characterization of the specificity of starter cells using in situ hybridization. (A) In situ hybridization at the MR in Vglut2-Cre mouse. (B) Enlarged view of the box area in (A). White arrows, starter cells. Scale bar, A, 200 μm, B, 20 μm.
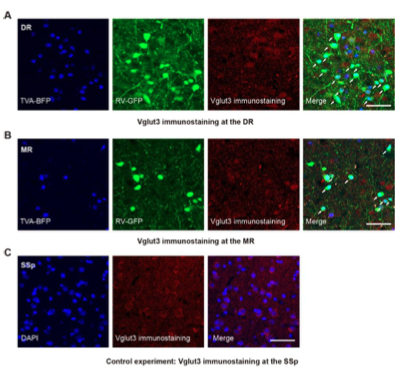
Figure 1—figure supplement 4. Validation of the specificity of starter cells using immunohistochemical staining. (A) Immunohistochemical staining against Vglut3 at the DR in Vglut2-Cre mouse. White arrows, starter cells. Red arrows, starter cells that are Vglut3 positive. (B) Immunohistochemical staining against Vglut3 at the MR in Vglut2-Cre mouse. White arrows, starter neurons. Red arrows, starter cells that are Vglut3 positive. (C) Control experiment, immunohistochemical staining against Vglut3 at the SSp in Vglut2-Cre mouse. Scale bar, 50 μm.
- Overall Discussion is not well organized. I suggest to start with a clear statement about the novel discoveries of this study in comparison with existing literature, and then compare the overall input/output patterns of Glu+ and GABAergic populations in the DR and MR. The current discussion focuses on a few major targets (i.e., CEA, LH), but missed a big picture. Additionally, it is necessary and important to carefully compare their connectivity patterns with that of serotonergic neurons in these two raphe nuclei.
As suggested, we have reorganized the Discussion. At first, we compared the results with existing literature and pointed out the similarities and differences of connectivity patterns compared with that of serotonergic neurons. Then, we compared the overall input/output patterns of glutamatergic and GABAergic neurons in the DR and MR and discussed their implications for behavior functions. At last, we discussed the potential caveats in our viral tracing techniques and data analysis.
Minor concerns:
- The Impact statement reads, "We reconstructed the input-output circuits of glutamatergic and GABAergic neurons in the dorsal raphe nucleus and median raphe nucleus and proposed a more refined model of the habenula-raphe circuit." When a comparison like this is put down, a specific reference to what your method is more refined than is required. This is well explained in lines 242 and 243, "Based on the conventional model of the habenula-raphe circuit (Hikosaka, 2010; Hu et al., 2020), we proposed a more refined model of the habenula-raphe circuit (Figure 5C)." Make a similar claim earlier in the Impact statement.
We have revised the impact statement as follow:
“Whole-brain quantitative input-output circuits of glutamatergic and GABAergic neurons in the mouse dorsal and median raphe nuclei were mapped using viral tracing and high-resolution optical imaging.”
- For Figure 2A, it would be easier on the reader if inputs for each region (DR and MR) and each plane of the section were placed on the same image akin to the inputs presented on coronal maps in Figures 2B and 5A and the inputs/outputs for each region (MR and DR) in the sagittal summary diagrams in Figure 7.
For Figures 2A and 2B, we wanted to present the whole-brain inputs from different perspectives. For Figure 2A, as there were tens of thousands of input neurons and the input patterns were similar, if we placed the inputs on the same image, the color would mix up and it would be difficult to see clearly. Thus, we presented them separately in sagittal and horizonal views in Figure 2A. Further, we presented the inputs together on coronal maps in Figure 2B.
- It is unclear what the nonsignificant grey open circles represent in Figures 3A-D; 4D and E.
In Figures 3A-D, the circles represent the proportion of input neurons in each brain region. If there is a significant difference between the inputs in one brain region to two neuron groups, the circle is red and solid, and the name of the brain region are presented nearby. If there is no significant difference between the inputs in that region to two neuron groups, the circle is gray and hollow. To highlight those brain areas with significant differences, the names of these brain regions are not presented. Moreover, we provided the source data in Supplementary File 2. As for Figures 4D and E, it is akin to Figures 3A-D.
- In Figure 4A, the imaging portion would be clearer if it read "optical sectioning."
As suggested, we revised the image portion to make it clearer.
- In Figure 7A and B, the position of ACA on the flatmap looks odd to me (it is a little bit too caudal).
As suggested, we revised the position of ACA on the flatmap.
Reviewer #2:
This work from Xu et. al. "Whole-brain connectivity atlas of glutamatergic and GABAergic neurons in mouse dorsal and median raphe nucleus" provided a comprehensive brain-wide analysis for input and output patterns to/from specific DR/MR neuronal populations in adult mouse brain. With exceptional strength in experimental approaches for high quality whole brain imaging that this group is famous for, their data and analysis are thorough and convincing for the general conclusion of the manuscript for describing both convergent and divergent patterns of DR/MR connectivity. While the current study is based on structural but not functional correlation analysis, the results are validated with prior knowledge of the field. It will provide a more complete picture to facilitate future investigation of DR/MR connectivity and physiological functions.
The work would provide a significant and useful knowledge for the field, while also promoting the generation and application of advanced brain-wide profiling resource to advance board neuroscience research topics. However, there are still a few technical and analytical concerns that need to be addressed or discussed to refine the conclusions.
Major concerns:
- For targeted injection-based analysis, it is critical to carefully analyze and discuss on-target vs off-target rates of labeled cells in DR/MR to validate the datasets. Whole mount data would best fit for such accurate analysis not possible before.
As for the inputs, samples from the same batch of virus tracing experiments were treated as validation datasets to analyze on-target rates of labeled starter cells. As for samples that label inputs to MR Gad2+ neurons, the on-target rate of labeled starter cells is 66.40 ± 2.78% (Figure 1—figure supplement 2C). And we counted the input neurons and calculated the ratio of input neurons to starter cells (Figure 1—figure supplement 2C). Compared with experiment datasets, they have consistent input patterns (Figure 1—figure supplement 2D). As for the outputs, we manually segmented the injection region and calculated the proportion of signal of the injection region in the DR/MR (Figure 4—figure supplement 1).
- It is also important to know what percentage of the cells get labeled over individual samples, and how many samples and in total what coverage/saturation over the entire anatomical structure has been achieved to justify a complete/comprehensive analysis.
We counted the Vglut2+ and Gad2+ neurons in the DR and MR in crossed mice (Vglut2-Cre: LSL-H2B-GFP mice and Gad2-Cre: LSL-H2B-GFP mice; Figure 1—figure supplement 1A,B). As for the inputs to MR Gad2+ neurons, the labeling rate is 11.60±1.28 % (Figure 1—figure supplement 2C). As for the outputs, we counted the labeled Vglut2+ and Gad2+ neurons in the DR and MR and calculated the percentage (DR Vglut2+: 18.38±8.33%, DR Gad2+: 10.66±2.65%, MR Vglut2+: 43.67±8.25%, MR Gad2+: 11.10±2.09%) (Supplementary File 3). The data were replicated in 4 samples, which was comparable to previous studies of input and output circuits (Ährlund-Richter et al. 2019. Nature Neuroscience, 22: 657–668; Do et al. 2016. eLife, 5: e13214; Gehrlach et al. 2020. eLife, 9: e55585.).
- Further on last point, the labeling rates need to be small enough to warrant a more meaningful analysis in Figure 6. From another aspect, is there any anatomical correlation of the target sites in DR/MR for the distinct input/output clusters? This can probably be best addressed with single neuron resolution analysis that this group is good at. For the current study it is a vital part to include this detailed information for better resource to the field (e.g. to guide or map to future spatial transcriptomic analysis to study molecular-cellular correlations).
Following the previous question, the labeling rate is at a low level, which could ensure that the analysis is meaningful. The analysis in Figure 6 implied that the glutamatergic and GABAergic neurons in the DR/MR might receive inputs from and project to various unions of brain regions. The brain regions in one cluster might be connected with the same subsets of specific neuron types. The brain regions of negative correlation might be connected with distinct subsets of specific neuron types (Weissbourd et al. 2014. Neuron 83: 645–662). As for the inputs to DR Vglut2+ neurons, Vglut2+ neurons receiving inputs from the SNc might be the same as those receiving inputs from the VTA and SNr, but distinct from those receiving inputs from the BST (Figure 6A). These implications are worth illustrating through complete single neuron reconstruction. However, single neuron reconstruction needs substantial time, which is beyond the scope of this work but in our future plans. And our datasets have been registered to the AllenCCFv3, which enables to be directly incorporated to more resource with the same coordinate system. Spatial transcriptome is the current research hotspot, but spatial localization cannot reach the level of single neuron, and it is difficult to integrate with the morphology. We are engaged in this research, but there is no significant progress.
Reviewer #3:
Xu et al utilize retrograde and anterograde viral tracing in Cre-transgenic mouse lines to map the inputs and outputs of glutamatergic and GABAergic neuronal populations in the dorsal (DR) and median raphe (MR) nucleus. The experiments generate a large anatomical dataset which the authors analyse with correlation analysis, revealing subtle differences in connectivity patterns between the targeted cell types and nuclei. The study furthermore focuses on the lateral habenula (LH) to raphe nucleus circuit, identifying large amounts of inputs from the LH to both glutamatergic and GABAergic DR and MR populations, but scarce projections from these cells back to the LH, with some cell-type specific differences. In particular, MR glutamatergic neurons send the strongest projections to LH among the targeted populations, supporting previous studies which identified this pathway as playing a role in aversive behaviors.
Overall, this study nicely complements previously published work on whole-brain connectivity of the DR and MR which have chiefly focused on the main neuromodulatory neurons found in these nuclei, ie. serotonin and dopamine neurons. Some of the experiments in the study are not completely novel, such as input tracing to GAD2-expressing neurons in DR (Weissbourd et al, 2014). However, comprehensive side-by-side comparison analysis between glutamatergic and GABAergic connectivity of both DR and MR nuclei has not been performed before, and will provide a welcome resource to circuit neuroscientist looking to elucidate functional circuits of the raphe nuclei. A further strength of the study is the high-resolution 3D imaging, revealing three distinct projection pathways from MR glutamatergic neurons to LH.
Two main concerns regarding the study are:
- The authors do not sufficiently justify the use of Vglut2 as a marker for glutamatergic neurons in DR and MR. The majority of previous studies, especially of the DR, use another glutamatergic marker which is more specifically expressed in the raphe nuclei, namely Vglut3. Vglut3 is much more anatomically restricted to the DR and MR (but has also been shown to partially overlap with serotonergic expression). In contrast, Vglut2 is very broadly expressed throughout the brain and in regions adjacent to DR and MR. For this reason, and from the data in the main manuscript as well as raw microscopy images provided in the accompanying website, it is unclear how specific the starter neuron targeting really is. The authors should show more detailed starter neuron analysis for both the broadly expressed Vglut2 and Gad2 in the DR and MR, showing the histology of the helper virus BFP and RV-ΔG-EnvA-GFP, their anatomical locations, and some quantification of proportion of starter cells within DR/MR (Fig 1B-C shows it only for Vglut2, but in insufficient detail). Furthermore, a rationale for using Vglut2 instead of Vglut3 would be appreciated, especially given that the vast majority of functional studies of the DR have used Vglut3.
The authors also miss the chance to characterize the topography of Vglut2 and Gad2 starter cell expression within the DR and MR and emphasize the interesting differences between these two populations, which may be relevant to the differences in input and output connectivity.
We added more information of starter cells in Figure1—figure supplement 2. And we performed in situ hybridization and immumohistochemical staining to characterize the specificity of the labeled Vglut2+ starter cells. The labeled starter cells were Vglut2 positive, while a fraction of them was simultaneously Vglut3 positive (Figure 1B, C; Figure1—figure supplement 3,4).
As glutamatergic neurons in the DR and MR are mainly comprised of Vglut2+ neurons and Vglut3+ neurons, but numerous Vglut3+ neurons are also serotonergic (Huang et al. 2019. eLife, 8: e46464; Pinto et al. 2019. Nature Communications 10, 4633–4633; Sos et al. 2017. Brain Structure and Function, 222: 287–299.). The anatomical connections of serotonergic neurons in the DR and MR have been well studied (Pollak Dorocic et al. Neuron. 83: 663–678; Ren, et al.2019. eLife 8: e49424; Weissbourd et al. Neuron. 83: 645–662). DR and MR Vglut2+ neurons are relatively independent from Vglut3+ neurons. And they have been revealed to regulate multitudinous functions, such as emotional behaviors (Szőnyi et al.2019. Science 366: eaay8746), but their whole-brain connectivity remains incomplete. Thus, we choose to study the inputs and outputs of Vglut2+ neurons.
And there are differences between the distribution of Vglut2+ and Gad2+ neurons in the DR/MR (Figure 1—figure supplement 1), and these differences might be relevant to the differences in input and output connectivity, which are worth illustrating in our future studies.
- The quantification throughout the manuscript refers to the relative proportion of inputs or outputs for each cell population and nucleus. The manuscript would be strengthened by also including total cell counts for starter cells in each group, as well as total numbers of input neurons. For example, is the Vglut2 population in DR much larger than the Gad2 population, and do DR Vglut2 neurons receive more inputs in total than DR Gad2 neurons? Including raw numbers would provide concrete information to contextualize connectivity patters between cell types and nuclei to the readers.
We added the number of input neurons in Supplementary File 2. As we discussed in lines 413-415, the monosynaptic rabies tracing technique might only label a portion of inputs, and the labeling could be biased toward specific neuron types and affected by many factors. Further, the ratio of the number of input neurons to starter cells variate in a vast range (Callaway and Luo. 2015. The Journal of Neuroscience, 35: 8979–8985). Thus, the larger population of specific neuron types might not indicate that they receive more inputs.
-
Evaluation Summary:
This work from Xu et al. uses state of the art viral tracing technologies in Cre-transgenic mouse lines to map the inputs and outputs of glutamatergic and GABAergic neuronal populations in the dorsal (DR) and median raphe (MR) nucleus. A large amount of high-quality anatomical dataset was collected with the advanced fMOST whole-brain imaging system. Data analysis was thorough with significant scientific insights. All figures are of high quality. Overall, this study nicely complements previously published work on whole-brain connectivity of the DR and MR which have chiefly focused on the main neuromodulatory neurons found in these nuclei, i.e. serotonin and dopamine neurons, and will be a valuable contribution to understanding neural circuits of the raphe system.
(This preprint has been reviewed by eLife. We include …
Evaluation Summary:
This work from Xu et al. uses state of the art viral tracing technologies in Cre-transgenic mouse lines to map the inputs and outputs of glutamatergic and GABAergic neuronal populations in the dorsal (DR) and median raphe (MR) nucleus. A large amount of high-quality anatomical dataset was collected with the advanced fMOST whole-brain imaging system. Data analysis was thorough with significant scientific insights. All figures are of high quality. Overall, this study nicely complements previously published work on whole-brain connectivity of the DR and MR which have chiefly focused on the main neuromodulatory neurons found in these nuclei, i.e. serotonin and dopamine neurons, and will be a valuable contribution to understanding neural circuits of the raphe system.
(This preprint has been reviewed by eLife. We include the public reviews from the reviewers here; the authors also receive private feedback with suggested changes to the manuscript. Reviewer #1 agreed to share their name with the authors.)
-
Reviewer #1 (Public Review):
General overview and merit of academic rigor:
Xu et. al put forth an innovative experimental pipeline to examine the connections of the raphe nuclei. This manuscript details elegantly designed viral tract-tracing methods coupled with fMOST intact imaging and sophisticated analyses. All figures are of good quality. The studies presented in the current manuscript will be a valuable contribution to the field, therefore an enthusiastic recommendation for publication is endorsed presently. However, there is a cluster of revisions and clarifications warranted before publication.
Major concerns:
1. The manuscript's English needs to be proofread extensively for readability and clarity.
2. The term MR (median raphe) is used in the atlas of Paxinos and Franklin. But, the entire study follows the Allen Reference Atlas …
Reviewer #1 (Public Review):
General overview and merit of academic rigor:
Xu et. al put forth an innovative experimental pipeline to examine the connections of the raphe nuclei. This manuscript details elegantly designed viral tract-tracing methods coupled with fMOST intact imaging and sophisticated analyses. All figures are of good quality. The studies presented in the current manuscript will be a valuable contribution to the field, therefore an enthusiastic recommendation for publication is endorsed presently. However, there is a cluster of revisions and clarifications warranted before publication.
Major concerns:
1. The manuscript's English needs to be proofread extensively for readability and clarity.
2. The term MR (median raphe) is used in the atlas of Paxinos and Franklin. But, the entire study follows the Allen Reference Atlas nomenclature, in which the same raphe nucleus is called the "Superior center nucleus" (CS). To keep consistency, I suggest using "CS" instead of "MR". Alternatively, in the Introduction, please make a clear statement that the MR is equivalent to CS in the Allen Reference Atlas.
3. In the Introduction, it is unclear the rationale behind the decision to selectively study the DR and MR here (why other raphe nuclei are not included?).
4. In the Results, I did not find any figure panel or images to show the anatomical location of the MR. Figure 1 shows only one injection site in DR. It is necessary to also show at least one representative injection site in the MR.
5. This study is designed to map the input/output of two major populations of neurons (Glu+ and GABAergic) in the DR and MR using two cre-driver lines (Vglut2-cre and Gad2-cre). Please clarify how these two cre lines were characterized and whether those cre expressions are consistent with endogenous gene expressions. What are their distribution patterns in the DR and MR? Are they intermingled or relatively segregated? How are their distributions in comparison with that of serotonergic neurons?
6. Overall Discussion is not well organized. I suggest to start with a clear statement about the novel discoveries of this study in comparison with existing literature, and then compare the overall input/output patterns of Glu+ and GABAergic populations in the DR and MR. The current discussion focuses on a few major targets (i.e., CEA, LH), but missed a big picture. Additionally, it is necessary and important to carefully compare their connectivity patterns with that of serotonergic neurons in these two raphe nuclei.
Minor concerns:
1. The Impact statement reads, "We reconstructed the input-output circuits of glutamatergic and GABAergic neurons in the dorsal raphe nucleus and median raphe nucleus and proposed a more refined model of the habenula-raphe circuit." When a comparison like this is put down, a specific reference to what your method is more refined than is required. This is well explained in lines 242 and 243, "Based on the conventional model of the habenula-raphe circuit (Hikosaka, 2010; Hu et al., 2020), we proposed a more refined model of the habenula-raphe circuit (Figure 5C)." Make a similar claim earlier in the Impact statement.
2. For Figure 2A, it would be easier on the reader if inputs for each region (DR and MR) and each plane of the section were placed on the same image akin to the inputs presented on coronal maps in Figures 2B and 5A and the inputs/outputs for each region (MR and DR) in the sagittal summary diagrams in Figure 7.
3. It is unclear what the nonsignificant grey open circles represent in Figures 3A-D; 4D and E.
4. In Figure 4A, the imaging portion would be clearer if it read "optical sectioning."
5. In Figure 7A and B, the position of ACA on the flatmap looks odd to me (it is a little bit too caudal).
-
Reviewer #2 (Public Review):
This work from Xu et. al. "Whole-brain connectivity atlas of glutamatergic and GABAergic neurons in mouse dorsal and median raphe nucleus" provided a comprehensive brain-wide analysis for input and output patterns to/from specific DR/MR neuronal populations in adult mouse brain. With exceptional strength in experimental approaches for high quality whole brain imaging that this group is famous for, their data and analysis are thorough and convincing for the general conclusion of the manuscript for describing both convergent and divergent patterns of DR/MR connectivity. While the current study is based on structural but not functional correlation analysis, the results are validated with prior knowledge of the field. It will provide a more complete picture to facilitate future investigation of DR/MR …
Reviewer #2 (Public Review):
This work from Xu et. al. "Whole-brain connectivity atlas of glutamatergic and GABAergic neurons in mouse dorsal and median raphe nucleus" provided a comprehensive brain-wide analysis for input and output patterns to/from specific DR/MR neuronal populations in adult mouse brain. With exceptional strength in experimental approaches for high quality whole brain imaging that this group is famous for, their data and analysis are thorough and convincing for the general conclusion of the manuscript for describing both convergent and divergent patterns of DR/MR connectivity. While the current study is based on structural but not functional correlation analysis, the results are validated with prior knowledge of the field. It will provide a more complete picture to facilitate future investigation of DR/MR connectivity and physiological functions.
The work would provide a significant and useful knowledge for the field, while also promoting the generation and application of advanced brain-wide profiling resource to advance board neuroscience research topics. However, there are still a few technical and analytical concerns that need to be addressed or discussed to refine the conclusions.
Major concerns:
1. For targeted injection-based analysis, it is critical to carefully analyze and discuss on-target vs off-target rates of labeled cells in DR/MR to validate the datasets. Whole mount data would best fit for such accurate analysis not possible before.
2. It is also important to know what percentage of the cells get labeled over individual samples, and how many samples and in total what coverage/saturation over the entire anatomical structure has been achieved to justify a complete/comprehensive analysis.
3. Further on last point, the labeling rates need to be small enough to warrant a more meaningful analysis in Figure 6. From another aspect, is there any anatomical correlation of the target sites in DR/MR for the distinct input/output clusters? This can probably be best addressed with single neuron resolution analysis that this group is good at. For the current study it is a vital part to include this detailed information for better resource to the field (e.g. to guide or map to future spatial transcriptomic analysis to study molecular-cellular correlations).
-
Reviewer #3 (Public Review):
Xu et al utilize retrograde and anterograde viral tracing in Cre-transgenic mouse lines to map the inputs and outputs of glutamatergic and GABAergic neuronal populations in the dorsal (DR) and median raphe (MR) nucleus. The experiments generate a large anatomical dataset which the authors analyse with correlation analysis, revealing subtle differences in connectivity patterns between the targeted cell types and nuclei. The study furthermore focuses on the lateral habenula (LH) to raphe nucleus circuit, identifying large amounts of inputs from the LH to both glutamatergic and GABAergic DR and MR populations, but scarce projections from these cells back to the LH, with some cell-type specific differences. In particular, MR glutamatergic neurons send the strongest projections to LH among the targeted …
Reviewer #3 (Public Review):
Xu et al utilize retrograde and anterograde viral tracing in Cre-transgenic mouse lines to map the inputs and outputs of glutamatergic and GABAergic neuronal populations in the dorsal (DR) and median raphe (MR) nucleus. The experiments generate a large anatomical dataset which the authors analyse with correlation analysis, revealing subtle differences in connectivity patterns between the targeted cell types and nuclei. The study furthermore focuses on the lateral habenula (LH) to raphe nucleus circuit, identifying large amounts of inputs from the LH to both glutamatergic and GABAergic DR and MR populations, but scarce projections from these cells back to the LH, with some cell-type specific differences. In particular, MR glutamatergic neurons send the strongest projections to LH among the targeted populations, supporting previous studies which identified this pathway as playing a role in aversive behaviors.
Overall, this study nicely complements previously published work on whole-brain connectivity of the DR and MR which have chiefly focused on the main neuromodulatory neurons found in these nuclei, ie. serotonin and dopamine neurons. Some of the experiments in the study are not completely novel, such as input tracing to GAD2-expressing neurons in DR (Weissbourd et al, 2014). However, comprehensive side-by-side comparison analysis between glutamatergic and GABAergic connectivity of both DR and MR nuclei has not been performed before, and will provide a welcome resource to circuit neuroscientist looking to elucidate functional circuits of the raphe nuclei. A further strength of the study is the high-resolution 3D imaging, revealing three distinct projection pathways from MR glutamatergic neurons to LH.
Two main concerns regarding the study are:
- The authors do not sufficiently justify the use of Vglut2 as a marker for glutamatergic neurons in DR and MR. The majority of previous studies, especially of the DR, use another glutamatergic marker which is more specifically expressed in the raphe nuclei, namely Vglut3. Vglut3 is much more anatomically restricted to the DR and MR (but has also been shown to partially overlap with serotonergic expression). In contrast, Vglut2 is very broadly expressed throughout the brain and in regions adjacent to DR and MR. For this reason, and from the data in the main manuscript as well as raw microscopy images provided in the accompanying website, it is unclear how specific the starter neuron targeting really is. The authors should show more detailed starter neuron analysis for both the broadly expressed Vglut2 and Gad2 in the DR and MR, showing the histology of the helper virus BFP and RV-ΔG-EnvA-GFP, their anatomical locations, and some quantification of proportion of starter cells within DR/MR (Fig 1B-C shows it only for Vglut2, but in insufficient detail). Furthermore, a rationale for using Vglut2 instead of Vglut3 would be appreciated, especially given that the vast majority of functional studies of the DR have used Vglut3.
The authors also miss the chance to characterize the topography of Vglut2 and Gad2 starter cell expression within the DR and MR and emphasize the interesting differences between these two populations, which may be relevant to the differences in input and output connectivity.
- The quantification throughout the manuscript refers to the relative proportion of inputs or outputs for each cell population and nucleus. The manuscript would be strengthened by also including total cell counts for starter cells in each group, as well as total numbers of input neurons. For example, is the Vglut2 population in DR much larger than the Gad2 population, and do DR Vglut2 neurons receive more inputs in total than DR Gad2 neurons? Including raw numbers would provide concrete information to contextualize connectivity patters between cell types and nuclei to the readers.
-
