Identification of autosomal cis expression quantitative trait methylation (cis eQTMs) in children’s blood
Curation statements for this article:-
Curated by eLife

Evaluation Summary:
This manuscript reports for the first time associations between DNA methylation and gene expression in blood samples from 832 children. These associations are important for understanding the regulation of genes in the genome. The importance of this study is underlined by two surprising results: a minority of these associations are also observed in adult blood samples, and only half of the associations were with the nearest gene. These findings are critical for understanding the biological effects of DNA methylation changes caused by exposures and phenotypes.
(This preprint has been reviewed by eLife. We include the public reviews from the reviewers here; the authors also receive private feedback with suggested changes to the manuscript. Reviewer #3 agreed to share their name with the authors.)
This article has been Reviewed by the following groups
Discuss this preprint
Start a discussion What are Sciety discussions?Listed in
- Evaluated articles (eLife)
Abstract
The identification of expression quantitative trait methylation (eQTMs), defined as associations between DNA methylation levels and gene expression, might help the biological interpretation of epigenome-wide association studies (EWAS). We aimed to identify autosomal cis eQTMs in children’s blood, using data from 832 children of the Human Early Life Exposome (HELIX) project.
Methods:
Blood DNA methylation and gene expression were measured with the Illumina 450K and the Affymetrix HTA v2 arrays, respectively. The relationship between methylation levels and expression of nearby genes (1 Mb window centered at the transcription start site, TSS) was assessed by fitting 13.6 M linear regressions adjusting for sex, age, cohort, and blood cell composition.
Results:
We identified 39,749 blood autosomal cis eQTMs, representing 21,966 unique CpGs (eCpGs, 5.7% of total CpGs) and 8,886 unique transcript clusters (eGenes, 15.3% of total transcript clusters, equivalent to genes). In 87.9% of these cis eQTMs, the eCpG was located at <250 kb from eGene’s TSS; and 58.8% of all eQTMs showed an inverse relationship between the methylation and expression levels. Only around half of the autosomal cis-eQTMs eGenes could be captured through annotation of the eCpG to the closest gene. eCpGs had less measurement error and were enriched for active blood regulatory regions and for CpGs reported to be associated with environmental exposures or phenotypic traits. In 40.4% of the eQTMs, the CpG and the eGene were both associated with at least one genetic variant. The overlap of autosomal cis eQTMs in children’s blood with those described in adults was small (13.8%), and age-shared cis eQTMs tended to be proximal to the TSS and enriched for genetic variants.
Conclusions:
This catalogue of autosomal cis eQTMs in children’s blood can help the biological interpretation of EWAS findings and is publicly available at https://helixomics.isglobal.org/ and at Dryad (doi: 10.5061/dryad.fxpnvx0t0 ).
Funding:
The study has received funding from the European Community’s Seventh Framework Programme (FP7/2007-206) under grant agreement no 308333 (HELIX project); the H2020-EU.3.1.2. - Preventing Disease Programme under grant agreement no 874583 (ATHLETE project); from the European Union’s Horizon 2020 research and innovation programme under grant agreement no 733206 (LIFECYCLE project), and from the European Joint Programming Initiative “A Healthy Diet for a Healthy Life” (JPI HDHL and Instituto de Salud Carlos III) under the grant agreement no AC18/00006 (NutriPROGRAM project). The genotyping was supported by the projects PI17/01225 and PI17/01935, funded by the Instituto de Salud Carlos III and co-funded by European Union (ERDF, “A way to make Europe”) and the Centro Nacional de Genotipado-CEGEN (PRB2-ISCIII). BiB received core infrastructure funding from the Wellcome Trust (WT101597MA) and a joint grant from the UK Medical Research Council (MRC) and Economic and Social Science Research Council (ESRC) (MR/N024397/1). INMA data collections were supported by grants from the Instituto de Salud Carlos III, CIBERESP, and the Generalitat de Catalunya-CIRIT. KANC was funded by the grant of the Lithuanian Agency for Science Innovation and Technology (6-04-2014_31V-66). The Norwegian Mother, Father and Child Cohort Study is supported by the Norwegian Ministry of Health and Care Services and the Ministry of Education and Research. The Rhea project was financially supported by European projects (EU FP6-2003-Food-3-NewGeneris, EU FP6. STREP Hiwate, EU FP7 ENV.2007.1.2.2.2. Project No 211250 Escape, EU FP7-2008-ENV-1.2.1.4 Envirogenomarkers, EU FP7-HEALTH-2009- single stage CHICOS, EU FP7 ENV.2008.1.2.1.6. Proposal No 226285 ENRIECO, EU- FP7- HEALTH-2012 Proposal No 308333 HELIX), and the Greek Ministry of Health (Program of Prevention of obesity and neurodevelopmental disorders in preschool children, in Heraklion district, Crete, Greece: 2011-2014; “Rhea Plus”: Primary Prevention Program of Environmental Risk Factors for Reproductive Health, and Child Health: 2012-15). We acknowledge support from the Spanish Ministry of Science and Innovation through the “Centro de Excelencia Severo Ochoa 2019-2023” Program (CEX2018-000806-S), and support from the Generalitat de Catalunya through the CERCA Program. MV-U and CR-A were supported by a FI fellowship from the Catalan Government (FI-DGR 2015 and #016FI_B 00272). MC received funding from Instituto Carlos III (Ministry of Economy and Competitiveness) (CD12/00563 and MS16/00128).
Article activity feed
-

-

Author Response
Reviewer #1 (Public Review):
In this manuscript, the authors find CpGs within 500Kb of a gene that associate with transcript abundance (cis-eQTMs) in children from the HELIX study. There is much to admire about this work. With two notable exceptions, their work is solid and builds/improves on the work that came before it. Their catalogue of eQTMs could be useful to many other researchers that utilize methylation data from whole blood samples in children. Their annotation of eQTMs is well thought out and exhaustive. As this portion of the work is descriptive, most of their methods are appropriate.
Unfortunately, their use of results from a model that does not account for cell-type proportions across samples diminishes the utility and impact of their findings. I believe that their catalog of eQTMs contains a great …
Author Response
Reviewer #1 (Public Review):
In this manuscript, the authors find CpGs within 500Kb of a gene that associate with transcript abundance (cis-eQTMs) in children from the HELIX study. There is much to admire about this work. With two notable exceptions, their work is solid and builds/improves on the work that came before it. Their catalogue of eQTMs could be useful to many other researchers that utilize methylation data from whole blood samples in children. Their annotation of eQTMs is well thought out and exhaustive. As this portion of the work is descriptive, most of their methods are appropriate.
Unfortunately, their use of results from a model that does not account for cell-type proportions across samples diminishes the utility and impact of their findings. I believe that their catalog of eQTMs contains a great deal of spurious results that primarily represent the differences in cell-type proportions across samples.
Lastly, the authors postulate that the eQTM gene associations found uniquely in their unadjusted model (in comparison to results from a model that does account for cell type proportion) represent cell-specific associations that are lost when a fully-adjusted model is assumed. To test this hypothesis, the authors appear to repurpose methods that were not intended for the purposes used in this manuscript. The manuscript lacks adequate statistical validation to support their repurposing of the method, as well as the methodological detail needed to peer review it. This section is a distraction from an otherwise worthy manuscript. But provide evidences that enriched for cell sp CpGs.
Major points
- Line 414-475: In this section, the authors are suggesting that CpGs that are significant without adjusting for cell type are due to methylation-expression associations that are found only in one cell type, while association found in the fully adjusted model are associations that are shared across the cell types. I do not agree with this hypothesis, as I do not agree that the confounding that occurs when cell-type proportions are not accounted for would behave in this way. Although restricting their search for eQTMs to only those CpGs proximal to a gene will reduce the number of spurious associations, a great deal of the findings in the authors' unadjusted model likely reflect differences in cell-type proportions across samples alone. The Reinius manuscript, cited in this paper, indicates that geneproximal CpGs can have methylation patterns that vary across cell types.
Following reviewers’ recommendations, we have reconsidered our initial hypothesis about the role of cellular composition in the association between methylation and gene expression. Although we still think that some of the eQTMs only found in the model unadjusted for cellular composition could represent cell specific effects, we acknowledge that the majority might be confounded by the extensive gene expression and DNA methylation differences between cell types. Also, we recognize that more sophisticated statistical tests should be applied to prove our hypothesis. Because of this, we have decided to report the eQTMs of the model adjusted for cellular composition in the main manuscript and keep the results of the model unadjusted for cellular composition only in the online catalogue.
- Line 476-488: Their evidence due to F-statistics is tenuous. The authors do not give enough methodological detail to explain how they're assessing their hypothesis in the results or methods (lines 932-946) sections. The methods they give are difficult to follow. The results in figure S19A are not compelling. The citation in the methods (by Reinius) do not make sense, because Reinius et al did not use F-statistics as a proxy for cell type specificity. The citation that the authors give for this method in the results does not appear to be appropriate for this analysis, either. Jaffe and Irizarry state that a CpG with a high Fstatistic indicates that the methylation at that CpG varies across cell type. They suggest removing these CpGs from significant results, or estimating and correcting for cell type proportions, as their presence would be evidence of statistical confounding. The authors of this manuscript indicate that they find higher F-statistics among the eQTMs uniquely found in the unadjusted model, which seems to only strengthen the idea that the unadjusted model is suffering from statistical confounding.
We recognize the miss-interpretation of the F-statistic in relation to cellular composition. We have deleted all this part from the updated version of the manuscript.
- The methods used to generate adjusted p-values in this manuscript are not appropriate as they are written. Further, they are nothing like the methods used in the paper cited by the authors. The Bonder paper used permutations to estimate an empirical FDR and cites a publication by Westra et al for their method (below). The Westra paper is a better one to cite, because the methods are more clear. Neither the Bonder nor the Westra paper uses the BH procedure for FDR.
Westra, H.-J. et al. Systematic identification of trans eQTLs as putative drivers of known disease associations. Nat. Genet. 45, 1238-1243 (2013).
We apologize for this misleading citation. Although Bonder et al applied a permutation approach to adjust for multiple testing, our approach was inspired by the method applied in the GTEx project (GTEx consortium, 2020), using CpGs instead of SNPs. The citation has been corrected in the manuscript. Moreover, we have explained in more detail the whole multiple-testing processes in the Material and Methods section (page 14, line 316):
“To ensure that CpGs paired to a higher number of Genes do not have higher chances of being part of an eQTM, multiple-testing was controlled at the CpG level, following a procedure previously applied in the Genotype-Tissue Expression (GTEx) project (Gamazon et al., 2018). Briefly, our statistic used to test the hypothesis that a pair CpGGene is significantly associated is based on considering the lowest p-value observed for a given CpG and all its pairs Gene (e.g. those in the 1 Mb window centered at the TSS). As we do not know the distribution of this statistic under the null, we used a permutation test. We generated 100 permuted gene expression datasets and ran our previous linear regression models obtaining 100 permuted p-values for each CpG-Gene pair. Then, for each CpG, we selected among all CpG-Gene pairs the minimum p-value in each permutation and fitted a beta distribution that is the distribution we obtain when dealing with extreme values (e.g. minimum) (Dudbridge and Gusnanto, 2008). Next, for each CpG, we took the minimum p-value observed in the real data and used the beta distribution to compute the probability of observing a lower p-value. We defined this probability as the empirical p-value of the CpG. Then, we considered as significant those CpGs with empirical p-values to be significant at 5% false discovery rate using BenjaminiHochberg method. Finally, we applied a last step to identify all significant CpG-Gene pairs for all eCpGs. To do so, we defined a genome-wide empirical p-value threshold as the empirical p-value of the eCpG closest to the 5% false discovery rate threshold. We used this empirical p-value to calculate a nominal p-value threshold for each eCpG, based on the beta distribution obtained from the minimum permuted p-values. This nominal p-value threshold was defined as the value for which the inverse cumulative distribution of the beta distribution was equal to the empirical p-value. Then, for each eCpG, we considered as significant all eCpG-Gene variants with a p-value smaller than nominal p-value.”
References:
GTEx consortium, The GTEx Consortium atlas of genetic regulatory effects across human tissues, Science (2020) Sep 11;369(6509):1318-1330. doi: 10.1126/science.aaz1776.Reviewer #2 (Public Review):
Strength:
Comprehensive analysis Considering genetic factors such as meQTL and comparing results with adult data are interesting.
We thank the reviewer for his/her positive feedback on the manuscript. We agree that the analysis of genetic data and the comparison with eQTMs described in adults are two important points of the study.
Weakness:
- Manuscript is not summarized well. Please send less important findings to supplementary materials. The manuscript is not well written, which includes every little detail in the text, resulting in 86 pages of the manuscript.
Following reviewers’ comments, we have simplified the manuscript. Now only the eQTMs identified in the model adjusted for cellular composition are reported. In addition, functional enrichment analyses have been simplified without reporting all odds ratios (OR) and p-values, which can be seen in the Figures.
- Any possible reason that the eQTM methylation probes are enriched in weak transcription regions? This is surprising.
Bonder et al also found that blood eQTMs were slightly enriched for weak transcription regions (TxWk). Weak transcription regions are highly constitutive and found across many different cell types (Roadmap Epigenetics Consortium, 2015). However, hematopoietic stem cells and immune cells have lower representation of TxWk and other active states, which may be related to their capacity to generate sub-lineages and enter quiescence.
Given that we analyzed whole blood and that ROADMAP chromatin states are only available for blood specific cell types, each CpG in the array was annotated to one or several chromatin states by taking a state as present in that locus if it was described in at least 1 of the 27 bloodrelated cell types. By applying this strategy we may be “over-representing” TxWk chromatin states, in the case TxWk are cell-type specific. As a result, even if each blood cell type might have few TxWk, many positions can be TxWk in at least one cell type, inflating the CpGs considered as TxWk. This might have affected some of the enrichments.
On the other hand, CpG probe reliability depends on methylation levels and variance. TxWk regions show high methylation levels, which tend to be measured with more error. This also might have impacted the results, however the analysis considering only reliable probes (ICC >0.4) showed similar enrichment for TxWk.
Besides these, we do not have a clear answer for the question raised by the reviewer.
References:
Bonder MJ, Luijk R, Zhernakova D V, Moed M, Deelen P, Vermaat M, et al. Disease variants alter transcription factor levels and methylation of their binding sites. Nat Genet [Internet]. 2017 [cited 2017 Nov 2];49:131–8. Available from: http://www.ncbi.nlm.nih.gov/pubmed/27918535
Roadmap Epigenomics Consortium, Kundaje A, Meuleman W, Ernst J, Bilenky M, Yen A, Heravi-Moussavi A, Kheradpour P, Zhang Z, Wang J, Ziller MJ, Amin V, Whitaker JW, Schultz MD, Ward LD, Sarkar A, Quon G, Sandstrom RS, Eaton ML, Wu YC, Pfenning AR, Wang X, Claussnitzer M, Liu Y, Coarfa C, Harris RA, Shoresh N, Epstein CB, Gjoneska E, Leung D, Xie W, Hawkins RD, Lister R, Hong C, Gascard P, Mungall AJ, Moore R, Chuah E, Tam A, Canfield TK, Hansen RS, Kaul R, Sabo PJ, Bansal MS, Carles A, Dixon JR, Farh KH, Feizi S, Karlic R, Kim AR, Kulkarni A, Li D, Lowdon R, Elliott G, Mercer TR, Neph SJ, Onuchic V, Polak P, Rajagopal N, Ray P, Sallari RC, Siebenthall KT, Sinnott-Armstrong NA, Stevens M, Thurman RE, Wu J, Zhang B, Zhou X, Beaudet AE, Boyer LA, De Jager PL, Farnham PJ, Fisher SJ, Haussler D, Jones SJ, Li W, Marra MA, McManus MT, Sunyaev S, Thomson JA, Tlsty TD, Tsai LH, Wang W, Waterland RA, Zhang MQ, Chadwick LH, Bernstein BE, Costello JF, Ecker JR, Hirst M, Meissner A, Milosavljevic A, Ren B, Stamatoyannopoulos JA, Wang T, Kellis M. Integrative analysis of 111 reference human epigenomes. Nature. 2015 Feb 19;518(7539):317-30. doi: 10.1038/nature14248. PMID: 25693563; PMCID: PMC4530010.
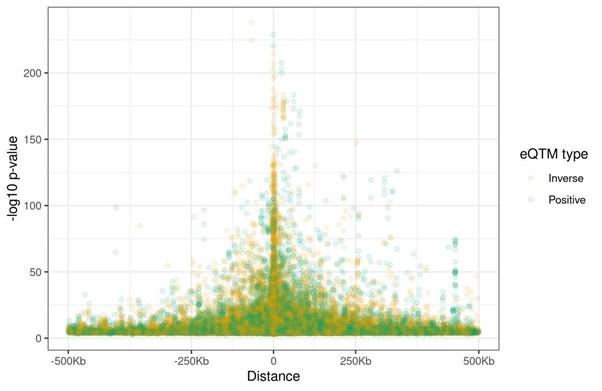
- The result that the magnitude of the effect was independent of the distance between the CpG and the TC TSS is surprising. Could you draw a figure where x-axis is the distance between the CpG site and TC TSS and y-axis is p-value?
As suggested by the reviewer, we have taken a more detailed look at the relationship between the effect size and the distance between the CpG and the TC’s TSS. First, we confirmed that the relative orientation (upstream or downstream) did not affect the strength of the association (p-value=0.68). Second, we applied a linear regression between the absolute log2 fold change and the log10 of the distance (in absolute value), finding that they were inversely related. We have updated the manuscript with this information (page 22, line 504):
“We observed an inverse linear association between the eCpG-eGene’s TSS distance and the effect size (p-value = 7.75e-9, Figure 2B); while we did not observe significant differences in effect size due to the relative orientation of the eCpG (upstream or downstream) with respect to the eGene’s TSS (p-value = 0.68).”
Results are shown in Figure 2B. Of note, we winsorized effect size values in order to improve the visualization. The winsorizing process is also explained in Figure 2 legend. Moreover, we have done the plot suggested by the reviewer (see below). It shows that associations with smallest p-values are found close to the TC’s TSS. Nonetheless, as this pattern is also observed for the effect sizes, we have decided to not include it in the manuscript.
- Concerned about too many significant eQTMs. Almost half of genes are associated with methylation. I wonder if false positives are well controlled using the empirical p-values. Using empirical p-value with permutation may mislead since especially you only use 100 permutations. I wonder the result would be similar if they compare their result with the traditional way, either adjusting p-values using p-values from entire TCs or adjusting pvalues using a gene-based method as commonly used in GWAS. Compare your previous result with my suggestion for the first analysis.
Despite the number of genes (TCs) whose expression is associated with DNA methylation is quite high, we do not think this is due to not correctly controlling false positives. Our approach is based on the method used by GTEx (GTEx consortium) and implemented in the FastQTL package (Ongen et al. 2016), to control for positives in the eQTLs discovery. As in GTEx, we run 100 permutations to estimate the parameters of a beta distribution, which we used to model the distribution of p-values for each CpG. Then, to correct for the number of TCs among significant CpGs, we applied False Discovery Rate (FDR) at a threshold < 0.05. Finally, we defined the final set of significant eQTMs using the beta distribution defined in a previous step.
For illustration, we compared the number of eQTMs with our approach to what we would obtain by uniquely applying the FDR method (adjusted p-value <0.05), getting fewer associations with our approach: eQTMs (45,203 with FDR vs 39,749 with our approach), eCpGs (24,611 vs 21,966) and eGenes (9,937 vs 8,886). Among the 8,886 significant eGenes, 6,288 of them are annotated to coding genes, thus representing 27% of the 23,054 eGenes coding for a gene included in the array.
References:
GTEx consortium, The GTEx Consortium atlas of genetic regulatory effects across human tissues, Science (2020) Sep 11;369(6509):1318-1330. doi: 10.1126/science.aaz1776.
Ongen et al. Fast and efficient QTL mapper for thousands of molecular phenotypes, Bioinformatics (2016) May 15;32(10):1479-85. doi: 10.1093/bioinformatics/btv722. Epub 2015 Dec 26.
- I recommend starting with cell type specific results. Without adjusting cell type, the result doesn't make sense.
As suggested by other reviewers, we have withdrawn the model unadjusted for cellular composition.
Reviewer #3 (Public Review):
Although several DNA methylation-gene expression studies have been carried out in adults, this is the first in children. The importance of this is underlined by the finding that surprisingly few associations are observed in both adults and children. This is a timely study and certain to be important for the interpretation of future omic studies in blood samples obtained from children.
We agree with the reviewer that eQTMs in children are important for interpreting EWAS findings conducted in child cohorts such as those of the Pregnancy And Childhood Epigenetics (PACE) consortium.
It is unfortunate that the authors chose to base their reporting on associations unadjusted for cell count heterogeneity. They incorrectly claim that associations linked to cell count variation are likely to be cell-type-specific. While possible, it is probably more likely that the association exists entirely due to cell type differences (which tend to be large) with little or no association within any of the cell types (which tend to be much smaller). In the interests of interpretability, it would be better to report only associations obtained after adjusting for cell count variation.
Following reviewers’ recommendations, we have reconsidered our initial hypothesis about the role of cellular composition in the association between methylation and gene expression. Although we still think that some of the eQTMs only found in the model unadjusted for cellular composition could represent cell specific effects, we acknowledge that the majority might be confounded by the extensive gene expression and DNA methylation differences between cell types. Also, we recognize that more sophisticated statistical tests should be applied to prove our hypothesis. Because of this we have decided to report the eQTMs of the model adjusted for cellular composition in the main manuscript and keep the results of the model unadjusted for cellular composition only in the online catalogue.
Several enrichments could be related to variation in probe quality across the DNA methylation arrays.
For example, enrichment for eQTM CpG sites among those that change with age could simply be due to the fact age and eQTM effects are more likely to be observed for CpG sites with high quality probes than low quality probes. It is more informative to instead ask if eQTM CpG sites are more likely to have increasing rather than decreasing methylation with age. This avoids the probe quality bias since probes with positive associations with age would be expected to have roughly the same quality as those with negative associations with age. There are several other analyses prone to the probe quality bias.
See answer to question 2, below.
-
Evaluation Summary:
This manuscript reports for the first time associations between DNA methylation and gene expression in blood samples from 832 children. These associations are important for understanding the regulation of genes in the genome. The importance of this study is underlined by two surprising results: a minority of these associations are also observed in adult blood samples, and only half of the associations were with the nearest gene. These findings are critical for understanding the biological effects of DNA methylation changes caused by exposures and phenotypes.
(This preprint has been reviewed by eLife. We include the public reviews from the reviewers here; the authors also receive private feedback with suggested changes to the manuscript. Reviewer #3 agreed to share their name with the authors.)
-
Reviewer #1 (Public Review):
In this manuscript, the authors find CpGs within 500Kb of a gene that associate with transcript abundance (cis-eQTMs) in children from the HELIX study. There is much to admire about this work. With two notable exceptions, their work is solid and builds/improves on the work that came before it. Their catalogue of eQTMs could be useful to many other researchers that utilize methylation data from whole blood samples in children. Their annotation of eQTMs is well thought out and exhaustive. As this portion of the work is descriptive, most of their methods are appropriate.
Unfortunately, their use of results from a model that does not account for cell-type proportions across samples diminishes the utility and impact of their findings. I believe that their catalog of eQTMs contains a great deal of spurious results …
Reviewer #1 (Public Review):
In this manuscript, the authors find CpGs within 500Kb of a gene that associate with transcript abundance (cis-eQTMs) in children from the HELIX study. There is much to admire about this work. With two notable exceptions, their work is solid and builds/improves on the work that came before it. Their catalogue of eQTMs could be useful to many other researchers that utilize methylation data from whole blood samples in children. Their annotation of eQTMs is well thought out and exhaustive. As this portion of the work is descriptive, most of their methods are appropriate.
Unfortunately, their use of results from a model that does not account for cell-type proportions across samples diminishes the utility and impact of their findings. I believe that their catalog of eQTMs contains a great deal of spurious results that primarily represent the differences in cell-type proportions across samples.
Lastly, the authors postulate that the eQTM gene associations found uniquely in their unadjusted model (in comparison to results from a model that does account for cell type proportion) represent cell-specific associations that are lost when a fully-adjusted model is assumed. To test this hypothesis, the authors appear to repurpose methods that were not intended for the purposes used in this manuscript. The manuscript lacks adequate statistical validation to support their repurposing of the method, as well as the methodological detail needed to peer review it. This section is a distraction from an otherwise worthy manuscript.
Major points
1. Line 414-475: In this section, the authors are suggesting that CpGs that are significant without adjusting for cell type are due to methylation-expression associations that are found only in one cell type, while association found in the fully adjusted model are associations that are shared across the cell types. I do not agree with this hypothesis, as I do not agree that the confounding that occurs when cell-type proportions are not accounted for would behave in this way. Although restricting their search for eQTMs to only those CpGs proximal to a gene will reduce the number of spurious associations, a great deal of the findings in the authors' unadjusted model likely reflect differences in cell-type proportions across samples alone. The Reinius manuscript, cited in this paper, indicates that gene-proximal CpGs can have methylation patterns that vary across cell types.2. Line 476-488: Their evidence due to F-statistics is tenuous. The authors do not give enough methodological detail to explain how they're assessing their hypothesis in the results or methods (lines 932-946) sections. The methods they give are difficult to follow. The results in figure S19A are not compelling. The citation in the methods (by Reinius) do not make sense, because Reinius et al did not use F-statistics as a proxy for cell type specificity. The citation that the authors give for this method in the results does not appear to be appropriate for this analysis, either. Jaffe and Irizarry state that a CpG with a high F-statistic indicates that the methylation at that CpG varies across cell type. They suggest removing these CpGs from significant results, or estimating and correcting for cell type proportions, as their presence would be evidence of statistical confounding. The authors of this manuscript indicate that they find higher F-statistics among the eQTMs uniquely found in the unadjusted model, which seems to only strengthen the idea that the unadjusted model is suffering from statistical confounding.
3. The methods used to generate adjusted p-values in this manuscript are not appropriate as they are written. Further, they are nothing like the methods used in the paper cited by the authors. The Bonder paper used permutations to estimate an empirical FDR and cites a publication by Westra et al for their method (below). The Westra paper is a better one to cite, because the methods are more clear. Neither the Bonder nor the Westra paper uses the BH procedure for FDR.
Westra, H.-J. et al. Systematic identification of trans eQTLs as putative drivers of known disease associations. Nat. Genet. 45, 1238-1243 (2013).
-
Reviewer #2 (Public Review):
Strengths:
Comprehensive analysis
Considering genetic factors such as meQTL and comparing results with adult data are interesting
Weaknesses:
* Manuscript is not summarized well. Please send less important findings to supplementary materials. The manuscript is not well written, which includes every little detail in the text, resulting in 86 pages of the manuscript.
* Any possible reason that the eQTM methylation probes are enriched in weak transcription regions? This is surprising.
* The result that the magnitude of the effect was independent of the distance between the CpG and the TC TSS is surprising. Could you draw a figure where x-axis is the distance between the CpG site and TC TSS and y-axis is p-value?
* Concerned about too many significant eQTMs. Almost half of genes are associated with methylation. …Reviewer #2 (Public Review):
Strengths:
Comprehensive analysis
Considering genetic factors such as meQTL and comparing results with adult data are interesting
Weaknesses:
* Manuscript is not summarized well. Please send less important findings to supplementary materials. The manuscript is not well written, which includes every little detail in the text, resulting in 86 pages of the manuscript.
* Any possible reason that the eQTM methylation probes are enriched in weak transcription regions? This is surprising.
* The result that the magnitude of the effect was independent of the distance between the CpG and the TC TSS is surprising. Could you draw a figure where x-axis is the distance between the CpG site and TC TSS and y-axis is p-value?
* Concerned about too many significant eQTMs. Almost half of genes are associated with methylation. I wonder if false positives are well controlled using the empirical p-values. Using empirical p-value with permutation may mislead since especially you only use 100 permutations. I wonder the result would be similar if they compare their result with the traditional way, either adjusting p-values using p-values from entire TCs or adjusting p-values using a gene-based method as commonly used in GWAS. Compare your previous result with my suggestion for the first analysis.
* I recommend starting with cell type specific results. Without adjusting cell type, the result doesn't make sense. -
Reviewer #3 (Public Review):
Although several DNA methylation-gene expression studies have been carried out in adults, this is the first in children. The importance of this is underlined by the finding that surprisingly few associations are observed in both adults and children. This is a timely study and certain to be important for the interpretation of future omic studies in blood samples obtained from children.
It is unfortunate that the authors chose to base their reporting on associations unadjusted for cell count heterogeneity. They incorrectly claim that associations linked to cell count variation are likely to be cell-type-specific. While possible, it is probably more likely that the association exists entirely due to cell type differences (which tend to be large) with little or no association within any of the cell types (which …
Reviewer #3 (Public Review):
Although several DNA methylation-gene expression studies have been carried out in adults, this is the first in children. The importance of this is underlined by the finding that surprisingly few associations are observed in both adults and children. This is a timely study and certain to be important for the interpretation of future omic studies in blood samples obtained from children.
It is unfortunate that the authors chose to base their reporting on associations unadjusted for cell count heterogeneity. They incorrectly claim that associations linked to cell count variation are likely to be cell-type-specific. While possible, it is probably more likely that the association exists entirely due to cell type differences (which tend to be large) with little or no association within any of the cell types (which tend to be much smaller). In the interests of interpretability, it would be better to report only associations obtained after adjusting for cell count variation.
Several enrichments could be related to variation in probe quality across the DNA methylation arrays. For example, enrichment for eQTM CpG sites among those that change with age could simply be due to the fact age and eQTM effects are more likely to be observed for CpG sites with high quality probes than low quality probes. It is more informative to instead ask if eQTM CpG sites are more likely to have increasing rather than decreasing methylation with age. This avoids the probe quality bias since probes with positive associations with age would be expected to have roughly the same quality as those with negative associations with age. There are several other analyses prone to the probe quality bias.
-
