A general decoding strategy explains the relationship between behavior and correlated variability
Curation statements for this article:-
Curated by eLife

Evaluation Summary:
This manuscript will be of interest to the community interested in how the coordinated activity of neurons influence both coding and behaviour. It successfully combines a sophisticated model of the visual system with data analysis to support a well-formulated hypothesis of the importance of general decoding. This is a potentially important contribution, that addresses a widely observed, but puzzling, relation between perceptual performance and noise correlations.
(This preprint has been reviewed by eLife. We include the public reviews from the reviewers here; the authors also receive private feedback with suggested changes to the manuscript. The reviewers remained anonymous to the authors.)
This article has been Reviewed by the following groups
Discuss this preprint
Start a discussion What are Sciety discussions?Listed in
- Evaluated articles (eLife)
Abstract
Improvements in perception are frequently accompanied by decreases in correlated variability in sensory cortex. This relationship is puzzling because overall changes in correlated variability should minimally affect optimal information coding. We hypothesize that this relationship arises because instead of using optimal strategies for decoding the specific stimuli at hand, observers prioritize generality : a single set of neuronal weights to decode any stimuli. We tested this using a combination of multineuron recordings in the visual cortex of behaving rhesus monkeys and a cortical circuit model. We found that general decoders optimized for broad rather than narrow sets of visual stimuli better matched the animals’ decoding strategy, and that their performance was more related to the magnitude of correlated variability. In conclusion, the inverse relationship between perceptual performance and correlated variability can be explained by observers using a general decoding strategy, capable of decoding neuronal responses to the variety of stimuli encountered in natural vision.
Article activity feed
-

-

Author Response:
Joint Public Review:
A highly robust result when investigating how neural population activity is impacted by performance in a task is that the trial to trial correlations (noise correlations) between neurons is reduced as performance increases. However the theoretical and experimental literature so far has failed to account for this robust link since reduced noise correlations do not systematically contribute to improved availability or transmission of information (often measured using decoding of stimulus identity). This paper sets out to address this discrepancy by proposing that the key to linking noise correlations to decoding and thus bridging the gap with performance is to rethink the decoders we use : instead of decoders optimized to the specific task imposed on the animal on any given trial (A vs B / B vs C / …
Author Response:
Joint Public Review:
A highly robust result when investigating how neural population activity is impacted by performance in a task is that the trial to trial correlations (noise correlations) between neurons is reduced as performance increases. However the theoretical and experimental literature so far has failed to account for this robust link since reduced noise correlations do not systematically contribute to improved availability or transmission of information (often measured using decoding of stimulus identity). This paper sets out to address this discrepancy by proposing that the key to linking noise correlations to decoding and thus bridging the gap with performance is to rethink the decoders we use : instead of decoders optimized to the specific task imposed on the animal on any given trial (A vs B / B vs C / A vs C), they hypothesize that we should favor a decoder optimized for a general readout of stimulus properties (A vs B vs C).
To test this hypothesis, the authors use a combination of quantitative data analysis and mechanistic network modeling. Data were recorded from neuronal populations in area V4 of two monkeys trained to perform an orientation change detection task, where the magnitude of orientation change could vary across trials, and the change could happen at cued (attended) or uncued (unattended) locations in the visual field. The model, which extends previous work by the authors, reproduces many basic features of the data, and both the model and data offer support for the hypothesis.
The reviewers agreed that this is a potentially important contribution, that addresses a widely observed, but puzzling, relation between perceptual performance and noise correlations. The clarity of the hypothesis, and the combination of data analysis and computational modelling are two essential strengths of the paper.
Overall this paper exhibits a new factor to be taken into account when analysing neural data : the choice of decoder and in particular how general or specific the decoder is. The fact that the generality of the decoder sheds light on the much debated question of noise correlations underscores its importance. The paper therefore opens multiple avenues for future research to probe this new idea, in particular for tasks with multiple stimuli dimensions.
Nonetheless, as detailed below, the reviewers believe the manuscript clarity could be further improved in several points, and some additional analysis of the data would provide more straightforward test of the hypothesis.
1. It would be important to verify that the model reproduces the correlation between noise and signal correlations since this is really a key argument leading to the author's hypothesis.
We have incorporated this verification of the model into the manuscript, as referred to below in the Results:
“Importantly, this model reproduces the correlation between noise and signal correlations (Figure 2–figure supplement 1) observed in electrophysiological data (Cohen & Maunsell, 2009; Cohen & Kohn, 2011). This correlation between the shared noise and the shared tuning is a key component of the general decoder hypothesis. We observed this strong relationship between noise and signal correlations in our recorded neurons (Figure 2–figure supplement 1A) as well as in our modeled data (Figure 2–figure supplement 1B). Using this model, we were able to measure the relationship between noise and signal correlations for varying strengths of attentional modulation. Consistent with the predictions of the general decoder hypothesis, attention weakened the relationship between noise and signal correlations (Figure 2–figure supplement 1C).”
The new figure is as below:
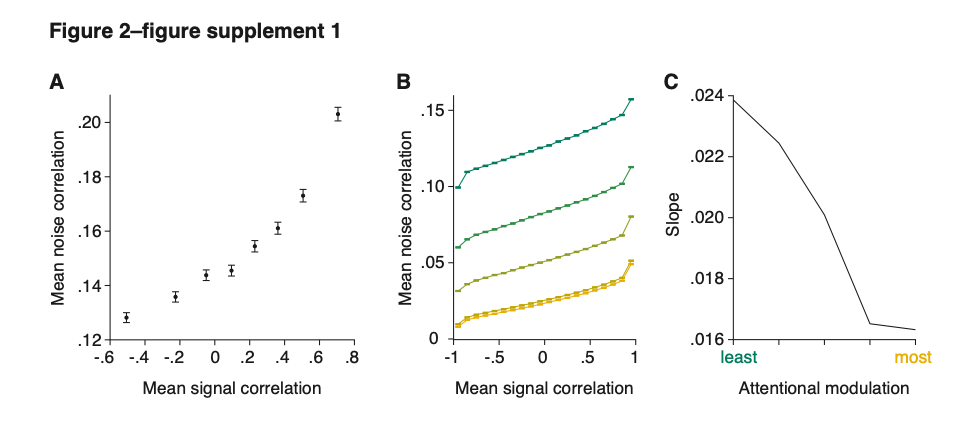
Figure 2–figure supplement 1. The model reproduces the relationship between noise and signal correlations that is key to the general decoder hypothesis. (A) As previously observed in electrophysiological data (Cohen & Maunsell, 2009; Cohen & Kohn, 2011), we observe a strong relationship between noise and signal correlations. During additional recordings collected during most recording sessions (for Monkey 1 illustrated here, n = 37 days with additional recordings), the monkey was rewarded for passively fixating the center of the monitor while Gabors with randomly interleaved orientations were flashed at the receptive field location (‘Stim 2’ location in Figure 1C). The presented orientations spanned the full range of stimulus orientations (12 equally spaced orientations from 0 to 330 degrees). We calculated the signal correlation for each pair of units based on their mean responses to each of the 12 orientations. We define the noise correlation for each pair of units as the average noise correlation for each orientation. The plot depicts signal correlation as a function of noise correlation across all recording sessions, binned into 8 equally sized sets of unit pairs. Error bars represent SEM. (B) The model reproduces the relationship between noise and signal correlations. Signal correlation is plotted as a function of noise correlation, binned into 20 equally sized sets of unit pairs (n = 2000 neurons), for each attentional modulation strength (green: least attended; yellow: most attended). The results were averaged over 50 tested orientations. (C) The slope of the relationship between noise and signal correlations (y-axis) decreases with increasing attentional modulation (x-axis). This suggests that noise is less aligned with signal correlation with increasing attentional modulation.
2. Testing the hypothesis of the general decoder:
2.1 In the data, the authors compare mainly the specific (stimulus) decoder and the monkey's choice decoder. The general stimulus decoder is only considered in fig. 3f, because data across multiple orientations are available only for the cued condition, and therefore the general and specific decoders cannot be compared for changes between cued and uncued. However, the hypothesized relation between mean correlations and performance should also be true within a fixed attention condition (cued), comparing sessions with larger vs. smaller correlation. In other words, if the hypothesis is correct, you should find that performance of the "most general" decoder (as in fig. 3f) correlates negatively with average noise correlations, across sessions, more so than the "most specific" decoder.
We have added a new supplementary figure to the manuscript: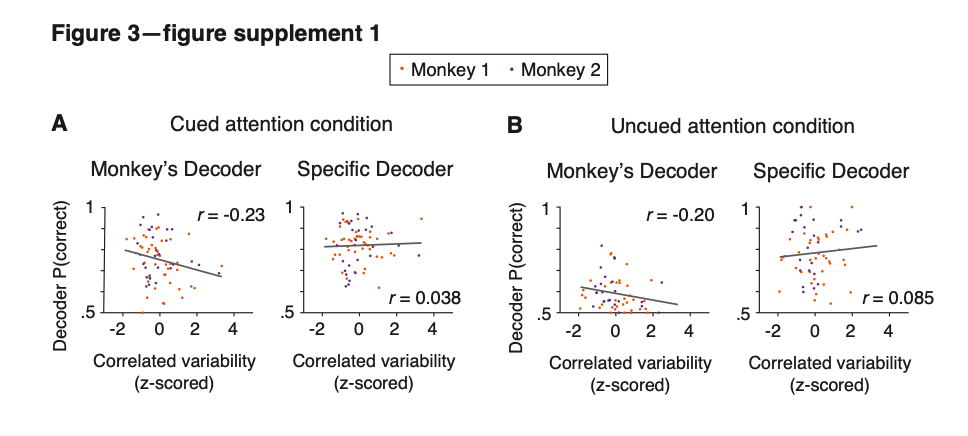
Figure 3–figure supplement 1. Based on the electrophysiological data, the performance of the monkey’s decoder was more related to mean correlated variability than the performance of the specific decoder within each attention condition. (A) Within the cued attention condition, the performance of the monkey’s decoder was more related to mean correlated variability (left plot; correlation coefficient: n = 71 days, r = -0.23, p = 0.058) than the performance of the specific decoder (right plot; correlation coefficient: r = 0.038, p = 0.75). The correlation coefficients associated with the two decoders were significantly different from each other (Williams’ procedure: t = 3.8, p = 1.5 x 10^-4). Best fit lines plotted in gray. Data from both monkeys combined (Monkey 1 data shown in orange: n = 44 days; Monkey 2 data shown in purple: n = 27 days) with mean correlated variability z-scored within monkey. (B) The data within the uncued attention condition showed a similar pattern, with the performance of the monkey’s decoder more related to mean correlated variability (n = 69 days, r = -0.20, p = 0.14) than the performance of the specific decoder (r = 0.085, p = 0.51; Williams’ procedure: t = 2.0, p = 0.049). Conventions as in (A) (Monkey 1: n = 42 days – see Methods for data exclusions as in Figure 3C; Monkey 2: n = 27 days).
2.2 In figure 3f, a more straightforward and precise comparison is to use the stimulus decoders to predict the choice, and test whether the more specific or the more general can predict choices more accurately.
We have added a new panel to Figure 3 (Figure 3G) that illustrates the results of this analysis comparing whether the specific or more-general decoders predict the monkey’s trial-by-trial choices more accurately:
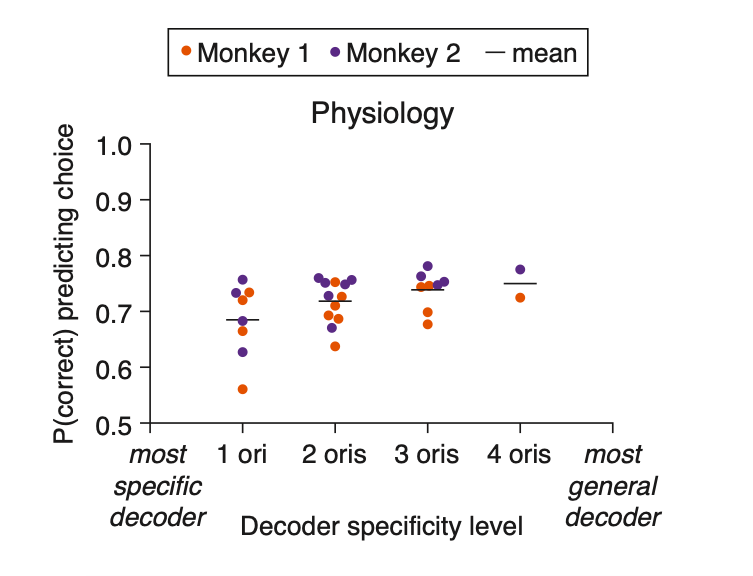
Figure 3… (G) The more general the decoder (x-axis), the better its performance predicting the monkey’s choices on the median changed orientation trials (y-axis; the proportion of leave-one-out trials in which the decoder correctly predicted the monkey’s decision as to whether the orientation was the starting orientation or the median changed orientation). Conventions as in (F) (see Methods for n values).
The description of this new panel in the Results section is as below:
“Further, the more general the decoder, the better it predicted the monkey’s trial-by-trial choices on the median changed orientation trials (Figure 3G).”
The updated Methods section describing this new panel is as below:
“For Figure 3G, we performanced analyses similar to those performed for Figure 3F, in that we tested each stimulus decoder: ‘1 ori’ decoders (n = 8 decoders; 1 specific decoder for either the first, second, fourth, or fifth largest changed orientation, for each of the 2 monkeys), ‘2 oris’ decoders (n = 12 decoders; 1 decoder for each of the 6 combinations of 2 changed orientations, for each of the 2 monkeys), ‘3 oris’ decoders (n = 8 decoders; 1 decoder for each of the 4 combinations of 3 changed orientations, for each of the 2 monkeys), and ‘4 oris’ decoders (n = 2 decoders; 1 decoder for the 1 combination of 4 changed orientations, for each of the 2 monkeys). However, unlike in Figure 3F, where the performance of the stimulus decoders was compared to the performance of the monkey’s decoder on the median orientation-change trials, here we calculated the performance of the stimulus decoder when tasked with predicting the trial-by-trial choices that the monkey made on the median orientation-change trials. We plotted the proportion of leave-one-out trials in which each decoder correctly predicted the monkey’s choice as to whether the orientation was the starting orientation or the median changed orientation.”
3. The main goal of the manuscript is to determine the impact of noise correlations on various decoding schemes. The figures however only show how decoding co-varies with correlations, but a direct, more causal analysis of the effect of correlations on decoding seems to be missing. Such an analysis can be obtained by comparing decoding on simultaneously recorded activity with decoding on trial-shuffled activity, in which noise-correlations are removed.
We have added the following Discussion section to address this point:
“The purpose of this study was to investigate the relationship between mean correlated variability and a general decoder. We made an initial test of the overarching hypothesis that observers use a general decoding strategy in feature-rich environments by testing whether a decoder optimized for a broader range of stimulus values better matched the decoder actually used by the monkeys than a specific decoder optimized for a narrower range of stimulus values. We purposefully did not make claims about the utility of correlated variability relative to hypothetical situations in which correlated variability does not exist in the responses of a group of neurons, as we suspect that this is not a physiologically realistic condition. Studies that causally manipulate the level of correlated variability in neuronal populations to measure the true physiological and behavioral effects of increasing or decreasing correlated variability levels, through pharmacological or genetic means, may provide important insights into the impact of correlated variability on various decoding strategies.”
4. How different are the four different decoders (specific/monkey, cued/uncued)? It would be interesting to see how much they overlap. More generally, the authors should discuss the alternative that attention modulates also the readout/decoding weights, rather than or in addition to modulating V4 activity.
We have added the following to the manuscript:
“A fixed readout mechanism
A prior study from our lab found that attention, rather than changing the neuronal weights of the observer’s decoder, reshaped neuronal population activity to better align with a fixed readout mechanism (Ruff & Cohen, 2019). To test whether the neuronal weights of the monkey’s decoder changed across attention conditions (attended versus unattended), Ruff and Cohen switched the neuronal weights across conditions, testing the stimulus information in one attention condition with the neuronal weights from the other. They found that even with the switched weights, the performance of the monkey’s decoder was still higher in the attended condition. The results of this study support the conclusion that attention reshapes neuronal activity so that a fixed readout mechanism can better read out stimulus information. In other words, differences in the performance of the monkey’s decoder across attention conditions may be due to differences in how well the neuronal activity aligns with a fixed decoder.
Our study extends the findings of Ruff and Cohen to test whether that fixed readout mechanism is determined by a general decoding strategy. Our findings support the hypothesis that observers use a general decoding strategy in the face of changing stimulus and task conditions. Our findings do not exclude other potential explanations for the suboptimality of the monkey’s decoder, nor do they exclude the possibility that attention modulates decoder neuronal weights. However, our findings together with those of Ruff and Cohen shed light on why neuronal decoders are suboptimal in a manner that aligns the fixed decoder axis with the correlated variability axis (Ni et al., 2018; Ruff et al., 2018).”
5. Quantifying the link between model and data :
5.1 the text providing motivation for the model could be improved. The motivation used in the manuscript is, essentially, that the model allows to extrapolate beyond the data (more stimuli, more repetitions, more neurons). The dangers of extrapolation beyond the range of the data are however well known. A model that extrapolates beyond existing data is useful to design new experiments and test predictions, but this is not done here. Because the manuscript is about information and decoding, a better motivation is the fact that this model takes an actual image as input, and produces tuning and covariance compatible with each other because they are constrained by an actual network that processes the input (as opposed to parametric models where tuning and covariance can be manipulated independently).We have modified the manuscript as below:
“Here, we describe a circuit model that we designed to allow us to compare the specific and monkey’s decoders from our electrophysiological dataset to modeled ideal specific and general decoders. The primary benefit of our model is that it can take actual images as inputs and produce neuronal tuning and covariance that are compatible with each other because of constraints from the simulated network that processed the inputs (Huang et al., 2019). Parametric models in which tuning and covariance can be manipulated independently would not provide such constraints. In our model, the mean correlated variability of the population activity is restricted to very few dimensions, matching experimentally recorded data from visual cortex demonstrating that mean correlated variability occupies a low-dimensional subset of the full neuronal population space (Ecker et al., 2014; Goris et al., 2014; Huang et al., 2019; Kanashiro et al., 2017; Lin et al., 2015; Rabinowitz et al., 2015; Semedo et al., 2019; Williamson et al., 2016).”
“Our study also demonstrates the utility of combining electrophysiological and circuit modeling approaches to studying neural coding. Our model mimicked the correlated variability and effects of attention in our physiological data. Critically, our model produced neuronal tuning and covariance based on the constraints of an actual network capable of processing images as inputs.”
We have also removed the Results and Discussion text that suggested that the model allowed us to extrapolate beyond the data.
5.2 The ring structure, and the orientation of correlations (Fig 2b) seem to be key ingredients of the model, but are they based on data, or ad-hoc assumptions?
We have modified the manuscript to clarify this point, as below:
“As the basis for our modeled general decoder, we first mapped the n-dimensional neuronal activity of our model in response to the full range of orientations to a 2-dimensional space. Because the neurons were tuned for orientation, we could map the n-dimensional population responses to a ring (Figure 2B, C). The orientation of correlations (the shape of each color cloud in Figure 2B) was not an assumed parameter, and illustrates the outcome of the correlation structure and dimensionality modeled by our data. In Figure 2B, we can see that the fluctuations along the radial directions are much larger than those along other directions for a given orientation. This is consistent with the low-dimensional structure of the modeled neuronal activity. In our model, the fluctuations of the neurons, mapped to the radial direction on the ring, were more elongated in the unattended state (Figure 2B) than in the attended state (Figure 2C).”
5.3 In the model, the specific decoder is quite strongly linked to correlated variability and the improvement of the general decoder is clear but incremental (0.66 vs 0.83) whereas in the data there really is no correlation at all (Fig 3c). This is a bit problematic because the author's begin by stating that specific decoders cannot explain the link between noise correlations and accuracy but their specific decoder clearly shows a link.
We appreciate this point and have modified the manuscript as below:
“Indeed, we found that just as the performance of the physiological monkey’s decoder was more strongly related to mean correlated variability than the performance of the physiological specific decoder (Figure 3C; see Figure 3–figure supplement 1 for analyses per attention condition), the performance of the modeled general decoder was more strongly related to mean correlated variability than the performance of the modeled specific decoder (Figure 3D). We modeled much stronger relationships to correlated variability (Figure 3D) than observed with our physiological data (Figure 3C). We observed that the correlation with specific decoder performance was significant with the modeled data but not with the physiological data. This is not surprising as we saw attentional effects, albeit small ones, on specific decoder performance with both the physiological and the modeled data (Figure 3A, B). Even small attentional effects would result in a correlation between decoder performance and mean correlated variability with a large enough range of mean correlated variability values. It is possible that with enough electrophysiological data, the performance of the specific decoder would be significantly related to correlated variability, as well. As described above, our focus is not on whether the performance of any one decoder is significantly correlated with mean correlated variability, but on which decoder provides a better explanation of the frequently observed relationship between performance and mean correlated variability. The performance of the general decoder was more strongly related to mean correlated variability than the performance of the specific decoder.”
“Our results suggest that the relationship between behavior and mean correlated variability is more consistent with observers using a more general strategy that employs the same neuronal weights for decoding any stimulus change.”
6. General decoder: Some parts of the text (eg. Line 60, Line 413) refer to a decoder that accounts for discrimination along different stimulus dimensions (eg. different values of orientation, or different color of the visual input). But the results of the manuscripts are about a general decoder for multiple values along a single stimulus dimension. The disconnect should be discussed, and the relation between these two scenarios explained.
We have modified the manuscript as below:
“Here, we report the results of an initial test of this overarching hypothesis, based on a single stimulus dimension. We used a simple, well-studied behavioral task to test whether a more-general decoder (optimized for a broader range of stimulus values along a single dimension) better explained the relationship between behavior and mean correlated variability than a more-specific decoder (optimized for a narrower range of stimulus values along a single dimension). Specifically, we used a well-studied orientation change-detection task (Cohen & Maunsell, 2009) to test whether a general decoder for the full range of stimulus orientations better explained the relationship between behavior and mean correlated variability than a specific decoder for the orientation change presented in the behavioral trial at hand.
This test based on a single stimulus dimension is an important initial test of the general decoder hypothesis because many of the studies that found that performance increased when mean correlated variability decreased used a change-detection task…”
“We performed this initial test of the overarching general decoder hypothesis in the context of a change-detection task along a single stimulus dimension because this type of task was used in many of the studies that reported a relationship between perceptual performance and mean correlated variability (Cohen & Maunsell, 2009; 2011; Herrero et al., 2013; Luo & Maunsell, 2015; Mayo & Maunsell, 2016; Nandy et al., 2017; Ni et al., 2018; Ruff & Cohen, 2016; 2019; Verhoef & Maunsell, 2017; Yan et al., 2014; Zénon & Krauzlis, 2012). This simple and well-studied task provided an ideal initial test of our general decoder hypothesis.
This initial test of the general decoder hypothesis suggests that a more general decoding strategy may explain observations in studies that use a variety of behavioral and stimulus conditions.”
“This initial study of the general decoder hypothesis tested this idea in the context of a visual environment in which stimulus values only changed along a single dimension. However, our overarching hypothesis is that observers use a general decoding strategy in the complex and feature-rich visual scenes encountered in natural environments. In everyday environments, visual stimuli can change rapidly and unpredictably along many stimulus dimensions. The hypothesis that such a truly general decoder explains the relationship between perceptual performance and mean correlated variability is suggested by our finding that the modeled general decoder for orientation was more strongly related to mean correlated variability than the modeled specific decoder (Figure 3D). Future tests of a general decoder for multiple stimulus features would be needed to determine if this decoding strategy is used in the face of multiple changing stimulus features. Further, such tests would need to consider alternative hypotheses for how sensory information is decoded when observing multiple aspects of a stimulus (Berkes et al., 2009; Deneve, 2012; Lorteije et al., 2015). Studies that use complex or naturalistic visual stimuli may be ideal for further investigations of this hypothesis.”
7. Some statements in the discussion such as l 354 "the relationship between behavior and mean correlated variability is explained by the hypothesis that observers use a general strategy" should be qualified : the authors clearly show that the general decoder amplifies the relationship but in their own data the relationship exists already with a specific decoder.
We have modified the manuscript as below:
“Our results suggest that the relationship between behavior and mean correlated variability is more consistent with observers using a more general strategy that employs the same neuronal weights for decoding any stimulus change.
“Together, these results support the hypothesis that observers use a more general decoding strategy in scenarios that require flexibility to changing stimulus conditions.”
“This initial test of the general decoder hypothesis suggests that a more general decoding strategy may explain observations in studies that use a variety of behavioral and stimulus conditions.”
8. Low-Dimensionality, beginning of Introduction and end of Discussion: experimentally, cortical activity is low-dimensional, and the proposed model captures that. But some of the reviewers did not understand the argument offered for why this matters, for the relation between average correlations and performance. It seems that the dimensionality of the population covariance is not relevant: The point instead is that a change in amplitude of fluctuations along the f'f' direction necessarily impact performance of a "specific" decoder, whereas changes in all other dimensions can be accounted for by the appropriate weights of the "specific" decoder. On the other hand, changes in fluctuation strength along multiple directions may impact the performance of the "general" decoder.
We have modified the manuscript as below:
“These observations comprise a paradox because changes in this simple measure should have a minimal effect on information coding. Recent theoretical work shows that neuronal population decoders that extract the maximum amount of sensory information for the specific task at hand can easily ignore mean correlated noise (Kafashan et al., 2021; Kanitscheider et al., 2015b; Moreno-Bote et al., 2014; Pitkow et al., 2015; Rumyantsev et al., 2020; for review, see Kohn et al., 2016). Decoders for the specific task at hand can ignore mean correlated variability because it does not corrupt the dimensions of neuronal population space that are most informative about the stimulus (Moreno-Bote et al., 2014).”
“Our results address a paradox in the literature. Electrophysiological and theoretical evidence supports that there is a relationship between mean correlated variability and perceptual performance (Abbott & Dayan, 1999; Clery et al., 2017; Haefner et al., 2013; Jin et al., 2019; Ni et al., 2018; Ruff & Cohen, 2019; reviewed by Ruff et al., 2018). Yet, a specific decoding strategy in which different sets of neuronal weights are used to decode different stimulus changes cannot easily explain this relationship (Kafashan et al., 2021; Kanitscheider et al., 2015b; Moreno-Bote et al., 2014; Pitkow et al., 2015; Rumyantsev et al., 2020; reviewed by Kohn et al., 2016). This is because specific decoders of neuronal population activity can easily ignore changes in mean correlated noise (Moreno-Bote et al., 2014).”
-
Evaluation Summary:
This manuscript will be of interest to the community interested in how the coordinated activity of neurons influence both coding and behaviour. It successfully combines a sophisticated model of the visual system with data analysis to support a well-formulated hypothesis of the importance of general decoding. This is a potentially important contribution, that addresses a widely observed, but puzzling, relation between perceptual performance and noise correlations.
(This preprint has been reviewed by eLife. We include the public reviews from the reviewers here; the authors also receive private feedback with suggested changes to the manuscript. The reviewers remained anonymous to the authors.)
-
Joint Public Review:
A highly robust result when investigating how neural population activity is impacted by performance in a task is that the trial to trial correlations (noise correlations) between neurons is reduced as performance increases. However the theoretical and experimental literature so far has failed to account for this robust link since reduced noise correlations do not systematically contribute to improved availability or transmission of information (often measured using decoding of stimulus identity). This paper sets out to address this discrepancy by proposing that the key to linking noise correlations to decoding and thus bridging the gap with performance is to rethink the decoders we use : instead of decoders optimized to the specific task imposed on the animal on any given trial (A vs B / B vs C / A vs C), they …
Joint Public Review:
A highly robust result when investigating how neural population activity is impacted by performance in a task is that the trial to trial correlations (noise correlations) between neurons is reduced as performance increases. However the theoretical and experimental literature so far has failed to account for this robust link since reduced noise correlations do not systematically contribute to improved availability or transmission of information (often measured using decoding of stimulus identity). This paper sets out to address this discrepancy by proposing that the key to linking noise correlations to decoding and thus bridging the gap with performance is to rethink the decoders we use : instead of decoders optimized to the specific task imposed on the animal on any given trial (A vs B / B vs C / A vs C), they hypothesize that we should favor a decoder optimized for a general readout of stimulus properties (A vs B vs C).
To test this hypothesis, the authors use a combination of quantitative data analysis and mechanistic network modeling. Data were recorded from neuronal populations in area V4 of two monkeys trained to perform an orientation change detection task, where the magnitude of orientation change could vary across trials, and the change could happen at cued (attended) or uncued (unattended) locations in the visual field. The model, which extends previous work by the authors, reproduces many basic features of the data, and both the model and data offer support for the hypothesis.
The reviewers agreed that this is a potentially important contribution, that addresses a widely observed, but puzzling, relation between perceptual performance and noise correlations. The clarity of the hypothesis, and the combination of data analysis and computational modelling are two essential strengths of the paper.
Overall this paper exhibits a new factor to be taken into account when analysing neural data : the choice of decoder and in particular how general or specific the decoder is. The fact that the generality of the decoder sheds light on the much debated question of noise correlations underscores its importance. The paper therefore opens multiple avenues for future research to probe this new idea, in particular for tasks with multiple stimuli dimensions.
Nonetheless, as detailed below, the reviewers believe the manuscript clarity could be further improved in several points, and some additional analysis of the data would provide more straightforward test of the hypothesis.
1. It would be important to verify that the model reproduces the correlation between noise and signal correlations since this is really a key argument leading to the author's hypothesis.
2. Testing the hypothesis of the general decoder:
2.1 In the data, the authors compare mainly the specific (stimulus) decoder and the monkey's choice decoder. The general stimulus decoder is only considered in fig. 3f, because data across multiple orientations are available only for the cued condition, and therefore the general and specific decoders cannot be compared for changes between cued and uncued. However, the hypothesized relation between mean correlations and performance should also be true within a fixed attention condition (cued), comparing sessions with larger vs. smaller correlation. In other words, if the hypothesis is correct, you should find that performance of the "most general" decoder (as in fig. 3f) correlates negatively with average noise correlations, across sessions, more so than the "most specific" decoder.2.2 In figure 3f, a more straightforward and precise comparison is to use the stimulus decoders to predict the choice, and test whether the more specific or the more general can predict choices more accurately.
3. The main goal of the manuscript is to determine the impact of noise correlations on various decoding schemes. The figures however only show how decoding co-varies with correlations, but a direct, more causal analysis of the effect of correlations on decoding seems to be missing. Such an analysis can be obtained by comparing decoding on simultaneously recorded activity with decoding on trial-shuffled activity, in which noise-correlations are removed.
4. How different are the four different decoders (specific/monkey, cued/uncued)? It would be interesting to see how much they overlap. More generally, the authors should discuss the alternative that attention modulates also the readout/decoding weights, rather than or in addition to modulating V4 activity.
5. Quantifying the link between model and data :
5.1 the text providing motivation for the model could be improved. The motivation used in the manuscript is, essentially, that the model allows to extrapolate beyond the data (more stimuli, more repetitions, more neurons). The dangers of extrapolation beyond the range of the data are however well known. A model that extrapolates beyond existing data is useful to design new experiments and test predictions, but this is not done here. Because the manuscript is about information and decoding, a better motivation is the fact that this model takes an actual image as input, and produces tuning and covariance compatible with each other because they are constrained by an actual network that processes the input (as opposed to parametric models where tuning and covariance can be manipulated independently).5.2 The ring structure, and the orientation of correlations (Fig 2b) seem to be key ingredients of the model, but are they based on data, or ad-hoc assumptions?
5.3 In the model, the specific decoder is quite strongly linked to correlated variability and the improvement of the general decoder is clear but incremental (0.66 vs 0.83) whereas in the data there really is no correlation at all (Fig 3c). This is a bit problematic because the author's begin by stating that specific decoders cannot explain the link between noise correlations and accuracy but their specific decoder clearly shows a link.
6. General decoder: Some parts of the text (eg. Line 60, Line 413) refer to a decoder that accounts for discrimination along different stimulus dimensions (eg. different values of orientation, or different color of the visual input). But the results of the manuscripts are about a general decoder for multiple values along a single stimulus dimension. The disconnect should be discussed, and the relation between these two scenarios explained.
7. Some statements in the discussion such as l 354 "the relationship between behavior and mean correlated variability is explained by the hypothesis that observers use a general strategy" should be qualified : the authors clearly show that the general decoder amplifies the relationship but in their own data the relationship exists already with a specific decoder.
8. Low-Dimensionality, beginning of Introduction and end of Discussion: experimentally, cortical activity is low-dimensional, and the proposed model captures that. But some of the reviewers did not understand the argument offered for why this matters, for the relation between average correlations and performance. It seems that the dimensionality of the population covariance is not relevant: The point instead is that a change in amplitude of fluctuations along the f'f' direction necessarily impact performance of a "specific" decoder, whereas changes in all other dimensions can be accounted for by the appropriate weights of the "specific" decoder. On the other hand, changes in fluctuation strength along multiple directions may impact the performance of the "general" decoder.
-
