A Quick and Easy Way to Estimate Entropy and Mutual Information for Neuroscience
This article has been Reviewed by the following groups
Discuss this preprint
Start a discussion What are Sciety discussions?Listed in
- Ahmed Unshur's List (ahmedunshur)
- Evaluated articles (Peer Community in Neuroscience)
Abstract
Calculations of entropy of a signal or mutual information between two variables are valuable analytical tools in the field of neuroscience. They can be applied to all types of data, capture non-linear interactions and are model independent. Yet the limited size and number of recordings one can collect in a series of experiments makes their calculation highly prone to sampling bias. Mathematical methods to overcome this so-called “sampling disaster” exist, but require significant expertise, great time and computational costs. As such, there is a need for a simple, unbiased and computationally efficient tool for estimating the level of entropy and mutual information. In this article, we propose that application of entropy-encoding compression algorithms widely used in text and image compression fulfill these requirements. By simply saving the signal in PNG picture format and measuring the size of the file on the hard drive, we can estimate entropy changes through different conditions. Furthermore, with some simple modifications of the PNG file, we can also estimate the evolution of mutual information between a stimulus and the observed responses through different conditions. We first demonstrate the applicability of this method using white-noise-like signals. Then, while this method can be used in all kind of experimental conditions, we provide examples of its application in patch-clamp recordings, detection of place cells and histological data. Although this method does not give an absolute value of entropy or mutual information, it is mathematically correct, and its simplicity and broad use make it a powerful tool for their estimation through experiments.
Article activity feed
-
-

Entropy and mutual information are useful metrics for quantitative analyses of various signals across the sciences including neuroscience (Verdú, 2019). The information that a neuron transfers about a sensory stimulus is just one of many examples of this. However, estimating the entropy of neural data is often difficult due to limited sampling (Tovée et al., 1993; Treves and Panzeri, 1995). This manuscript overcomes this problem with a 'quick and dirty' trick: just save the corresponding plots as PNG files and measure the file sizes! The idea is that the size of the PNG file obtained by saving a particular set of data will reflect the amount of variability present in the data and will therefore provide an indirect estimation of the entropy content of the data.
The method the study employs is based on Shannon’s Source Coding Theorem - …Entropy and mutual information are useful metrics for quantitative analyses of various signals across the sciences including neuroscience (Verdú, 2019). The information that a neuron transfers about a sensory stimulus is just one of many examples of this. However, estimating the entropy of neural data is often difficult due to limited sampling (Tovée et al., 1993; Treves and Panzeri, 1995). This manuscript overcomes this problem with a 'quick and dirty' trick: just save the corresponding plots as PNG files and measure the file sizes! The idea is that the size of the PNG file obtained by saving a particular set of data will reflect the amount of variability present in the data and will therefore provide an indirect estimation of the entropy content of the data.
The method the study employs is based on Shannon’s Source Coding Theorem - an approach used in the field of compressed sensing - which is still not widely used in neuroscience. The resulting algorithm is very straightforward, essentially consisting of just saving a figure of your data as a PNG file. Therefore it provides a useful tool for a fast and computationally efficient evaluation of the information content of a signal, without having to resort to more math-heavy methods (as the computation is done “for free” by the PNG compression software). It also opens up the possibility to pursue a similar strategy with other (than PNG) image compression software. The main limitation is that the PNG conversion method presented here allows only a relative entropy estimation: the size of the file is not the absolute value of entropy, due to the fact that the PNG algorithm also involves filtering for 2D images.
The study comprehensively reviews the use of entropy estimation in circuit neuroscience, and then tests the PNG method against other math-heavy methods, which have also been made accessible elsewhere (Ince et al., 2010). The study demonstrates use of the method in several applications. First, the mutual information between stimulus and neural response in whole-cell and unit recordings is estimated. Second, the study applies the method to experimental situations with less experimental control - such as recordings of hippocampal place cells (O’Keefe & Dostrovsky,1971) as animals freely explore an environment. The study shows the method can replicate previously established metrics in the field (e.g. Skaggs information, Skaggs et al. 1993). Importantly, it does this while making fewer assumptions on the data than traditional methods. Third, he study extends the use of the method to imaging data of neuronal morphology, such as charting the growth stage of neuronal cultures. However, the radial entropy of a dendritic tree seems at first more difficult to interpret than the common Sholl analysis of radial crossings of dendrite segments (Figure 6Ac of Zbili and Rama, 2021). As the authors note, a similar technique is used in paleobiology to discriminate pictures of biogenic rocks from abiogenic ones (Wagstaff and Corsetti, 2010). Perhaps neuronal subtypes could also be easily distinguished through PNG file size (Yuste et al., 2020). These examples are generally promising and creative applications.The authors used open source software and openly shared their code so anyone can give it a spin (https://github.com/Sylvain-Deposit/PNG-Entropy).
We were inspired by the wide applicability of the presented back-of-the-envelope technique, so we used it in a situation that the study had not tested: namely, the dissection of microcircuits via optogenetic tagging of target neurons. In this process, one is often confronted with the problem that not only the opsin-carrying cells will spike in response to light, but also other nearby neurons which are activated synaptically (via the opto-tagged cell). Separating these two types of responses is typically done using a latency or jitter analysis, which requires the experimenter subjectively searching for detection parameters. Therefore a rapid and objective technique is preferable. The PNG rate difference method on slice whole cell recordings of opsin tagged neurons revealed higher mutual information metrics for direct optogenetic activation than for postsynaptic responses, showing the method can be easily used to objectively segregate different spike triggers.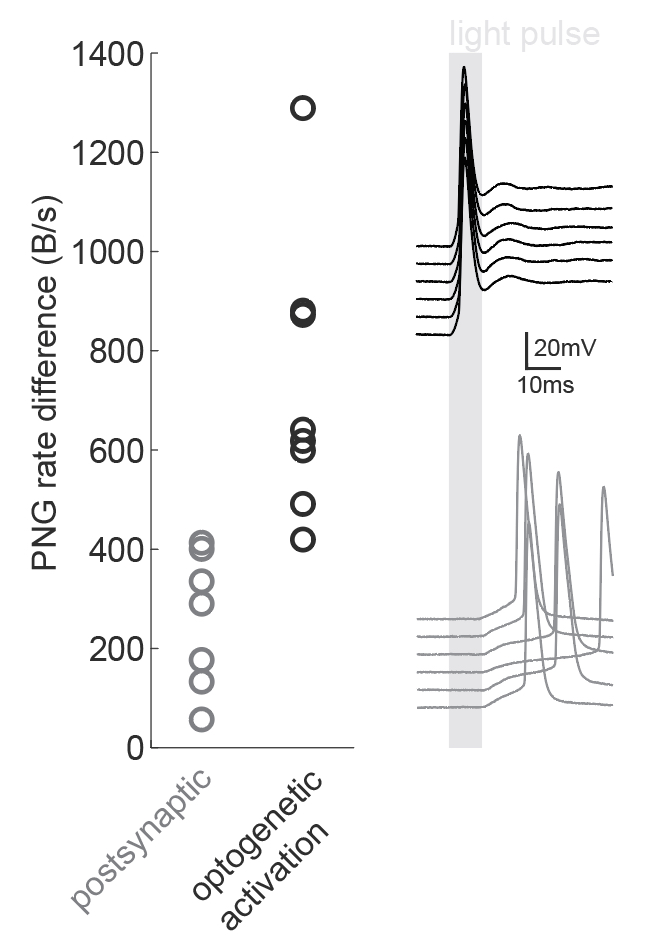
Figure caption: Using a PNG entropy metric to distinguish between direct optogenetic responses and postsynaptic excitatory responses. Left, PNG rate difference calculated for whole cell recordings of optogenetic activation in brain slices. About 20 consecutive 60ms sweeps were analysed from each of 7 postsynaptic cells and 8 directly activated cells. Analysis was performed as in Fig4B of the preprint (https://doi.org/10.1101/2020.08.04.236174) using code from https://github.com/Sylvain-Deposit/PNG-Entropy/blob/master/BatchSaveAsPNG.py. Right, six example traces from a cell carrying channelrhodopsin (black, top) and a cell that was excited synaptically (gray, bottom).
References
Ince, R.A.A., Mazzoni, A., Petersen, R.S., and Panzeri, S. (2010). Open source tools for the information theoretic analysis of neural data. Front Neurosci 4. https://doi.org/10.3389/neuro.01.011.2010
O'Keefe, J., & Dostrovsky, J. (1971). The hippocampus as a spatial map. Preliminary evidence from unit activity in the freely-moving rat. Brain Research, 34(1), 171-175. https://doi.org/10.1016/0006-8993(71)90358-1
Skaggs, M. E., McNaughton, B. L., Gothard, K. M., and Markus, E. J. (1993). An information-theoretic approach to deciphering the hippocampal code. Adv. Neural Inform. Process Syst. 5, 1030-1037.
Tovée, M.J., Rolls, E.T., Treves, A., and Bellis, R.P. (1993). Information encoding and the responses of single neurons in the primate temporal visual cortex. J Neurophysiol 70, 640-654. https://doi.org/10.1152/jn.1993.70.2.640
Treves, A., and Panzeri, S. (1995). The Upward Bias in Measures of Information Derived from Limited Data Samples. Neural Computation 7, 399-407. https://doi.org/10.1162/neco.1995.7.2.399
Verdú, S. (2019). Empirical Estimation of Information Measures: A Literature Guide. Entropy (Basel) 21. https://doi.org/10.3390/e21080720
Wagstaff, K.L., and Corsetti, F.A. (2010). An evaluation of information-theoretic methods for detecting structural microbial biosignatures. Astrobiology 10, 363-379. https://doi.org/10.1089/ast.2008.0301
Yuste, R., Hawrylycz, M., Aalling, N., Aguilar-Valles, A., Arendt, D., Armañanzas, R., Ascoli, G.A., Bielza, C., Bokharaie, V., Bergmann, T.B., et al. (2020). A community-based transcriptomics classification and nomenclature of neocortical cell types. Nat Neurosci 23, 1456-1468. https://doi.org/10.1038/s41593-020-0685-8
Zbili, M., and Rama, S. (2021). A quick and easy way to estimate entropy and mutual information for neuroscience. BioRxiv 2020.08.04.236174. https://doi.org/10.1101/2020.08.04.236174 -
