Identifying regulators of associative learning using a protein-labelling approach in Caenorhabditis elegans
Curation statements for this article:-
Curated by eLife

eLife Assessment
In reporting on a valuable "learning proteome" for a C. elegans gustatory associative learning paradigm, this work identifies a new set of genes to be tested for roles in learning and memory, describes molecular pathways involving these genes and relevant for learning and memory in C. elegans, and deliver a new set of tools for prodding worm behavior. The methods and results convincingly support the findings, which will be of interest to neuroscientists and developmental biologists seeking to understand the self-assembly and operation of neural circuits for learning and memory.
[Editors' note: this paper was reviewed by Review Commons.]
This article has been Reviewed by the following groups
Discuss this preprint
Start a discussion What are Sciety discussions?Listed in
- Evaluated articles (eLife)
- Evaluated articles (Review Commons)
Abstract
The ability to learn and form memories is critical for animals to make choices that promote their survival. The biological processes underlying learning and memory are mediated by a variety of genes in the nervous system, acting at specific times during memory encoding, consolidation, and retrieval. Many studies have utilised candidate gene approaches or random mutagenesis screens in model animals to explore the key molecular drivers for learning and memory. We propose a complementary approach to identify this network of learning regulators: the proximity-labelling tool TurboID, which promiscuously biotinylates neighbouring proteins, to snapshot the proteomic profile of neurons during learning. To do this, we expressed the TurboID enzyme in the entire nervous system of Caenorhabditis elegans and exposed animals to biotin only during the training step of an appetitive gustatory learning paradigm. Our approach revealed hundreds of proteins specific to ‘trained’ worms, including components of molecular pathways previously implicated in memory in multiple species such as insulin signalling, G-protein-coupled receptor signalling, and MAP kinase signalling. Most (87–95%) of the proteins identified are neuronal, with relatively high representation for neuron classes involved in locomotion and learning. We validated several novel regulators of learning, including cholinergic receptors (ACC-1, ACC-3, LGC-46) and putative arginine kinase F46H5.3. These previously uncharacterised learning regulators all showed a clear impact on appetitive gustatory learning, with F46H5.3 showing an additional effect on aversive gustatory memory. Overall, we show that proximity labelling can be used in the brain of a small animal as a feasible and effective method to advance our knowledge on the biology of learning.
Article activity feed
-

-
-

eLife Assessment
In reporting on a valuable "learning proteome" for a C. elegans gustatory associative learning paradigm, this work identifies a new set of genes to be tested for roles in learning and memory, describes molecular pathways involving these genes and relevant for learning and memory in C. elegans, and deliver a new set of tools for prodding worm behavior. The methods and results convincingly support the findings, which will be of interest to neuroscientists and developmental biologists seeking to understand the self-assembly and operation of neural circuits for learning and memory.
[Editors' note: this paper was reviewed by Review Commons.]
-
Reviewer #1 (Public review):
Summary:
Rahmani et al. utilize the TurboID method to characterize global proteome changes in the worm's nervous system induced by a salt-based associative learning paradigm. Altogether, they uncover 706 proteins tagged by the TurboID method in worms that underwent the memory-inducing protocol. Next, the authors conduct a gene enrichment analysis that implicates specific molecular pathways in salt-associative learning, such as MAP kinase and cAMP-mediated pathways, as well as specific neuronal classes including pharyngeal neurons, and specific sensory neurons, interneurons, and motor neurons. The authors then screen a representative group of hits from the proteome analysis. They find that mutants of candidate genes from the MAP kinase pathway, namely dlk-1 and uev-3, do not affect performance in the learning …
Reviewer #1 (Public review):
Summary:
Rahmani et al. utilize the TurboID method to characterize global proteome changes in the worm's nervous system induced by a salt-based associative learning paradigm. Altogether, they uncover 706 proteins tagged by the TurboID method in worms that underwent the memory-inducing protocol. Next, the authors conduct a gene enrichment analysis that implicates specific molecular pathways in salt-associative learning, such as MAP kinase and cAMP-mediated pathways, as well as specific neuronal classes including pharyngeal neurons, and specific sensory neurons, interneurons, and motor neurons. The authors then screen a representative group of hits from the proteome analysis. They find that mutants of candidate genes from the MAP kinase pathway, namely dlk-1 and uev-3, do not affect performance in the learning paradigm. Instead, multiple acetylcholine signaling mutants, as well as a protein-kinase-A mutant, significantly affected performance in the associative memory assay (e.g., acc-1, acc-3, lgc-46, and kin-2). Finally, the authors demonstrate that protein-kinase-A mutants, as well as acetylcholine signaling mutants, do not exhibit a phenotype in a related but distinct conditioning paradigm-aversive salt conditioning-suggesting their effect is specific to appetitive salt conditioning.
Overall, the authors addressed the concerns raised in the previous review round, including the statistics of the chemotaxis experiments and the systems-level analysis of the neuron class expression patterns of their hits. I also appreciate the further attempt to equalize the sample size of the chemotaxis experiments and the transparent reporting of the sample size and statistics in the figure captions and Table S9. The new results from the panneuronal overexpression of the kin-2 gain-of-function allele also contribute to the manuscript. Together, these make the paper more compelling.
-
Reviewer #2 (Public review):
Summary:
In this study by Rahmani in colleagues, the authors sought to define the "learning proteome" for a gustatory associative learning paradigm in C. elegans. Using a cytoplasmic TurboID expressed under the control of a pan-neuronal promoter, the authors labeled proteins during the training portion of the paradigm, followed by proteomics analysis. This approach revealed hundreds of proteins potentially involved in learning, which the authors describe using gene ontology and pathway analysis. The authors performed functional characterization of over two dozen of these genes for their requirement in learning using the same paradigm. They also compared the requirement for these genes across various learning paradigms and found that most hits they characterized appear to be specifically required for the …
Reviewer #2 (Public review):
Summary:
In this study by Rahmani in colleagues, the authors sought to define the "learning proteome" for a gustatory associative learning paradigm in C. elegans. Using a cytoplasmic TurboID expressed under the control of a pan-neuronal promoter, the authors labeled proteins during the training portion of the paradigm, followed by proteomics analysis. This approach revealed hundreds of proteins potentially involved in learning, which the authors describe using gene ontology and pathway analysis. The authors performed functional characterization of over two dozen of these genes for their requirement in learning using the same paradigm. They also compared the requirement for these genes across various learning paradigms and found that most hits they characterized appear to be specifically required for the training paradigm used for generating the "learning proteome".
Strengths:
- The authors have thoughtfully and transparently designed and reported the results of their study. Controls are carefully thought-out, and hits are ranked as strong and weak. By combining their proteomics with behavioral analysis, the authors also highlight the biological significance of their proteomics findings, and support that even weak hits are meaningful.
- The authors display a high degree of statistical rigor, incorporating normality tests into their behavioral data which is beyond the field standard.
- The authors include pathway analysis that generates interesting hypotheses about processes involved learning and memory
-The authors generally provide thoughtful interpretations for all of their results, both positive and negative, as well as any unexpected outcomes.
-
Reviewer #3 (Public review):
Summary:
In this manuscript, authors used a learning paradigm in C. elegans; when worms were fed in a saltless plate, its chemotaxis to salt is greatly reduced. To identify learning-related proteins, authors employed nervous system-specific transcriptome analysis to compare whole proteins in neurons between high-salt-fed animals and saltless-fed animals. Authors identified "learning-specific proteins" which are observed only after saltless feeding. They categorized these proteins by GO analyses, pathway analyses and expression site analyses, and further stepped forward to test mutants in selected genes identified by the proteome analysis. They find several mutants that are defective or hyper-proficient for learning, including acc-1/3 and lgc-46 acetylcholine receptors, F46H5.3 putative arginine kinase, and …
Reviewer #3 (Public review):
Summary:
In this manuscript, authors used a learning paradigm in C. elegans; when worms were fed in a saltless plate, its chemotaxis to salt is greatly reduced. To identify learning-related proteins, authors employed nervous system-specific transcriptome analysis to compare whole proteins in neurons between high-salt-fed animals and saltless-fed animals. Authors identified "learning-specific proteins" which are observed only after saltless feeding. They categorized these proteins by GO analyses, pathway analyses and expression site analyses, and further stepped forward to test mutants in selected genes identified by the proteome analysis. They find several mutants that are defective or hyper-proficient for learning, including acc-1/3 and lgc-46 acetylcholine receptors, F46H5.3 putative arginine kinase, and kin-2, a cAMP pathway gene. These mutants were not previously reported to have abnormality in the learning paradigm.
Concerns:
Upon revision, authors addressed all concerns of this reviewer, and the results are now presented in a way that facilitates objective evaluation. Authors' conclusions are supported by the results presented, and the strength of the proteomics approach is persuasively demonstrated.
Significance:
(1) Total neural proteome analysis has not been conducted before for learning-induced changes, though transcriptome analysis has been performed for odor learning (Lakhina et al., http://dx.doi.org/10.1016/j.neuron.2014.12.029). This warrants the novelty of this manuscript, because for some genes, protein levels may change even though mRNA levels remain the same. Although in a few reports TurboID has been used in C. elegans, this is the first report of a systematic analysis of tissue-specific differential proteomics.
(2) Authors found five mutants that have abnormality in the salt learning. These genes have not been described to have the abnormality, providing novel knowledge to the readers, especially those who work on C. elegans behavioural plasticity. Especially, involvement of acetylcholine neurotransmission has not been addressed before. Although transgenic rescue experiments have not been performed except kin-2, and the site of action (neurons involved) has not been tested in this manuscript, it will open the venue to further determine the way in which acetylcholine receptors, cAMP pathway etc. influences the learning process.
[Editors' note: this version has been assessed without input from the reviewers.]
-
Author response:
The following is the authors’ response to the original reviews
Comment from the editors at eLife:
You could consider further strengthening the manuscript with the incorporation of new relevant public datasets for network modeling, but that is entirely your choice.
We thank the editors and reviewers for their thoughtful and positive feedback on our article. We are particularly appreciative of the eLife assessment describing our work as valuable with a convincing methodology.
As suggested, we have expanded our neuron class analysis by incorporating transcriptomic data from young adult animals (Kaletsky et al., 2016 Nature; Ghaddar et al., 2023 Science Advances; St Ange et al., 2024 Cell Genomics) to complement our existing analysis of larval stage 4 (L4) animals.
In addition, we have updated Table S1 to include the …
Author response:
The following is the authors’ response to the original reviews
Comment from the editors at eLife:
You could consider further strengthening the manuscript with the incorporation of new relevant public datasets for network modeling, but that is entirely your choice.
We thank the editors and reviewers for their thoughtful and positive feedback on our article. We are particularly appreciative of the eLife assessment describing our work as valuable with a convincing methodology.
As suggested, we have expanded our neuron class analysis by incorporating transcriptomic data from young adult animals (Kaletsky et al., 2016 Nature; Ghaddar et al., 2023 Science Advances; St Ange et al., 2024 Cell Genomics) to complement our existing analysis of larval stage 4 (L4) animals.
In addition, we have updated Table S1 to include the outcross status of all strains used in this study, providing clearer information on the genotypes tested. We have also corrected the typographical errors noted by the reviewers. Please note that page and line numbers below refer to the MS Word Document with tracked changes set to ‘simple markup’.
We greatly appreciate the reviewers’ input and hope these revisions further enhance the value and clarity of our study.
Public Reviews:
Reviewer #1 (Public review):
Summary:
Rahmani et al. utilize the TurboID method to characterize global proteome changes in the worm's nervous system induced by a salt-based associative learning paradigm. Altogether, they uncover 706 proteins tagged by the TurboID method in worms that underwent the memory-inducing protocol. Next, the authors conduct a gene enrichment analysis that implicates specific molecular pathways in salt-associative learning, such as MAP kinase and cAMP-mediated pathways, as well as specific neuronal classes including pharyngeal neurons, and specific sensory neurons, interneurons, and motor neurons. The authors then screen a representative group of hits from the proteome analysis. They find that mutants of candidate genes from the MAP kinase pathway, namely dlk-1 and uev-3, do not affect performance in the learning paradigm. Instead, multiple acetylcholine signaling mutants, as well as a protein-kinase-A mutant, significantly affected performance in the associative memory assay (e.g., acc-1, acc-3, lgc-46, and kin-2). Finally, the authors demonstrate that protein-kinase-A mutants, as well as acetylcholine signaling mutants, do not exhibit a phenotype in a related but distinct conditioning paradigm-aversive salt conditioning-suggesting their effect is specific to appetitive salt conditioning.
Overall, the authors addressed the concerns raised in the previous review round, including the statistics of the chemotaxis experiments and the systems-level analysis of the neuron class expression patterns of their hits. I also appreciate the further attempt to equalize the sample size of the chemotaxis experiments and the transparent reporting of the sample size and statistics in the figure captions and Table S9. The new results from the panneuronal overexpression of the kin-2 gain-of-function allele also contribute to the manuscript. Together, these make the paper more compelling. The additional tested hits provide a comprehensive analysis of the main molecular pathways that could have affected learning. However, the revised manuscript includes more information and analysis, raising additional concerns.
Major comments:
As reviewer 4 noted, and as also shown to be relevant for C30G12.6 presented in Figure 6, the backcrossing of the mutants is important, as background mutations may lead to the observed effects. Could the authors add to Table 1, sheet 1, the outcrossing status of the tested mutants?
We appreciate this important point. A column has now been added to Table S1 to indicate the outcross status of all strains used in this study. Additionally, we have updated the table legend on page 77 to clarify how to interpret the information provided in this column.
It is important to validate that the results of the positive hits (where learning was affected), such as acc-1, acc-3, and lgc-46, do not stem from background mutations.
While we agree that confirming the absence of background mutations is important, we have taken alternative steps to address this concern:
- The outcross status of each strain is now clearly indicated in Table S1.
- Observed phenotypes were consistent across multiple biological replicates over extended periods (months, sometimes years), reducing the likelihood that results stem from background mutations.
We believe these measures provide confidence in the validity of our findings.
The fold change in the number of hits for different neurons in the CENGEN-based rank analysis requires a statistical test (discussed on pages 17-19 and summarized in Table S7). Similar to the other gene enrichment analyses presented in the manuscript, the new rank analysis also requires a statistical test. Since the authors extensively elaborate on the results from this analysis, I think a statistical analysis is especially important for its interpretation. For example, if considering the IL1 neurons, which ranked highest, and assuming random groups of genes-each having the same size as those of the ranked neurons (209 genes in total for IL1 in Table S7)-how common would it be to get the calculated fold change of 1.38 or higher? Such bootstrapping analysis is common for enrichment analysis. Perhaps the authors could consult with an institutional expert (Dr. Pawel Skuza, Flinders University) for the statistical aspects of this analysis.
We appreciate the suggestion and agree that statistical testing can be valuable for enrichment analyses. However, implementing additional tests such as bootstrapping is beyond the scope of this study. Our aim was to provide a descriptive overview rather than inferential statistics. To ensure transparency and interpretability, we have:
- Clearly reported fold changes and rankings in Table S7.
- Discussed the limitations of this approach in the manuscript text (page 18, lines 17–20).
- Clearly outlined the methods used to perform this analysis (pages 53–54).
We believe this descriptive analysis provides sufficient context for interpreting these results.
The learning phenotypes from Figure S8, concerning acc-1, acc-3, and lgc-46 mutants, are summarized in a scheme in Figure 4; however, the chemotaxis results are found in the supplemental Figure S8. Perhaps I missed the reasoning, but for transparency, I think the relevant Figure S8 results should be shown together with their summary scheme in Figure 4.
Thank you for this suggestion to improve clarity. We have now moved the panels corresponding to cholinergic signalling components from Figure S8 into Figure 4 on page 21, so that the summary scheme and underlying data are presented together. The figure legends and main text have been updated accordingly to reflect the correct figure numbers.
Reviewer #2 (Public review):
Summary:
In this study by Rahmani in colleagues, the authors sought to define the "learning proteome" for a gustatory associative learning paradigm in C. elegans. Using a cytoplasmic TurboID expressed under the control of a pan-neuronal promoter, the authors labeled proteins during the training portion of the paradigm, followed by proteomics analysis. This approach revealed hundreds of proteins potentially involved in learning, which the authors describe using gene ontology and pathway analysis. The authors performed functional characterization of over two dozen of these genes for their requirement in learning using the same paradigm. They also compared the requirement for these genes across various learning paradigms and found that most hits they characterized appear to be specifically required for the training paradigm used for generating the "learning proteome".
Strengths:
The authors have thoughtfully and transparently designed and reported the results of their study. Controls are carefully thought-out, and hits are ranked as strong and weak. By combining their proteomics with behavioral analysis, the authors also highlight the biological significance of their proteomics findings, and support that even weak hits are meaningful.
The authors display a high degree of statistical rigor, incorporating normality tests into their behavioral data which is beyond the field standard.
The authors include pathway analysis that generates interesting hypotheses about processes involved learning and memory
The authors generally provide thoughtful interpretations for all of their results, both positive and negative, as well as any unexpected outcomes.
Weaknesses:
- The authors use the Cengen single cell-transcriptomic atlas to predict where the proteins in the "learning proteome" are likely to be expressed and use this data to identify neurons that are likely significant to learning, and building hypothetical circuit. This is an excellent idea; however, the Cengen dataset only contains transcriptomic data from juvenile L4 animals, while the authors performed their proteome experiments in Day 1 Adult animals. It is well documented that the C. elegans nervous system transcriptome is significant different between these two stages (Kaletsky et al., 2016, St. Ange et al., 2024), so the authors might be missing important expression data, resulting in inaccurate or incomplete networks. The adult neuronal single-cell atlas data (https://cestaan.princeton.edu/) would be better suited to incorporate into neuronal expression analysis.
Thank you for highlighting this important point. We have now incorporated transcriptomic data from young adult animals to complement the L4-based CeNGEN dataset. Specifically, we integrated data from CeSTAAN (https://cestaan.princeton.edu/, including St. Ange et al., 2024) and WormSeq (https://wormseq.org/, including Ghaddar et al., 2023), as outlined below. Importantly, CeSTAAN and WormSeq provide data for 79 and 104 neuron classes, respectively (compared to 128 from CeNGEN); for this reason, the main analysis focuses on CeNGEN due to its broader coverage, with additional datasets noted in brackets for completeness. This is stated on page 18, lines 15–17 to ensure transparency regarding our rationale.
The main text has been updated to describe these datasets and their integration into our analysis (pages 18–20), and further details on how these resources were used have been added to the Experimental Procedures (pages 53–54).
We also incorporated data from Kaletsky et al. (2016) and St. Ange et al. (2024) into our neuron identity checks for all assigned and unassigned hits (page 16, lines 8–19). This analysis shows that the nervous system is highly represented in our proteome data: 75–87% of assigned hits and 75–83% of all hits correspond to neuron-enriched genes identified by St. Ange et al. and Kaletsky et al.
In addition, we used several transcriptomic databases to confirm that learning regulators identified in this study through TurboID and validation experiments are expressed in the same neuron classes as suggested by CenGEN (page 36).
- The authors offer many interpretations for why mutants in "learning proteome" hits have no detectable phenotype, which is commendable. They are however overlooking another important interpretation, it is possible that these changes to the proteome are important for memory, which is dependent upon translation and protein level changes, and is molecularly distinct from learning. It is well established in the field mutating or knocking down memory regulators in other paradigms will often have no detectable effect on learning. Incorporating this interpretation into the discussion and highlighting it as an area for future exploration would strengthen the manuscript.
Thank you for this suggestion. We have incorporated this interpretation into the Results section (page 31, lines 17–23), specifying the potential role of these proteomic changes in memory encoding and retention, which are molecularly distinct from learning.
- A minor weakness - In the discussion, the authors state that the Lakhina, et al 2015 used RNA-seq to assess memory transcriptome changes. This study used microarray analysis.
This has been corrected on page 38, line 5.
Significance:
The approach used in this study is interesting and has the potential to further our knowledge about the molecular mechanisms of associative behaviors. There have been multiple transcriptomic studies in the worm looking at gene expression changes in the context of behavioral training. This study compliments and extends those studies, by examining how the proteome changes in a different training paradigm. This approach here could be employed for multiple different training paradigms, presenting a new technical advance for the field. This paper would be of interest to the broader field of behavioral and molecular neuroscience. Though it uses an invertebrate system, many findings in the worm regarding learning and memory translate to higher organisms, making this paper of interest and significant to the broader field of behavioral neuroscience.
Reviewer #4 (Public review):
Summary:
In this manuscript, authors used a learning paradigm in C. elegans; when worms were fed in a saltless plate, its chemotaxis to salt is greatly reduced. To identify learning-related proteins, authors employed nervous system-specific transcriptome analysis to compare whole proteins in neurons between high-salt-fed animals and saltless-fed animals. Authors identified "learning-specific proteins" which are observed only after saltless feeding. They categorized these proteins by GO analyses, pathway analyses and expression site analyses, and further stepped forward to test mutants in selected genes identified by the proteome analysis. They find several mutants that are defective or hyper-proficient for learning, including acc-1/3 and lgc-46 acetylcholine receptors, F46H5.3 putative arginine kinase, and kin-2, a cAMP pathway gene. These mutants were not previously reported to have abnormality in the learning paradigm.
Concerns:
Upon revision, authors addressed all concerns of this reviewer, and the results are now presented in a way that facilitates objective evaluation. Authors' conclusions are supported by the results presented, and the strength of the proteomics approach is persuasively demonstrated.
Thank you, we appreciate this positive feedback.
Significance:
(1) Total neural proteome analysis has not been conducted before for learning-induced changes, though transcriptome analysis has been performed for odor learning (Lakhina et al., http://dx.doi.org/10.1016/j.neuron.2014.12.029). This warrants the novelty of this manuscript, because for some genes, protein levels may change even though mRNA levels remain the same. Although in a few reports TurboID has been used in C. elegans, this is the first report of a systematic analysis of tissue-specific differential proteomics.
(2) Authors found five mutants that have abnormality in the salt learning. These genes have not been described to have the abnormality, providing novel knowledge to the readers, especially those who work on C. elegans behavioural plasticity. Especially, involvement of acetylcholine neurotransmission has not been addressed before. Although transgenic rescue experiments have not been performed except kin-2, and the site of action (neurons involved) has not been tested in this manuscript, it will open the venue to further determine the way in which acetylcholine receptors, cAMP pathway etc. influences the learning process.
Recommendations for the authors:
Reviewer #1 (Recommendations for the authors):
The authors stated in their response to reviewers that "referring to a phenotype as both a trend and non-significant may confuse readers, which was originally stated in the manuscript in two locations," and that such sentences were removed. Unfortunately, in the new text (page 28, lines 18-19), the authors write: "uev-3 mutants showed a lower average CI after training compared with wild-type, but this did not reach statistical significance." As stated before, I find such sentences confusing and not interpretable. If the changes are not significant, then the lower average CI is not informative.
Thank you for pointing this out. This has been corrected to improve clarity – we say instead that “trained phenotypes between wild-type and uev-3 mutants were not statistically significant” (page 29, lines 21–22).
In response to reviewers' comments, the authors added more information about the biotinylation efficiency of the experiment, which is also described in the text:
Page 8, line 27: "we found that biotin exposure increased the signal 1.3-fold for non-Tg and 1.7-fold for TurboID C. elegans."
Page 10, line 4: "Quantification of the signal within entire lanes showed a 1.1-fold increase in the 'TurboID, control' lane compared with the 'non-Tg, control' lane, and a 1.9-fold increase in the 'TurboID, trained' lane compared with the 'non-Tg, trained' lane."
Is it common in this field not to show the actual raw quantified numbers? I was expecting either a bar graph or instead that the measured values would appear in the text alongside the fold-change information.
Table S2 (and its table legend on page 77) have been edited to include raw area values.
Figure 5: Typo? - "pan neuronal expression of ..." The allele number is written as 139, but I believe it should be 179, as in the rest of the paper.
The typo has been corrected on page 25.
The results describing the absence of a learning phenotype in backcrossed C30G12.6 are presented in the main figure. If the authors believe this is an important result, I understand keeping it in the main figure; however, I find this uncommon.
Thank you for your comment. We consider the absence of a learning phenotype in backcrossed C30G12.6 to be an important control for interpreting the original findings, which is why we have retained it in the main figure.
Reviewer #4 (Recommendations for the authors):
I noted a few typos.
(1) In Fig 5B, the transgene is depicted kin-2(ce139) but it is probably kin-2(ce179).
The typo has been corrected on page 25.
(2) In text, R97C and ce179 are used interchangeably, but in fact there is no description that they are identical.
We now state the following in the manuscript: “We tested worms with the ce179 mutant allele in kin-2, in which a conserved residue in the inhibitory domain (which normally functions to keep PKA turned off in the absence of cAMP) is mutated to cause an R92C amino acid change – this results in increased PKA activity (Schade et al., 2005).” (page 25, lines 1–3),
(3) p31 line 7, Figure S7 -> Fig S9 C-E
We apologise for this typographical error. This figure number is meant to correspond to salt associative learning assay data (Fig. S8), not salt aversive learning (Fig. S9). Since the data from Fig. S8 was moved to Fig. 4, the figure citation has been changed from Fig. S7 (which was incorrect) to Fig. 4 (page 32, line 17).
(4) p45 line 11, Fig S9 -> Fig S6
The typo has been corrected (page 47, line 12).
-
-
eLife Assessment
This valuable work defines a "learning proteome" for a C. elegans gustatory associative learning paradigm. These results provide the field with a new set of genes to further explore their roles in learning and memory, provide new tools for other labs to employ in their investigations of behavior, and molecular pathways revelant for C. elegans learning and memory. The methodological evidence and the quality of the dataset are convincing. The results will be of interest to neuroscientists and developmental biologists seeking to understand the self-assembly and operation of neural circuits for learning and memory.
[Editors' note: this paper was reviewed by Review Commons.]
-
Reviewer #1 (Public review):
Summary:
Rahmani et al. utilize the TurboID method to characterize global proteome changes in the worm's nervous system induced by a salt-based associative learning paradigm. Altogether, they uncover 706 proteins tagged by the TurboID method in worms that underwent the memory-inducing protocol. Next, the authors conduct a gene enrichment analysis that implicates specific molecular pathways in salt-associative learning, such as MAP kinase and cAMP-mediated pathways, as well as specific neuronal classes including pharyngeal neurons, and specific sensory neurons, interneurons, and motor neurons. The authors then screen a representative group of hits from the proteome analysis. They find that mutants of candidate genes from the MAP kinase pathway, namely dlk-1 and uev-3, do not affect performance in the learning …
Reviewer #1 (Public review):
Summary:
Rahmani et al. utilize the TurboID method to characterize global proteome changes in the worm's nervous system induced by a salt-based associative learning paradigm. Altogether, they uncover 706 proteins tagged by the TurboID method in worms that underwent the memory-inducing protocol. Next, the authors conduct a gene enrichment analysis that implicates specific molecular pathways in salt-associative learning, such as MAP kinase and cAMP-mediated pathways, as well as specific neuronal classes including pharyngeal neurons, and specific sensory neurons, interneurons, and motor neurons. The authors then screen a representative group of hits from the proteome analysis. They find that mutants of candidate genes from the MAP kinase pathway, namely dlk-1 and uev-3, do not affect performance in the learning paradigm. Instead, multiple acetylcholine signaling mutants, as well as a protein-kinase-A mutant, significantly affected performance in the associative memory assay (e.g., acc-1, acc-3, lgc-46, and kin-2). Finally, the authors demonstrate that protein-kinase-A mutants, as well as acetylcholine signaling mutants, do not exhibit a phenotype in a related but distinct conditioning paradigm-aversive salt conditioning-suggesting their effect is specific to appetitive salt conditioning.
Overall, the authors addressed the concerns raised in the previous review round, including the statistics of the chemotaxis experiments and the systems-level analysis of the neuron class expression patterns of their hits. I also appreciate the further attempt to equalize the sample size of the chemotaxis experiments and the transparent reporting of the sample size and statistics in the figure captions and Table S9. The new results from the panneuronal overexpression of the kin-2 gain-of-function allele also contribute to the manuscript. Together, these make the paper more compelling. The additional tested hits provide a comprehensive analysis of the main molecular pathways that could have affected learning. However, the revised manuscript includes more information and analysis, raising additional concerns.
Major comments:
As reviewer 4 noted, and as also shown to be relevant for C30G12.6 presented in Figure 6, the backcrossing of the mutants is important, as background mutations may lead to the observed effects. Could the authors add to Table 1, sheet 1, the outcrossing status of the tested mutants? It is important to validate that the results of the positive hits (where learning was affected), such as acc-1, acc-3, and lgc-46, do not stem from background mutations.
The fold change in the number of hits for different neurons in the CENGEN-based rank analysis requires a statistical test (discussed on pages 17-19 and summarized in Table S7). Similar to the other gene enrichment analyses presented in the manuscript, the new rank analysis also requires a statistical test. Since the authors extensively elaborate on the results from this analysis, I think a statistical analysis is especially important for its interpretation. For example, if considering the IL1 neurons, which ranked highest, and assuming random groups of genes-each having the same size as those of the ranked neurons (209 genes in total for IL1 in Table S7)-how common would it be to get the calculated fold change of 1.38 or higher? Such bootstrapping analysis is common for enrichment analysis. Perhaps the authors could consult with an institutional expert (Dr. Pawel Skuza, Flinders University) for the statistical aspects of this analysis.
The learning phenotypes from Figure S8, concerning acc-1, acc-3, and lgc-46 mutants, are summarized in a scheme in Figure 4; however, the chemotaxis results are found in the supplemental Figure S8. Perhaps I missed the reasoning, but for transparency, I think the relevant Figure S8 results should be shown together with their summary scheme in Figure 4.
-
Reviewer #2 (Public review):
Summary:
In this study by Rahmani in colleagues, the authors sought to define the "learning proteome" for a gustatory associative learning paradigm in C. elegans. Using a cytoplasmic TurboID expressed under the control of a pan-neuronal promoter, the authors labeled proteins during the training portion of the paradigm, followed by proteomics analysis. This approach revealed hundreds of proteins potentially involved in learning, which the authors describe using gene ontology and pathway analysis. The authors performed functional characterization of over two dozen of these genes for their requirement in learning using the same paradigm. They also compared the requirement for these genes across various learning paradigms and found that most hits they characterized appear to be specifically required for the …
Reviewer #2 (Public review):
Summary:
In this study by Rahmani in colleagues, the authors sought to define the "learning proteome" for a gustatory associative learning paradigm in C. elegans. Using a cytoplasmic TurboID expressed under the control of a pan-neuronal promoter, the authors labeled proteins during the training portion of the paradigm, followed by proteomics analysis. This approach revealed hundreds of proteins potentially involved in learning, which the authors describe using gene ontology and pathway analysis. The authors performed functional characterization of over two dozen of these genes for their requirement in learning using the same paradigm. They also compared the requirement for these genes across various learning paradigms and found that most hits they characterized appear to be specifically required for the training paradigm used for generating the "learning proteome".
Strengths:
- The authors have thoughtfully and transparently designed and reported the results of their study. Controls are carefully thought-out, and hits are ranked as strong and weak. By combining their proteomics with behavioral analysis, the authors also highlight the biological significance of their proteomics findings, and support that even weak hits are meaningful.
- The authors display a high degree of statistical rigor, incorporating normality tests into their behavioral data which is beyond the field standard.
- The authors include pathway analysis that generates interesting hypotheses about processes involved learning and memory
-The authors generally provide thoughtful interpretations for all of their results, both positive and negative, as well as any unexpected outcomes.
Weaknesses:
- The authors use the Cengen single cell-transcriptomic atlas to predict where the proteins in the "learning proteome" are likely to be expressed and use this data to identify neurons that are likely significant to learning, and building hypothetical circuit. This is an excellent idea; however, the Cengen dataset only contains transcriptomic data from juvenile L4 animals, while the authors performed their proteome experiments in Day 1 Adult animals. It is well documented that the C. elegans nervous system transcriptome is significant different between these two stages (Kaletsky et al., 2016, St. Ange et al., 2024), so the authors might be missing important expression data, resulting in inaccurate or incomplete networks. The adult neuronal single-cell atlas data (https://cestaan.princeton.edu/) would be better suited to incorporate into neuronal expression analysis.
- The authors offer many interpretations for why mutants in "learning proteome" hits have no detectable phenotype, which is commendable. They are however overlooking another important interpretation, it is possible that these changes to the proteome are important for memory, which is dependent upon translation and protein level changes, and is molecularly distinct from learning. It is well established in the field mutating or knocking down memory regulators in other paradigms will often have no detectable effect on learning. Incorporating this interpretation into the discussion and highlighting it as an area for future exploration would strengthen the manuscript.
-A minor weakness - In the discussion, the authors state that the Lakhina, et al 2015 used RNA-seq to assess memory transcriptome changes. This study used microarray analysis.
Significance:
The approach used in this study is interesting and has the potential to further our knowledge about the molecular mechanisms of associative behaviors. There have been multiple transcriptomic studies in the worm looking at gene expression changes in the context of behavioral training. This study compliments and extends those studies, by examining how the proteome changes in a different training paradigm. This approach here could be employed for multiple different training paradigms, presenting a new technical advance for the field. This paper would be of interest to the broader field of behavioral and molecular neuroscience. Though it uses an invertebrate system, many findings in the worm regarding learning and memory translate to higher organisms, making this paper of interest and significant to the broader field of behavioral neuroscience.
-
Reviewer #4 (Public review):
Summary:
In this manuscript, authors used a learning paradigm in C. elegans; when worms were fed in a saltless plate, its chemotaxis to salt is greatly reduced. To identify learning-related proteins, authors employed nervous system-specific transcriptome analysis to compare whole proteins in neurons between high-salt-fed animals and saltless-fed animals. Authors identified "learning-specific proteins" which are observed only after saltless feeding. They categorized these proteins by GO analyses, pathway analyses and expression site analyses, and further stepped forward to test mutants in selected genes identified by the proteome analysis. They find several mutants that are defective or hyper-proficient for learning, including acc-1/3 and lgc-46 acetylcholine receptors, F46H5.3 putative arginine kinase, and …
Reviewer #4 (Public review):
Summary:
In this manuscript, authors used a learning paradigm in C. elegans; when worms were fed in a saltless plate, its chemotaxis to salt is greatly reduced. To identify learning-related proteins, authors employed nervous system-specific transcriptome analysis to compare whole proteins in neurons between high-salt-fed animals and saltless-fed animals. Authors identified "learning-specific proteins" which are observed only after saltless feeding. They categorized these proteins by GO analyses, pathway analyses and expression site analyses, and further stepped forward to test mutants in selected genes identified by the proteome analysis. They find several mutants that are defective or hyper-proficient for learning, including acc-1/3 and lgc-46 acetylcholine receptors, F46H5.3 putative arginine kinase, and kin-2, a cAMP pathway gene. These mutants were not previously reported to have abnormality in the learning paradigm.
Concerns:
Upon revision, authors addressed all concerns of this reviewer, and the results are now presented in a way that facilitates objective evaluation. Authors' conclusions are supported by the results presented, and the strength of the proteomics approach is persuasively demonstrated.
Significance:
(1) Total neural proteome analysis has not been conducted before for learning-induced changes, though transcriptome analysis has been performed for odor learning (Lakhina et al., http://dx.doi.org/10.1016/j.neuron.2014.12.029). This warrants the novelty of this manuscript, because for some genes, protein levels may change even though mRNA levels remain the same. Although in a few reports TurboID has been used in C. elegans, this is the first report of a systematic analysis of tissue-specific differential proteomics.
(2) Authors found five mutants that have abnormality in the salt learning. These genes have not been described to have the abnormality, providing novel knowledge to the readers, especially those who work on C. elegans behavioural plasticity. Especially, involvement of acetylcholine neurotransmission has not been addressed before. Although transgenic rescue experiments have not been performed except kin-2, and the site of action (neurons involved) has not been tested in this manuscript, it will open the venue to further determine the way in which acetylcholine receptors, cAMP pathway etc. influences the learning process.
-
Author response:
General Statements
We thank the reviewers for providing us the opportunity to revise our manuscript titled “Identifying regulators of associative learning using a protein-labelling approach in C. elegans.” We appreciate the insightful feedback that we received to improve this work. In response, we have extensively revised the manuscript with the following changes: we have (1) clarified the criteria used for selecting candidate genes for behavioural testing, presenting additional data from ‘strong’ hits identified in multiple biological replicates (now testing 26 candidates, previously 17), (2) expanded our discussion of the functional relevance of validated hits, including providing new tissue-specific and neuron class-specific analyses, and (3) improved the presentation of our data, including visualising networks …
Author response:
General Statements
We thank the reviewers for providing us the opportunity to revise our manuscript titled “Identifying regulators of associative learning using a protein-labelling approach in C. elegans.” We appreciate the insightful feedback that we received to improve this work. In response, we have extensively revised the manuscript with the following changes: we have (1) clarified the criteria used for selecting candidate genes for behavioural testing, presenting additional data from ‘strong’ hits identified in multiple biological replicates (now testing 26 candidates, previously 17), (2) expanded our discussion of the functional relevance of validated hits, including providing new tissue-specific and neuron class-specific analyses, and (3) improved the presentation of our data, including visualising networks identified in the ‘learning proteome’, to better highlight the significance of our findings. We also substantially revised the text to indicate our attempts to address limitations related to background noise in the proteomic data and outlined potential refinements for future studies. All revisions are clearly marked in the manuscript in red font. A detailed, point-by-point response to each comment is provided below.
Point-by-point description of the revisions:
Reviewer #1 (Evidence, reproducibility and clarity):
Summary:
Rahmani et al., utilize the TurboID method to characterize the global proteome changes in the worm's nervous system induced by a salt-based associative learning paradigm. Altogether, Rahmani et al., uncover 706 proteins that are tagged by the TurboID method specifically in samples extracted from worms that underwent the memory inducing protocol. Next, the authors conduct a gene enrichment analysis that implicates specific molecular pathways in saltassociative learning, such as MAP-kinase and cAMP-mediated pathways. The authors then screen a representative group of the hits from the proteome analysis. The authors find that mutants of candidate genes from the MAP-kinase pathway, namely dlk-1 and uev-3, do not affect the performance in the learning paradigm. Instead multiple acetylcholine signaling mutants significantly affected the performance in the associative memory assay, e.g., acc-1, acc-3, gar-1, and lgc-46. Finally, the authors demonstrate that the acetylcholine signaling mutants did not exhibit a phenotype in similar but different conditioning paradigms, such as aversive salt-conditioning or appetitive odor conditioning, suggesting their effect is specific to appetitive salt conditioning.
Major comments:
(1) The statistical approach and analysis of the behavior assay:
The authors use a 2-way ANOVA test which assumes normal distribution of the data. However, the chemotaxis index used in the study is bounded between -1 and 1, which prevents values near the boundaries to be normally distributed.
Since most of the control data in this assay in this study is very close to 1, it strongly suggests that the CI data is not normally distributed and therefore 2-way ANOVA is expected to give skewed results.
I am aware this is a common mistake and I also anticipate that most conclusions will still hold also under a more fitting statistical test.
We appreciate the point raised by Reviewer 1 and understand the importance of performing the correct statistical tests.
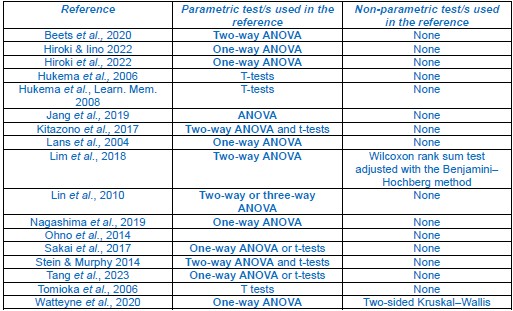
The statistical tests used in this study were chosen since parametric tests, particularly ANOVA tests to assess differences between multiple groups, are commonly used to assess behaviour in the C. elegans learning and memory field. Below is a summary of the tests used by studies that perform similar behavioural tests cited in this work, as examples:
Author response table 1.
A summary for the statistical tests performed by similar studies for chemotaxis assay data. References (listed in the leftmost column) were observed to (A) use parametric tests only or (B) performed either a parametric or non-parametric test on each chemotaxis assay dataset depending on whether the data passed a normality test. Listings for ANOVA tests are in bold to demonstrate their common use in the C. elegans learning and memory field.
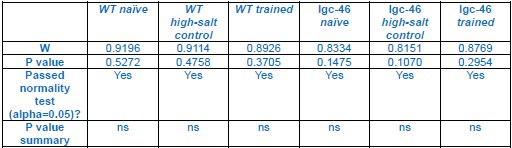
We note Reviewer 1's concern that this may stem from a common mistake. As stated, Two-way ANOVA generally relies on normally distributed data. We used GraphPad Prism to perform the Shapiro-Wilk normality test on our chemotaxis assay data as it is generally appropriate for sample sizes < 50 (α = 0.05), and found that most data passes this test including groups with skewed indices. For example, this is the data for Figure S8C:
Author response table 2.
Shapiro-Wilk normality test results for chemotaxis assay data in Figure S8C. Chemotaxis assay data was generated to assess salt associative learning capacity for wild-type (WT) versus lgc-46(-) mutant C. elegans. Three experimental groups were prepared for each C. elegans strain (naïve, high-salt control, and trained). From top-to-bottom, the data below displays the ‘W’ value, ‘P value’, a binary yes/no for whether the data passes the Shapiro-Wilk normality test, and a ‘P value summary’ (ns = nonsignificant). W values measure the similarity between a normal distribution and the chemotaxis assay data. Data is considered normal in the Shapiro-Wilk normality test when a W value is near 1.0 and the null hypothesis is not rejected (i.e., P value > 0.05).
The manuscript now includes the use of the Shapiro-Wilk normality test to assess chemotaxis assay data before using two-way ANOVA on page 51.
Nevertheless an appropriate statistical analysis should be performed. Since I assume the authors would wish to take into consideration both the different conditions and biological repeats, I can suggest two options:
- Using a Generalized linear mixed model, one can do with R software.
- Using a custom bootstrapping approach.
We thank Reviewer 1 for suggesting these two options. We carefully considered both approaches and consulted with the in-house statistician at our institution (Dr Pawel Skuza, Flinders University) for expert advice to guide our decision. In summary:
(1) Generalised linear mixed models: Generalised linear mixed models (GLMMs) are generally most appropriate for nested/hierarchal data. However, our chemotaxis assay data does not exhibit such nesting. Each biological replicate (N) consists of three technical replicates, which are averaged to yield a single chemotaxis index per N. Our statistical comparisons are based solely on these averaged values across experimental groups, making GLMMs less applicable in this context.
(2) Bootstrapping: Based on advice from our statistician, while bootstrapping can be a powerful tool, its effectiveness is limited when applied to datasets with a low number of biological replicates (N). Bootstrapping relies on resampling existing data to simulate additional observations, which may artificially inflate statistical power and potentially suggest significance where the biological effect size is minimal or not meaningful. Increasing the number of biological replicates to accommodate bootstrapping could introduce additional variability and compromise the interpretability of the results.
The total number of assays, especially controls, varies quite a bit between the tested mutants. For example compare the acc-1 experiment in Figure 4.A., and gap-1 or rho-1 in Figure S4.A and D. It is hard to know the exact N of the controls, but I assume that for example, lowering the wild type control of acc-1 to equivalent to gap-1 would have made it non significant. Perhaps the best approach would be to conduct a power analysis, to know what N should be acquired for all samples.
We thoroughly evaluated performing the power analysis: however, this is typically performed with the assumption that an N = 1 represents a singular individual/person. An N =1 in this study is one biological replicate that includes hundreds of worms, which is why it is not typically employed in our field for this type of behavioural test.
Considering these factors, we have opted to continue using a two-way ANOVA for our statistical analysis. This choice aligns with recent publications that employ similar experimental designs and data structures. Crucially, we have verified that our data meet the assumptions of normality, addressing key concerns regarding the suitability of parametric testing. We believe this approach is sufficiently rigorous to support our main conclusions. This rationale is now outlined on page 51.
To be fully transparent, our aim is to present differences between wild-type and mutant strains that are clearly visible in the graphical data, such that the choice of statistical test does not become a limiting factor in interpreting biological relevance. We hope this rationale is understandable, and we sincerely appreciate the reviewer’s comment and the opportunity to clarify our analytical approach.
We hope that Reviewer 1 will appreciate these considerations as sufficient justification to retain the statistical tests used in the original manuscript. Nevertheless, to constructively address this comment, we have performed the following revisions:
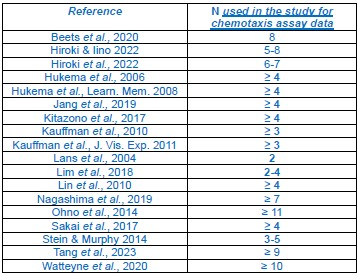
(1) Consistent number of biological replicates: We performed additional biological replicates of the learning assay to confirm the behavioural phenotypes for the key candidates described (KIN-2 , F46H5.3, ACC-1, ACC-3, LGC-46). We chose N = 5 since most studies cited in this paper that perform similar behavioural tests do the same (see Author response table 3 below).
Author response table 3.
A summary for sample sizes generated by similar studies for chemotaxis assay data. References (listed in the leftmost column) were observed to the sample sizes (N) below corresponding to biological replicates of chemotaxis assay data. N values are in bold when the study uses N ≤ 5.
(1) Grouped presentation of behavioural data: We now present all behavioural data by grouping genotypes tested within the same biological replicate, including wild-type controls, rather than combining genotypes tested separately. This ensures that each graph displays data from genotypes sharing the same N, also an important consideration for performing parametric tests. Accordingly, we re-performed statistical analyses using this reduced N for relevant graphs. As anticipated, this rendered some comparisons non-significant. All statistical comparisons are clearly indicated on each graph.
(2) Improved clarity of figure legends: We revised figure legends for Figures 5, 6, S7, S8, & S9 to make clear how many biological replicates have been performed for each genotype by adding N numbers for each genotype in all figures.
The authors use the phrasing "a non-significant trend", I find such claims uninterpretable and should be avoided. Examples: Page 16. Line 7 and Page 18, line 16.
This is an important point. While we were not able to find the specific phrasing "a non-significant trend" from this comment in the original manuscript, we acknowledge that referring to a phenotype as both a trend and non-significant may confuse readers, which was originally stated in the manuscript in two locations.
The main text has been revised on pages 27 & 28 when describing comparisons between trained groups between two C. elegans lines, by removing mentions of trends and retaining descriptions of non-significance.
(2) Neuron-specific analysis and rescue of mutants:
Throughout the study the authors avoid focusing on specific neurons. This is understandable as the authors aim at a systems biology approach, however, in my view this limits the impact of the study. I am aware that the proteome changes analyzed in this study were extracted from a pan neuronally expressed TurboID. Yet, neuron-specific changes may nevertheless be found. For example, running the protein lists from Table S2, in the Gene enrichment tool of wormbase, I found, across several biological replicates, enrichment for the NSM, CAN and RIG neurons. A more careful analysis may uncover specific neurons that take part in this associative memory paradigm. In addition, analysis of the overlap in expression of the final gene list in different neurons, comparing them, looking for overlap and connectivity, would also help to direct towards specific circuits.
This is an important and useful suggestion. We appreciate the benefit in exploring the data from this study from a neuron class-specific lens, in addition to the systems-level analyses already presented.
The WormBase gene enrichment tool is indeed valuable for broad transcriptomic analyses (the findings from utilising this tool are now on page 16); however, its use of Anatomy Ontology (AO) terms also contains annotations from more abundant non-neuronal tissues in the worm. To strengthen our analysis and complement the Wormbase tool, we also used the CeNGEN database as suggested by Reviewer 3 Major Comment 1 (Taylor et al., 2021), which uses single cell RNA-Seq data to profile gene expression across the C. elegans nervous system. We input our learning proteome data into CeNGEN as a systemic analysis, identifying neurons highly represented by the learning proteome (on pages 16-20). To do this, we specifically compared genes/proteins from high-salt control worms and trained worms to identify potential neurons that may be involved in this learning paradigm. Briefly, we found:
- WormBase gene enrichment tool: Enrichment for anatomy terms corresponding to specific interneurons (ADA, RIS, RIG), ventral nerve cord neurons, pharyngeal neurons (M1, M2, M5, I4), PVD sensory neurons, DD motor neurons, serotonergic NSM neurons, and CAN.
- CeNGEN analysis: Representation of neurons previously implicated in associative learning (e.g., AVK interneurons, RIS interneurons, salt-sensing neuron ASEL, CEP & ADE dopaminergic neurons, and AIB interneurons), as well as neurons not previously studied in this context (pharyngeal neurons I3 & I6, polymodal neuron IL1, motor neuron DA9, and interneuron DVC). Methods are detailed on pages 50 & 51.
These data are summarised in the revised manuscript as Table S7 & Figure 4.
To further address the reviewer’s suggestion, we examined the overlap in expression patterns of the validated learning-associated genes acc-1, acc-3, lgc-46, kin-2, and F46H5.3 across the neuron classes above, using the CeNGEN database. This was done to explore potential neuron classes in which these regulators may act in to regulate learning. This analysis revealed both shared and distinct expression profiles, suggesting potential functional connectivity or co-regulation among subsets of neurons. To summarise, we found:
- All five learning regulators are expressed in RIM interneurons and DB motor neurons.
- KIN-2 and F46H5.3 share the same neuron expression profile and are present in many neurons, so they may play a general function within the nervous system to facilitate learning.
- ACC-3 is expressed in three sensory neuron classes (ASE, CEP, & IL1).
- In contrast, ACC-1 and LGC-46 are expressed in neuron classes (in brackets) implicated in gustatory or olfactory learning paradigms (AIB, AVK, NSM, RIG, & RIS) (Beets et al., 2012, Fadda et al., 2020, Wang et al., 2025, Zhou et al., 2023, Sato et al., 021), neurons important for backward or forward locomotion (AVE, DA, DB, & VB) (Chalfie et al., 1985), and neuron classes for which their function is yet detailed in the literature (ADA, I4, M1, M2, & M5).
These neurons form a potential neural circuit that may underlie this form of behavioural plasticity, which we now describe in the main text on pages 16-20 & 34-35 and summarise in Figure 4.
OPTIONAL: A rescue of the phenotype of the mutants by re-expression of the gene is missing, this makes sure to avoid false-positive results coming from background mutations. For example, a pan neuronal or endogenous promoter rescue would help the authors to substantiate their claims, this can be done for the most promising genes. The ideal experiment would be a neuron-specific rescue but this can be saved for future works.
We appreciate this suggestion and recognise its potential to strengthen our manuscript. In response, we made many attempts to generate pan-neuronal and endogenous promoter reexpression lines. However, we faced several technical issues in transgenic line generation, including poor survival following microinjection likely due to protein overexpression toxicity (e.g., C30G12.6, F46H5.3), and reduced animal viability for chemotaxis assays, potentially linked to transgene-related reproductive defects (e.g., ACC-1). As we have previously successfully generated dozens of transgenic lines in past work (e.g. Chew et al., Neuron 2018; Chew et al., Phil Trans B 2018; Gadenne/Chew et al., Life Science Alliance 2022), we believe the failure to produce most of these lines is not likely due to technical limitations. For transparency, these observations have been included in the discussion section of the manuscript on pages 39 & 40 as considerations for future troubleshooting.
Fortunately, we were able to generate a pan-neuronal promoter line for KIN-2 that has been tested and included in the revised manuscript. This new data is shown in Figure 5B and described on pages 23 & 24. Briefly, this shows that pan-neuronal expression of KIN-2 from the ce179 mutant allele is sufficient to reproduce the enhanced learning phenotype observed in kin2(ce179) animals, confirming the role of KIN-2 in gustatory learning.
To address the potential involvement of background mutations (also indicated by Reviewer 4 under ‘cross-commenting’), we have also performed experiments with backcrossed versions of several mutants. These experiments aimed to confirm that salt associative learning phenotypes are due to the expected mutation. Namely, we assessed kin-2(ce179) mutants that had been backcrossed previously by another laboratory, as well as C30G12.6(-) and F46H5.3(-) animals backcrossed in this study. Although not all backcrossed mutants retained their original phenotype (i.e., C30G12.6) (Figure 6D, a newly added figure), we found that backcrossed versions of KIN-2 and F46H5.3 both robustly showed enhanced learning (Figures 5A & 6B).
This is described in the text on pages 23-26.
Minor comments:
(1) Lack of clarity regarding the validation of the biotin tagging of the proteome.
The authors show in Figure 1 that they validated that the combination of the transgene and biotin allows them to find more biotin-tagged proteins. However there is significant biotin background also in control samples as is common for this method. The authors mention they validated biotin tagging of all their experiments, but it was unclear in the text whether they validated it in comparison to no-biotin controls, and checked for the fold change difference.
This is an important point: We validated our biotin tagging method prior to mass spectrometry by comparing ‘no biotin’ and ‘biotin’ groups. This is shown in Figure S1 in the revised manuscript, which includes a western blot comparing untreated and biotin treated animals that are nontransgenic or expressing TurboID. As expected, by comparing biotinylated protein signal for untreated and treated lanes within each line, biotin treatment increased the signal 1.30-fold for non-transgenic and 1.70-fold for TurboID C. elegans. This is described on page 8 of the revised manuscript.
To clarify, for mass spectrometry experiments, we tested a no-TurboID (non-transgenic) control, but did not perform a no-biotin control. We included the following four groups: (1) No-TurboID ‘control’ (2) No-TurboID ‘trained’, (3) pan-neuronal TurboID ‘control’ and (4) pan-neuronal TurboID ‘trained’, where trained versus control refers to whether ‘no salt’ was used as the conditioned stimulus or not, respectively (illustrated in Figure 1A). Due to the complexity of the learning assay (which involves multiple washes and handling steps, including a critical step where biotin is added during the conditioning period), and the need to collect sufficient numbers of worms for protein extraction (>3,000 worms per experimental group), adding ‘no-biotin’ controls would have doubled the number of experimental groups, which we considered unfeasible for practical reasons. This is explained on pages 8 & 9 of the revised manuscript.
Also, it was unclear which exact samples were tested per replicate. In Page 9, Lines 17-18: "For all replicates, we determined that biotinylated proteins could be observed ...", But in Page 8, Line 24 : "We then isolated proteins from ... worms per group for both 'control' and 'trained' groups,... some of which were probed via western blotting to confirm the presence of biotinylated proteins".
Could the authors specify which samples were verified and clarify how?
Thank you for pointing out these unclear statements: We have clarified the experimental groups used for mass spectrometry experiments as detailed in the response above on pages 8 & 9. In addition, western blots corresponding to each biological replicate of mass spectrometry data described in the main text on page 10 and have been added to the revised manuscript (as Figure S3). These western blots compare biotinylation signal for proteins extracted from (1) NoTurboID ‘control’ (2) No-TurboID ‘trained’, (3) pan-neuronal TurboID ‘control’ and (4) panneuronal TurboID ‘trained’. These blots function to confirm that there were biotinylated proteins in TurboID samples, before enrichment by streptavidin-mediated pull-down for mass spectrometry.
OPTIONAL: include the fold changes of biotinylated proteins of all the ones that were tested. Similar to Figure 1.C.
This is an excellent suggestion. As recommended by the reviewer, we have included foldchanges for biotinylated protein levels between high-salt control and trained groups (on pages 9 & 10 for replicate #1 and in Table S2 for replicates #2-5). This was done by measuring protein levels in whole lanes for each experimental group per biological replicate within western blots (Figure 1C for replicate #1 and Figure S3 for replicates #2-5) of protein samples generated for mass spectrometry (N = 5).
(2) Figure 2 does not add much to the reader, it can be summarized in the text, as the fraction of proteins enriched for specific cellular compartments.
I would suggest to remove Figure 2 (originally written as figure 3) to text, or transfer it to the supplementry material.
As noted in cross-comment response to Reviewer 4, there were typos in the original figure references, we have corrected them above. Essentially, this comment is referring to Figure 2.
We appreciate this feedback from Reviewer 1. We agree that the original Figure 2 functions as a visual summary from analysis of the learning proteome at the subcellular compartment level. However, it also serves to highlight the following:
- Representation for neuron-specific GO terms is relatively low, but even this small percentage represents entire protein-protein networks that are biologically meaningful, but that are difficult to adequately describe in the main text.
- TurboID was expressed in neurons so this figure supports the relevance of the identified proteome to biological learning mechanisms.
- Many of these candidates could not be assessed by learning assay using single mutants since related mutations are lethal or substantially affect locomotion. These networks therefore highlight the benefit in using strategies like TurboID to study learning.
We have chosen to retain this figure, moving it to the supplementary material as Figure S4 in the revised manuscript, as suggested.
OPTIONAL- I would suggest the authors to mark in a pathway summary figure similar to Figure 3 (originally written as Figure 4) the results from the behavior assay of the genetic screen. This would allow the reader to better get the bigger picture and to connect to the systemic approach taken in Figures 2 and 3.
We think this is a fantastic suggestion and thank Reviewer 1 for this input. In the revised manuscript, we have added Figure 7, which summarises the tested candidates that displayed an effect on learning, mapped onto potential molecular pathways derived from networks in the learning proteome. This figure provides a visual framework linking the behavioural outcomes to the network context. This is described in the main text on pages 32-33.
(3) Typo in Figure 3: the circle of PPM1: The blue right circle half is bigger than the left one.
We thank the Reviewer for noticing this, the node size for PPM-1.A has been corrected in what is now Figure 2 in the revised work.
(4) Unclarity in the discussions. In the discussion Page 24, Line 14, the authors raise this question: "why are the proteins we identified not general learning regulators?. The phrasing and logic of the argumentation of the possible answers was hard to follow. - Can you clarify?
We appreciate this feedback in terms of unclarity, as we strive to explain the data as clearly and transparently as possible. Our goal in this paragraph was to discuss why some candidates were seen to only affect salt associative learning, as opposed to showing effects in multiple learning paradigms (i.e., which we were defining as a ‘general learning regulator’). We have adjusted the wording in several places in this paragraph now on pages 36 & 37 to address this comment. We hope the rephrased paragraph provides sufficient rationalisation for the discussion regarding our selection strategy used to isolate our protein list of potential learning regulators, and its potential limitations.
Cross-Commenting
Firstly, we would like to express our appreciation for the opportunity for reviewers to crosscomment on feedback from other reviewers. We believe this is an excellent feature of the peer review process, and we are grateful to the reviewers for their thoughtful engagement and collaborative input.
I would like to thank Reviewer #4 for the great cross comment summary, I find it accurate and helpful.
I also would like to thank Reviewer #4 for spotting the typos in my minor comments, their page and figure numbers are the correct ones.
We have corrected these typos in the relevant comments, and have responded to them accordingly.
Small comment on common point 1 - My feeling is that it is challanging to do quantitative mass spectrometry, especially with TurboID. In general, the nature of MS data is that it hints towards a direction but a followup validation work is required in order to assess it. For example, I am not surprised that the fraction of repeats a hit appeared in does not predict well whether this hit would be validated behavioraly. Given these limitations, I find the authors' approach reasonable.
We thank Reviewer 1 for this positive and thoughtful feedback. We also appreciate Reviewer 4’s comment regarding quantitative mass spectrometry and have addressed this in detail below (see response to Reviewer 4). However, we agree with Reviewer 1 that there are practical challenges to performing quantitative mass spectrometry with TurboID, primarily due to the enrichment for biotinylated proteins that is a key feature of the sample preparation process.
Importantly, we whole-heartedly agree with Reviewer 1’s statement that “In general, the nature of MS data is that it hints towards a direction but a follow-up validation work is required in order to assess it”. This is the core of our approach: however, we appreciate that there are limitations to a qualitative ‘absent/present’ approach. We have addressed some of these limitations by clarifying the criteria used for selecting candidate genes, based additionally on the presence of the candidate in multiple biological replicates (categorised as ‘strong’ hits). Based on this method, we were able to validate the role of several novel learning regulators (Figures 5, 6, & S7). We sincerely hope that this manuscript can function as a direction for future research, as suggested by this Reviewer.
I also would like to highlight this major comment from reviewer 4:
"In Experimental Procedures, authors state that they excluded data in which naive or control groups showed average CI < 0.6499, and/or trained groups showed average CI < -0.0499 or > .5499 for N2 (page 36, lines 5-7). "
This threshold seems arbitrary to me too, and it requires the clarifications requested by reviewer 4.
As detailed in our response to Reviewer 4, Major Comment 2, data were excluded only in rare cases, specifically when N2 worms failed to show strong salt attraction prior to training, or when trained N2 worms did not exhibit the expected behavioural difference compared to untrained controls – this can largely be attributed to clear contamination or over-population issues, which are visible prior to assessing CTX plates and counting chemotaxis indices.
These criteria were initially established to provide an objective threshold for excluding biological replicates, particularly when planning to assay a large number of genetic mutants. However, after extensive testing across many replicates, we found that N2 worms (that were not starved, or not contaminated) consistently displayed the expected phenotype, rendering these thresholds unnecessary. We acknowledge that emphasizing these criteria may have been misleading, and have therefore removed them from page 50 in the revised manuscript to avoid confusion and ensure clarity.
Reviewer #1 (Significance):
This study does a great job to effectively utilize the TurboID technique to identify new pathways implicated in salt-associative learning in C. elegans. This technique was used in C. elegans before, but not in this context. The salt-associative memory induced proteome list is a valuable resource that will help future studies on associative memory in worms. Some of the implicated molecular pathways were found before to be involved in memory in worms like cAMP, as correctly referenced in the manuscript. The implication of the acetylcholine pathway is novel for C. elgeans, to the best of my knowledge. The finding that the uncovered genes are specifically required for salt associative memory and not for other memory assays is also interesting.
However overall I find the impact of this study limited. The premise of this work is to use the Turbo-ID method to conduct a systems analysis of the proteomic changes. The work starts by conducting network analysis and gene enrichment which fit a systemic approach. However, since the authors find that ~30% of the tested hits affect the phenotype, and since only 17/706 proteins were assessed, it is challenging to draw conclusive broad systemic claims.
Alternatively, the authors could have focused on the positive hits, and understand them better, find the specific circuits where these genes act. This could have increased the impact of the work. Since neither of these two options are satisfied, I view this work as solid, but not wide in its impact and therefore estimate the audience of this study would be more specialized.
My expertise is in C. elegans behavior, genetics, and neuronal activity, programming and machine learning.
We thank the Reviewer for these comments and appreciate the recognition of the value of the proteomic dataset and the identification of novel molecular pathways, including the acetylcholine pathway, as well as the specificity of the uncovered genes to salt-associative memory. Regarding the reviewer’s concern about the overall impact and scope of the study, we respectfully offer the following clarification. Our aim was to establish a systems-level approach for investigating learning-related proteomic changes using TurboID, and we acknowledge that only a subset of the identified proteins was experimentally tested (now 26/706 proteins in the revised manuscript). Although only five of the tested single gene mutants showed a robust learning phenotype in the revised work (after backcrossing, more stringent candidate selection, improved statistical analysis in addressing reviewer comments), our proteomic data provides us a unique opportunity to define these candidates within protein-protein networks (as illustrated in Figure 7). Importantly, our functional testing focused on single-gene mutants, which may not reveal phenotypes for genes that act redundantly (now mentioned on pages 28-30). This limitation is inherent to many genetic screens and highlights the value of our proteomic dataset, which enables the identification of broader protein-protein interaction networks and molecular pathways potentially involved in learning.
To support this systems-level perspective, we have added Figure 7, which visually integrates the tested candidates into molecular pathways derived from the learning proteome for learning regulators KIN-2 and F46H5.3. We also emphasise more explicitly in the text (on pages 32-33) the value of our approach by highlighting the functional protein networks that can be derived from our proteomics dataset.
We fully acknowledge that the use of TurboID across all neurons limits the resolution needed to pinpoint individual neuron contributions, and understand the benefit in further experiments to explore specific circuits. Many circuits required for salt sensing and salt-based learning are highly explored in the literature and defined explicitly (see Rahmani & Chew, 2021), so our intention was to complement the existing literature by exploring the protein-protein networks involved in learning, rather than on neuron-neuron connectivity. However, we recognise the benefit in integrating circuit-level analyses, given that our proteomic data suggests hundreds of candidates potentially involved in learning. While validating each of these candidates is beyond the scope of the current study, we have taken steps to suggest candidate neurons/circuits by incorporating tissue enrichment analyses and single-cell transcriptomic data (Table S7 & Figure 4). These additions highlight neuron classes of interest and suggest possible circuits relevant to learning.
We hope this clarification helps convey the intended scope and contribution of our study. We also believe that the revisions made in response to Reviewer 1’s feedback have strengthened the manuscript and enhanced its significance within the field.
Reviewer #2 (Evidence, reproducibility and clarity):
Summary:
In this study by Rahmani in colleagues, the authors sought to define the "learning proteome" for a gustatory associative learning paradigm in C. elegans. Using a cytoplasmic TurboID expressed under the control of a pan-neuronal promoter, the authors labeled proteins during the training portion of the paradigm, followed by proteomics analysis. This approach revealed hundreds of proteins potentially involved in learning, which the authors describe using gene ontology and pathways analysis. The authors performed functional characterization of some of these genes for their requirement in learning using the same paradigm. They also compared the requirement for these genes across various learning paradigms, and found that most hits they characterized appear to be specifically required for the training paradigm used for generating the "learning proteome".
Major Comments:
(1) The definition of a "hit" from the TurboID approach is does not appear stringent enough. According to the manuscript, a hit was defined as one unique peptide detected in a single biological replicate (out of 5), which could give rise to false positives. In figure S2, it is clear that there relatively little overlap between samples with regards to proteins detected between replicates, and while perhaps unintentional, presenting a single unique peptide appears to be an attempt to inflate the number of hits. Defining hits as present in more than one sample would be more rigorous. Changing the definition of hits would only require the time to re-list genes and change data presented in the manuscript accordingly.
We thank Reviewer 2 for this valuable comment, and the following related suggestion. We agree with the statement that “Defining hits as present in more than one sample would be more rigorous”. Therefore, to address this comment, we have now separated candidates into two categories in Table 2 in the revised manuscript: ‘strong’ (present in 3 or more biological replicates) and ‘weak’ candidates (present in 2 or fewer biological replicates). However, we think these weaker candidates should still be included in the manuscript, considering we did observe relationships between these proteins and learning. For example, ACC-1, which influences salt associative learning in C. elegans, was detected in one replicate of mass spectrometry as a potential learning regulator (Figure S8A). We describe this classification in the main text on pages 21-22.
We also agree with Reviewer 2 that the overlap between individual candidate hits is low between biological replicates; the inclusion of Figure S2 in the original manuscript serves to highlight this limitation. However, it is also important to consider that there is notable overlap for whole molecular pathways between biological replicates of mass spectrometry data as shown in Figure 2 in the revised manuscript (this consideration is now mentioned on pages 13-14). We have included Figure 3 to illustrate representation for two metabolic processes across several biological replicates normally indispensable to animal health, as an example to provide additional visual aid for the overlap between replicates of mass spectrometry. We provide this figure (described on pages 13 & 15) to demonstrate the strength of our approach in that it can detect candidates not easily assessable by conventional forward or reverse genetic screens.
We also appreciate the opportunity to explain our approach. The criteria of “at least one unique peptide” was chosen based on a previous work for which we adapted for this manuscript (Prikas et al., 2020). It was not intended to inflate the number of hits but rather to ensure sensitivity in detecting low-abundance neuronal proteins. We have clarified this in our Methods (page 46).
(2) The "hits" that the authors chose to functionally characterize do not seem like strong candidate hits based on the proteomics data that they generated. Indeed, most of the hits are present in a single, or at most 2, biological replicate. It is unclear as to why the strongest hits were not characterized, which if mutant strains are publicly available, would not be a difficult experiment to perform.
We thank the reviewer for this important suggestion. To address this, we have described two molecular pathways with multiple components that appear in more than one biological replicate of mass spectrometry data in Figure 3 (main text on page 13). In addition, we have included Figures 6 & S7 where 9 additional single mutants corresponding to candidates in three or more biological replicates of mass spectrometry were tested for salt associative learning. Briefly, we found the following (number of replicates that a protein was unique to TurboID trained animals is in brackets):
- Novel arginine kinase F46H5.3 (4 replicates) displays an effect in both salt associative learning and salt aversive learning in the same direction (Figures 6A, 6B, & S9A, pages 31-32 & 37-38).
- Worms with a mutation for armadillo-domain protein C30G12.6 (3 replicates) only displayed an enhanced learning phenotype when non-backcrossed, not backcrossed. This suggests the enhanced learning phenotype was caused by a background mutation (Figure 6, pages 24-25).
- We did not observe an effect on salt associative learning when assessing mutations for the ciliogenesis protein IFT-139 (5 replicates), guanyl nucleotide factors AEX-3 or TAG52 (3 replicates), p38/MAPK pathway interactor FSN-1 (3 replicates), IGCAM/RIG-4 (3 replicates), and acetylcholine components ACR-2 (4 replicates) and ELP-1 (3 replicates) (Figure S7, on pages 27-30). However, we note throughout the section for which these candidates are described that only single gene mutants were tested, meaning that genes that function in redundant or compensatory pathways may not exhibit a detectable phenotype.
Because of the lack of strong evidence that these are indeed proteins regulated in the context of learning based on proteomics, including evidence of changes in the proteins (by imaging expression changes of fluorescent reporters or a biochemical approach), would increase confidence that these hits are genuine.
We thank Reviewer 2 for this suggestion – we agree that it would have been ideal to have additional evidence suggesting that changes in candidate protein levels are associated directly with learning. Ideally, we would have explored this aspect further; however, as outlined in response to Reviewer 1 Major Comment 2 (OPTIONAL), this was not feasible within the scope of the current study due to several practical challenges. Specifically, we attempted to generate pan-neuronal and endogenous promoter rescue lines for several candidates, but encountered significant challenges, including poor survival post-microinjection (likely due to protein overexpression toxicity) and reduced viability for behavioural assays, potentially linked to transgene-related reproductive defects. This information is now described on pages 39 & 40 of the revised work.
To address these limitations, we performed additional behavioural experiments where possible. We successfully generated a pan-neuronal promoter line for kin-2, which was tested and included in the revised manuscript (Figure 5B, pages 30 & 31). In addition, to confirm that observed learning phenotypes were due to the expected mutations and not background effects, we conducted experiments using backcrossed versions of several mutant lines as suggested by Reviewer 4 Cross Comment 3 (Figure 6, pages 23-24 & 24-26). Briefly, this shows that panneuronal expression of KIN-2 from the ce179 mutant allele is sufficient to repeat the enhanced learning phenotype observed in backcrossed kin-2(ce179) animals, providing additional evidence that the identified hits are required for learning. We also confirmed that F46H5.3 modulates salt associative learning, given both non-backcrossed and backcrossed F46H5.3(-) mutants display a learning enhancement phenotype. The revised text now describes this data on the page numbers mentioned above.
Minor Comments:
(1) The authors highlight that the proteins they discover seem to function uniquely in their gustatory associative paradigm, but this is not completely accurate. kin-2, which they characterize in figure 4, is required for positive butanone association (the authors even say as much in the manuscript) in Stein and Murphy, 2014.
We appreciate this correction and thank the Reviewer for pointing this out. We have amended the wording appropriately on page 31 to clarify our meaning.
“Although kin-2(ce179) mutants were not shown to impact salt aversive learning, they have been reported previously to display impaired intermediate-term memory (but intact learning and short-term memory) for butanone appetitive learning (Stein and Murphy, 2014).”
Reviewer #2 (Significance):
General Assessment:
The approach used in this study is interesting and has the potential to further our knowledge about the molecular mechanisms of associative behaviors. Strengths of the study include the design with carefully thought out controls, and the premise of combining their proteomics with behavioral analysis to better understand the biological significance of their proteomics findings. However, the criteria for defining hits and prioritization of hits for behavioral characterizations were major wweaknesses of the paper.
Advance:
There have been multiple transcriptomic studies in the worm looking at gene expression changes in the context of behavioral training (Lakhina et al., 2015, Freytag 2017). This study compliments and extends those studies, by examining how the proteome changes in a different training paradigm. This approach here could be employed for multiple different training paradigms, presenting a new technical advance for the field.
Audience:
This paper would be of interest to the broader field of behavioral and molecular neuroscience. Though it uses an invertebrate system, many findings in the worm regarding learning and memory translate to higher organisms.
I am an expert in molecular and behavioral neuroscience in both vertebrate and invertebrate models, with experience in genetics and genomics approaches.
We appreciate Reviewer 2’s thoughtful assessment and constructive feedback. In response to concerns regarding definition and prioritisation of hits, we have revised our approach as detailed above to place more consideration on ‘strong’ hits present in multiple biological replicates. We have also added new behavioural data for additional mutants that fall into this category (Figures 6 & S7). We hope these revisions strengthen our study and enhance its relevance to the behavioural/molecular neuroscience community.
Reviewer #3 (Evidence, reproducibility and clarity):
Summary:
In the manuscript titled "Identifying regulators of associative learning using a protein-labelling approach in C. elegans" the authors attempted to generate a snapshot of the proteomic changes that happen in the C. elegans nervous system during learning and memory formation. They employed the TurboID-based protein labeling method to identify the proteins that are uniquely found in samples that underwent training to associate no-salt with food, and consequently exhibited lower attraction to high salt in a chemotaxis assay. Using this system they obtained a list of target proteins that included proteins represented in molecular pathways previously implicated in associative learning. The authors then further validated some of the hits from the assay by testing single gene mutants for effects on learning and memory formation.
Major Comments:
In the discussion section, the authors comment on the sources of "background noise" in their data and ways to improve the specificity. They provide some analysis on this aspect in Supplementary figure S2. However, a better visualization of non-specificity in the sample could be a GO analysis of tissue-specificity, and presented as a pie chart as in Figure 2A. Nonneuronal proteins such as MYO-2 or MYO-3 repeatedly show up on the "TurboID trained" lists in several biological replicates (Tables S2 and S3). If a major fraction of the proteins after subtraction of control lists are non-specific, that increases the likelihood that the "hits" observed are by chance. This analysis should be presented in one of the main figures as it is essential for the reader to gauge the reliability of the experiment.
We agree with this assessment and thank Reviewer 3 for this constructive suggestion. In response, we have now incorporated a comprehensive tissue-specific analysis of the learning proteome in the revised manuscript. Using the single neuron RNA-Seq database CeNGEN, we identified the proportion of neuronal vs non-neuronal proteins from each biological replicate of mass spectrometry data. Specifically, we present Table 1 on page 17 (which we originally intended to include in the manuscript, but inadvertently left out), which shows that 87-95% (i.e. a large majority) of proteins identified across replicates corresponded to genes detected in neurons, supporting that the TurboID enzyme was able to target the neuronal proteome as expected. Table 1 is now described in the main text of the revised work on page 16.
In addition, we performed neuron-specific analyses using both the WormBase gene enrichment tool and the CeNGEN single-cell transcriptomic database, which we describe in detail on our response to Reviewer 1 Major Comment 2. To summarise, these analyses revealed enrichment of several neuron classes, including those previously implicated in associative learning (e.g., ASEL, AIB, RIS, AVK) as well as neurons not previously studied in this context (e.g., IL1, DA9, DVC) (summarised in Table S7). By examining expression overlap across neuron types, we identified shared and distinct profiles that suggest potential functional connectivity and candidate circuits underlying behavioural plasticity (Figure 4). Taken together, these data show that the proteins identified in our dataset are (1) neuronal and (2) expressed in neurons that are known to be required for learning. Methods are detailed on pages 50-51.
Other than the above, the authors have provided sufficient details in their experimental and analysis procedures. They have performed appropriate controls, and their data has sufficient biological and technical replaictes for statistical analysis.
We appreciate this positive feedback and thank the Reviewer for acknowledging the clarity of our experimental and analysis procedures.
Minor Comments:
There is an error in the first paragraph of the discussion, in the sentences discussing the learning effects in gar-1 mutant worms. The sentences in lines 12-16 on page 22 says that gar-1 mutants have improved salt-associative learning and defective salt-aversive learning, while in fact the data and figures state the opposite.
We appreciate the Reviewer noting this discrepancy. As clarified in our response to Reviewer 1, Major Comment 1 above, we reanalysed the behavioural data to ensure consistency across genotypes by comparing only those tested within the same biological replicates (thus having the same N for all genotypes). Upon this reanalysis, we found that the previously reported phenotype for gar-1 mutants in salt-associative learning was not statistically different from wildtype controls. Therefore, we have removed references to GAR-1 from the manuscript.
Reviewer #3 (Significance):
Strengths and limitations:
This study used neuron-specific TurboID expression with transient biotin exposure to capture a temporally restricted snapshot of the C. elegans nervous system proteome during saltassociative learning. This is an elegant method to identify proteins temporally specific to a certain condition. However, there are several limitations in the way the experiments and analyses were performed which affect the reliability of the data. As the authors themselves have noted in the discussion, background noise is a major issue and several steps could be taken to improve the noise at the experimental or analysis steps (use of integrated C. elegans lines to ensure uniformity of samples, flow cytometry to isolate neurons, quantitative mass spec to detect fold change vs. strict presence/absence).
Advance:
Several studies have demonstrated the use of proximity labeling to map the interactome by using a bait protein fusion. In fact, expressing TurboID not fused to a bait protein is often used as a negative control in proximity labeling experiments. However, this study demonstrates the use of free TurboID molecules to acquire a global snapshot of the proteome under a given condition.
Audience:
Even with the significant limitations, this study is specifically of interest to researchers interested in understanding learning and memory formation. Broadly, the methods used in this study could be modified to gain insights into the proteomic profiles at other transient developmental stages. The reviewer's field of expertise: Cell biology of C. elegans neurons.
We thank the reviewer for their thoughtful evaluation of our work. We appreciate the recognition of the novelty and potential of using neuron-specific TurboID to capture a temporally restricted snapshot of the C. elegans nervous system proteome during learning. We agree that this approach offers a unique opportunity to identify proteins associated with specific behavioural states in future studies.
We also appreciate the reviewer’s comments regarding limitations in experimental and analytical design. In revising the manuscript, we have taken several steps to address these concerns and improve the clarity, rigour, and interpretability of our data. Specifically:
- We now provide a frequency-based representation of proteomic hits (Table 2), which helps clarify how candidate proteins were selected and highlights differences between trained and control groups.
- We have added neuron-specific enrichment analyses using both WormBase and CenGEN databases (Table S7 & Figure 4), which help identify candidate neurons and potential circuits involved in learning (methods on pages 50-51).
- We have clarified the rationale for using qualitative proteomics in the context of TurboID, in addition to acknowledging the challenges of integrating quantitative mass spectrometry with biotin-based enrichment (page 39). Additional methods for improving sample purity, such as using integrated lines or FACS-enrichment of neurons, could further refine this approach in future studies. For transparency, we did attempt to integrate the TurboID transgenic line to improve the strength and consistency of biotinylation signals. However, despite four rounds of backcrossing, this line exhibited unexpected phenotypes, including a failure to respond reliably to the established training protocol. As a result, we were unable to include it in the current study. Nonetheless, we believe our current approach provides a valuable proof-of-concept and lays the groundwork for future refinement.
By addressing the major concerns of peer reviewers, we believe our study makes a significant and impactful contribution by demonstrating the feasibility of using TurboID to capture learninginduced proteomic changes in the nervous system. The identification of novel learning-related mutants, including those involved in acetylcholine signalling and cAMP pathways, provides new directions for future research into the molecular and circuit-level mechanisms of behavioural plasticity.
Reviewer #4 (Evidence, reproducibility and clarity):
Summary:
In this manuscript, authors used a learning paradigm in C. elegans; when worms were fed in a saltless plate, its chemotaxis to salt is greatly reduced. To identify learning-related proteins, authors employed nervous system-specific transcriptome analysis to compare whole proteins in neurons between high-salt-fed animals and saltless-fed animals. Authors identified "learningspecific genes" which are observed only after saltless feeding. They categorized these proteins by GO analyses and pathway analyses, and further stepped forward to test mutants in selected genes identified by the proteome analysis. They find several mutants that are defective or hyper-proficient for learning, including acc-1/3 and lgc-46 acetylcholine receptors, gar-1 acetylcholine receptor GPCR, glna-3 glutaminase involved in glutamate biosynthesis, and kin-2, a cAMP pathway gene. These mutants were not previously reported to have abnormality in the learning paradigm.
Major comments:
(1) There are problems in the data processing and presentation of the proteomics data in the current manuscript which deteriorates the utility of the data. First, as the authors discuss (page 24, lines 5-12), the current approach does not consider amount of the peptides. Authors state that their current approach is "conservative", because some of the proteins may be present in both control and learned samples but in different amounts. This reviewer has a concern in the opposite way: some of the identified proteins may be pseudo-positive artifacts caused by the analytical noise. The problem is that authors included peptides that are "present" in "TurboID, trained" sample but "absent" in the "Non-Tg, trained" and "TurboID, control" samples in any one of the biological replicates, to identify "learning proteome" (706 proteins, page 8, last line - page 9, line 8; page 32, line 21-22). The word "present" implies that they included even peptides whose amounts are just above the detection threshold, which is subject to random noise caused by the detector or during sample collection and preparation processes. This consideration is partly supported by the fact that only a small fraction of the proteins are common between biological replicates (honestly and respectably shown in Figure S2). Because of this problem, there is no statistical estimate of the identity in "learning proteome" in the current manuscript. Therefore, the presentation style in Tables S2 and S3 are not very useful for readers, especially because authors already subtracted proteins identified in Non-Tg samples, which must also suffer from stochastic noise. I suggest either quantifying the MS/MS signal, or if authors need to stick to the "present"/"absent" description of the MS/MS data, use the number of appearances in biological replicates of each protein as estimate of the quantity of each protein. For example, found in 2 replicates in "TurboID, learned" and in 0 replicates in "Non-Tg, trained". One can apply statistics to these counts. This said, I would like to stress that proteins related to acquisition of memory may be very rare, especially because learning-related changes likely occur in a small subset of neurons. Therefore, 1 time vs 0 time may be still important, as well as something like 5 times vs 1 time. In summary, quantitative description of the proteomics results is desired.
We thank the reviewer for these valuable comments and suggestions.
We acknowledge that quantitative proteomics would provide beneficial information; however, as also indicated by Reviewer 1 (in cross-comment), it is practically challenging to perform with TurboID. We have included discussion of potential future experiments involving quantitative mass spectrometry, as well as a comprehensive discussion of some of the limitations of our approach as summarised by this Reviewer, in the Discussion section (page 39). However, we note that our qualitative approach also provides beneficial knowledge, such as the identification of functional protein networks acting within biological pathways previously implicated in learning (Figure 2), and novel learning regulators ACC-1/3, LGC-46, and F46H5.3.
We agree with the assessment that the frequency of occurrence for each candidate we test per biological replicate is useful to disclose in the manuscript as a proxy for quantification. This was also highlighted by Reviewer 2 (Major Comment 1). As detailed above in response to R2, we have now separated candidates into two categories: ‘strong’ (present in 3 or more biological replicates) and ‘weak’ candidates (present in 2 or fewer biological replicates). We have also added behavioural data after testing 9 of these strong candidates in Figures 6 & S7.
We have also added Table 2 to the revised manuscript, which summarises the frequency-based representation of the proteomics results, as suggested. This is described on pages 22-23.
Briefly, this shows the range of candidates further explored using single mutant testing. Specifically, this data showed that many of the tested candidates were more frequently detected in trained worms compared to high-salt controls. This includes both strong and weak candidates, providing a clearer view of how proteomic frequency informed our selection for functional testing.
(2) There is another problem in the treatment of the behavioural data. In Experimental Procedures, authors state that they excluded data in which naive or control groups showed average CI < 0.6499, and/or trained groups showed average CI < -0.0499 or > 0.5499 for N2 (page 36, lines 5-7). How were these values determined? One common example for judging a data point as an outlier is > mean + 1.5, 2 or 3 SD, or < mean - 1.5, 2 or 3 SD. Are these values any of these standards, or determined through other methods? If these values were determined simply by authors' decision, it could potentially introduce a bias and in the worst cases lead to incorrect conclusions. A related question is, authors state "trained animals showed a lower CI (~0.3)" where in the referred Figure 1B, the corresponding data shows averages close to 0. Why is the inconsistency? The assay that authors use is close to those described in the previous literature (Kunitomo et al., http://dx.doi.org/10.1038/ncomms3210). In this previous paper, it was described that animals conditioned under no salt with food show negative CI and are attracted to the low salt concentration area. Quantitative analysis of behavioural patterns showed migration bias towards lower salt concentrations (negative chemotaxis). Essentially the same concept was reported by Luo et al. (http://dx.doi.org/10.1016/j.neuron.2014.05.010). The experimental procedure employed in the current work is very similar with those by the Japanese group, with a notable difference: the chemotaxis assay plate included 50mM NaCl in Kunitomo et al, while authors used chemotaxis plate without added NaCl (p35, line 18). The latter is expected to cause shallow gradient towards the low-salt area, which may be the reason for the weak negative CI in the trained animals. In any case, the value of CI itself is not a problem, and authors' current assay is valid. The only concern of mine is the potential of author-introduced cognitive bias, possibly affecting, for example, whether a certain mutant has a significant defect or not. What happens if the cut-offs of -0.0499 and 0.5499 are omitted and all data were included in the analyses? What are the average CIs of N2 in all performed experiments for each of naive, control and trained groups?
Thank you for pointing this out. As mentioned by both Reviewer 1 and Reviewer 4, the original manuscript states the following: “Data was excluded for salt associative learning experiments when wild-type N2 displayed (1) an average CI ≤ 0.6499 for naïve or control groups and/or (2) an average CI either < -0.0499 or >0.5499 for trained groups.”
To clarify, we only excluded experiments in rare cases where N2 worms did not display robust high salt attraction before training, or where trained N2 did not display the expected behavioural difference compared to untrained or high-salt control N2. These anomalies were typically attributable to clear contamination or starvation issues that could clearly be observed prior to counting chemotaxis indices on CTX plates.
We established these exclusion criteria in advance of conducting multiple learning assays to ensure an objective threshold for identifying and excluding assays affected by these rare but observable issues. However, these criteria were later found to be unnecessary, as N2 worms robustly displayed the expected untrained and trained phenotypes for salt associative learning when not compromised by starvation or contamination.
We understand that the original criteria may have appeared to introduce arbitrary bias in data selection. To address this concern, we have removed these criteria from the revised manuscript from page 50.
Minor comments:
(1) Related to Major comments 1), the successful effect of neuron-specific TurboID procedure was not evaluated. Authors obtained both TurboID and Non-Tg proteome data. Do they see enrichment of neuron-specific proteins? This can be easily tested, for example by using the list of neuron-specific genes by Kaletsky et al. (http://dx.doi.org/10.1038/nature16483 or http://dx.doi.org/10.1371/journal.pgen.1007559), or referring to the CenGEN data.
We thank this Reviewer for this helpful suggestion, which was echoed by Reviewer 3 (Major Comment 1). As indicated in the response to R3 above, the revised manuscript now includes Table 1 as a tissue-specific analysis of the learning proteome, using the single neuron RNASeq database CeNGEN to identify the proportion of neuronal proteins from each biological replicate of mass spectrometry data. Generally, we observed a range of 87-95% of proteins corresponded to genes from the CeNGEN database that had been detected in neurons, providing evidence that the TurboID enzyme was able to target the neuronal proteome as expected. Table 1 is now described in the main text of the revised work on pages 16 & 17.
(2) The behavioural paradigm needs to be described accurately. Page 5, line 16-17, "C. elegans normally have a mild attraction towards higher salt concentration": in fact, C. elegans raised on NGM plates, which include approximately 50mM of NaCl, is attracted to around 50mM of NaCl (Kunitomo et al., Luo et al.) but not 100-200 mM.
We thank the Reviewer for pointing this out. We agree that clarification is necessary. The revised text reads as follows on page 5: “C. elegans are typically grown in the presence of salt (usually ~ 50 mM) and display an attraction toward this concentration when assayed for chemotaxis behaviour on a salt gradient (Kunitomo et al., 2013, Luo et al., 2014).
Training/conditioning with ‘no salt + food’ partially attenuates this attraction (group referred to ‘trained’).”
Authors call this assay "salt associative learning", which refers to the fact that worms associate salt concentration (CS) and either presence or absence of food (appetitive or aversive US) during conditioning (Kunitomo et al., Luo et al., Nagashima et al.) but they are looking at only association with presence of food, and for proteome analysis they only change the CS (NaCl concentration, as discussed in Discussion, p24, lines 4-5). It is better to attempt to avoid confusion to the readers in general.
Thank you Reviewer 4 for highlighting this clarity issue. We clarify our definition of “salt associative learning” for the purpose of this study in the revised manuscript on page 6 with the following text:
“Similar behavioural paradigms involving pairings between salt/no salt and food/no food have been previously described in the literature (Nagashima et al. 2019). Here, learning experiments were performed by conditioning worms with either ‘no salt + food’ (referred to as ‘salt associative learning’) or ‘salt + no food’ (called ‘salt aversive learning’).”
(3) page 32, line 23: the wording "excluding" is obscure and misleading because the elo-6 gene was included in the analysis.
We appreciate this Reviewer for pointing out this misleading comment, which was unintentional. We have now removed it from the text (on page 21).
(4) Typo at page 24, line 18: "that ACC-1" -> "than ACC-1".
This has been corrected (on page 37).
(5) Reference. In "LEO, T. H. T. et al.", given and sir names are flipped for all authors. Also, the paper has been formally published (http://dx.doi.org/10.1016/j.cub.2023.07.041).
We appreciate the Reviewer drawing our attention to this – the reference has been corrected and updated.
I would like to express my modest cross comments on the reviews:
(1) Many of the reviewers comment on the shortage in the quantitative nature of the proteome analysis, so it seems to be a consensus.
Thank you Reviewer 4 for this feedback. We appreciate the benefit in performing quantitative mass spectrometry, in that it provides an additional way to parse molecular mechanisms in a biological process (e.g., fold-changes in protein expression induced by learning). However, we note that quantitative mass spectrometry is challenging to integrate with TurboID due to the requirement to enrich for biotinylated peptides during sample processing (we now mention this on page 39). Nevertheless, it would be exciting to see this approach performed in a future study.
To address the limitations of our original qualitative approach and enhance the clarity and utility of our dataset, we have made the following revisions in the manuscript:
(1) Candidate selection criteria: We now clearly define how candidates were selected for functional testing, based on their frequency across biological replicates. Specifically, “strong candidates” were detected in three or more replicates, while “weak candidates” appeared in two or fewer.
(2) Frequency-based representation (Table 2):We appreciate the suggestion by Reviewer 4 (Major Comment 1) to quantify differences between high-salt control and trained groups. We now provide the frequency-based representation of the candidates tested in this study within our proteomics data in Table 2. This data showed that many of the tested candidates were more frequently detected in trained worms compared to high-salt controls. This includes both strong and weak candidates
We hope these additions help clarify our approach and demonstrate the value of the dataset, even within the constraints of qualitative proteomics.
(2) Also, tissue- or cell-specificity of the identified proteins were commonly discussed. In reviewer #3's first Major comment, appearance of non-neuronal protein in the list was pointed out, which collaborate with my (#4 reviewer's) question on successful identification of neuronal proteins by this method. On the other hand, reviewer #1 pointed out subset neuron-specific proteins in the list. Obviously, these issues need to be systematically described by the authors.
We agree with Reviewer 4 that these analyses provide a critical angle of analysis that is not explored in the original manuscript.
Tissue analysis (Reviewer 3 Major Comment 1): We have used the single neuron RNA-Seq database CeNGEN, to identify that 87-95% (i.e. a large majority) of proteins identified across replicates corresponded to genes detected in neurons. These findings support that the TurboID enzyme was able to target the neuronal proteome as expected. Table 1 provides this information as is now described in the main text of the revised work on page 16.
Neuron class analyses (Reviewer 1 Major Comment 2): In response, we have used the suggested Wormbase gene enrichment tool and CeNGEN. We specifically input proteins from the learning proteome into Wormbase, after filtering for proteins unique to TurboID trained animals. For CeNGEN, we compared genes/proteins from control worms and trained worms to identify potential neurons that may be involved in this learning paradigm.
Briefly, we found highlight a range of neuron classes known in learning (e.g., RIS interneurons), cells that affect behaviour but have not been explored in learning (e.g., IL1 polymodal neurons), and neurons for which their function/s are unknown (e.g., pharyngeal neuron I3). Corresponding text for this new analysis has been added on pages 16-20, with a new table and figure added to illustrate these findings (Table S7 & Figure 4). Methods are detailed on pages 50-51.
(3) Given reviewer #1's OPTIONAL Major comment, as an expert of behavioral assays in C. elegans, I would like to comment based on my experience that mutants received from Caenorhabditis Genetics Center or other labs often lose the phenotype after outcrossing by the wild type, indicating that a side mutation was responsible for the observed behavioral phenotype. Therefore, outcrossing may be helpful and easier than rescue experiments, though the latter are of course more accurate.
Thank you for this suggestion. To address the potential involvement of background mutations, we have done experiments with backcrossed versions of mutants tested where possible, as shown in Figure 6. We found that F46H5.3(-) mutants maintained enhanced learning capacity after backcrossing with wild type, compared to their non-backcrossed mutant line. This was in contrast to C30G12.6(-) animals which lost their enhanced learning phenotype following backcrossing using wild type worms. This is described in the text on pages 24-26.
(4) Just let me clarify the first Minor comment by reviewer #2. Authors described that the kin-2 mutant has abnormality in "salt associative learning" and "salt aversive learning", according to authors' terminology. In this comment by reviewer #2, "gustatory associative learning" probably refers to both of these assays.
Reviewer 4 is correct. We have amended the wording appropriately on page 31 to clarify our meaning to address Reviewer 2’s comment.
“Although kin-2(ce179) mutants were not shown to impact salt aversive learning, they have been reported previously to display impaired intermediate-term memory (but intact learning and short-term memory) for butanone appetitive learning (Stein and Murphy, 2014).”
(5) There seem to be several typos in reviewer #1's Minor comments.
"In Page 9, Lines 17-18" -> "Page 8, Lines 17-18".
"Page 8, Line 24" -> "Page 7, Line 24".
"I would suggest to remove figure 3" -> "I would suggest to remove figure 2"
"summary figure similar to Figure 4" -> "summary figure similar to Figure 3"
"In the discussion Page 24, Line 14" -> "In the discussion Page 23, Line 14"
(I note that because a top page was inserted in the "merged" file but not in art file for review, there is a shift between authors' page numbers and pdf page numbers in the former.) It would be nice if reviewer #1 can confirm on these because I might be wrong.
We appreciate Reviewer 4 noting this, and can confirm that these are the correct references (as indicated by Reviewer 1 in their cross-comments)
Reviewer #4 (Significance):
(1) Total neural proteome analysis has not been conducted before for learning-induced changes, though transcriptome analysis has been performed for odor learning (Lakhina et al., http://dx.doi.org/10.1016/j.neuron.2014.12.029). This guarantees the novelty of this manuscript, because for some genes, protein levels may change even though mRNA levels remain the same. We note an example in which a proteome analysis utilizing TurboID, though not the comparison between trained/control, has led to finding of learning related proteins (Hiroki et al., http://dx.doi.org/10.1038/s41467-022-30279-7). As described in the Major comments 1) in the previous section, improvement of data presentation will be necessary to substantiate this novelty.
We appreciate this thoughtful feedback. We agree that while the neuronal transcriptome has been explored in Lakhina et al., 2015 for C. elegans in the context of memory, our study represents the first to examine learning-induced changes in the total neuronal proteome. We particularly agree with the statement that “for some genes, protein levels may change even though mRNA levels remain the same”. This is essential rationale that we now discuss on page 42.
Additionally, we acknowledge the relevance of the study by Hiroki et al., 2022, which used TurboID to identify learning-related proteins, though not in a trained versus control comparison. Our work builds on this by directly comparing trained and control conditions, thereby offering new insights into the proteomic landscape of learning. This is now clarified on page 36.
To substantiate the novelty and significance of our approach, we have revised the data presentation throughout the manuscript, including clearer candidate selection criteria, frequency-based representation of proteomic hits (Table 2), and neuron-specific enrichment analyses (Table S7 & Figure 4). We hope these improvements help convey the unique contribution of our study to the field.
(2) Authors found six mutants that have abnormality in the salt learning (Fig. 4). These genes have not been described to have the abnormality, providing novel knowledge to the readers, especially those who work on C. elegans behavioural plasticity. Especially, involvement of acetylcholine neurotransmission has not been addressed. Although site of action (neurons involved) has not been tested in this manuscript, it will open the venue to further determine the way in which acetylcholine receptors, cAMP pathway etc. influences the learning process.
Thank you Reviewer 4, for this encouraging feedback. To further strengthen the study and expand its relevance, we have tested additional mutants in response to Reviewer 3’s comments, as shown in Figures 6 & S7. These results provide even more candidate genes and pathways for future exploration, enhancing the significance and impact of our study.
-
-

Note: This response was posted by the corresponding author to Review Commons. The content has not been altered except for formatting.
Learn more at Review Commons
Reply to the reviewers
We thank the reviewers for providing us the opportunity to revise our manuscript titled “Identifying regulators of associative learning using a protein-labelling approach in C. elegans.” We appreciate the insightful feedback that we received to improve this work. In response, we have extensively revised the manuscript with the following changes: we have (1) clarified the criteria used for selecting candidate genes for behavioural testing, presenting additional data from ‘strong’ hits identified in multiple biological replicates (now testing 26 candidates, previously 17), (2) expanded our discussion of the functional relevance of validated hits, …
Note: This response was posted by the corresponding author to Review Commons. The content has not been altered except for formatting.
Learn more at Review Commons
Reply to the reviewers
We thank the reviewers for providing us the opportunity to revise our manuscript titled “Identifying regulators of associative learning using a protein-labelling approach in C. elegans.” We appreciate the insightful feedback that we received to improve this work. In response, we have extensively revised the manuscript with the following changes: we have (1) clarified the criteria used for selecting candidate genes for behavioural testing, presenting additional data from ‘strong’ hits identified in multiple biological replicates (now testing 26 candidates, previously 17), (2) expanded our discussion of the functional relevance of validated hits, including providing new tissue-specific and neuron class-specific analyses, and (3) improved the presentation of our data, including visualising networks identified in the ‘learning proteome’, to better highlight the significance of our findings. We also substantially revised the text to indicate our attempts to address limitations related to background noise in the proteomic data and outlined potential refinements for future studies. All revisions are clearly marked in the manuscript in red font. A detailed, point-by-point response to each comment is provided below.
1. Point-by-point description of the revisions
*Reviewer #1 (Evidence, reproducibility and clarity (Required)): *
Summary:
Rahmani et al., utilize the TurboID method to characterize the global proteome changes in the worm's nervous system induced by a salt-based associative learning paradigm. Altogether, Rahmani et al., uncover 706 proteins that are tagged by the TurboID method specifically in samples extracted from worms that underwent the memory inducing protocol. Next, the authors conduct a gene enrichment analysis that implicates specific molecular pathways in salt-associative learning, such as MAP-kinase and cAMP-mediated pathways. The authors then screen a representative group of the hits from the proteome analysis. The authors find that mutants of candidate genes from the MAP-kinase pathway, namely dlk-1 and uev-3, do not affect the performance in the learning paradigm. Instead multiple acetylcholine signaling mutants significantly affected the performance in the associative memory assay, e.g., acc-1, acc-3, gar-1, and lgc-46. Finally, the authors demonstrate that the acetylcholine signaling mutants did not exhibit a phenotype in similar but different conditioning paradigms, such as aversive salt-conditioning or appetitive odor conditioning, suggesting their effect is specific to appetitive salt conditioning.
Major comments:
- The statistical approach and analysis of the behavior assay: The authors use a 2-way ANOVA test which assumes normal distribution of the data. However, the chemotaxis index used in the study is bounded between -1 and 1, which prevents values near the boundaries to be normally distributed.
Since most of the control data in this assay in this study is very close to 1, it strongly suggests that the CI data is not normally distributed and therefore 2-way ANOVA is expected to give skewed results.
I am aware this is a common mistake and I also anticipate that most conclusions will still hold also under a more fitting statistical test.
We appreciate the point raised by Reviewer 1 and understand the importance of performing the correct statistical tests.
The statistical tests used in this study were chosen since parametric tests, particularly ANOVA tests to assess differences between multiple groups, are commonly used to assess behaviour in the C. elegans learning and memory field. Below is a summary of the tests used by studies that perform similar behavioural tests cited in this work, as examples:
Table 1 | A summary for the statistical tests performed by similar studies for chemotaxis assay data. References (listed in the leftmost column) were observed to (A) use parametric tests only or (B) performed either a parametric or non-parametric test on each chemotaxis assay dataset depending on whether the data passed a normality test. Listings for ANOVA tests are in bold to demonstrate their common use in the C. elegans learning and memory field.
Reference
Parametric test/s used in the reference
Non-parametric test/s used in the reference
Beets et al., 2020
Two-way ANOVA
None
Hiroki & Iino 2022
One-way ANOVA
None
Hiroki et al., 2022
One-way ANOVA
None
Hukema et al., 2006
T-tests
None
Hukema et al., Learn. Mem. 2008
T-tests
None
Jang et al., 2019
ANOVA
None
Kitazono et al., 2017
Two-way ANOVA and t-tests
None
Lans et al., 2004
One-way ANOVA
None
Lim et al., 2018
Two-way ANOVA
Wilcoxon rank sum test adjusted with the Benjamini–Hochberg method
Lin et al., 2010
Two-way or three-way ANOVA
None
Nagashima et al., 2019
One-way ANOVA
None
Ohno et al., 2014
None
Sakai et al., 2017
One-way ANOVA or t-tests
None
Stein & Murphy 2014
Two-way ANOVA and t-tests
None
Tang et al., 2023
One-way ANOVA or t-tests
None
Tomioka et al., 2006
T tests
None
Watteyne et al., 2020
One-way ANOVA
Two-sided Kruskal–Wallis
*We note Reviewer 1's concern that this may stem from a common mistake. As stated, Two-way ANOVA generally relies on normally distributed data. We used GraphPad Prism to perform the Shapiro-Wilk normality test on our chemotaxis assay data as it is generally appropriate for sample sizes Table 2 | Shapiro-Wilk normality test results for chemotaxis assay data in Figure S8C. Chemotaxis assay data was generated to assess salt associative learning capacity for wild-type (WT) versus lgc-46(-) mutant C. elegans. Three experimental groups were prepared for each C. elegans strain (naïve, high-salt control, and trained). From top-to-bottom, the data below displays the ‘W’ value, ‘P value’, a binary yes/no for whether the data passes the Shapiro-Wilk normality test, and a ‘P value summary’ (ns = non-significant). W values measure the similarity between a normal distribution and the chemotaxis assay data. Data is considered normal in the Shapiro-Wilk normality test when a W value is near 1.0 and the null hypothesis is not rejected (i.e., P value > 0.05).
WT naïve
WT high-salt control
WT trained
lgc-46 naïve
lgc-46 high-salt control
lgc-46 trained
W
0.9196
0.9114
0.8926
0.8334
0.8151
0.8769
P value
0.5272
0.4758
0.3705
0.1475
0.1070
0.2954
Passed normality test (alpha=0.05)?
Yes
Yes
Yes
Yes
Yes
Yes
P value summary
ns
ns
ns
ns
ns
ns
The manuscript now includes the use of the Shapiro-Wilk normality test to assess chemotaxis assay data before using two-way ANOVA on page 51.
Nevertheless an appropriate statistical analysis should be performed. Since I assume the authors would wish to take into consideration both the different conditions and biological repeats, I can suggest two options:
- Using a Generalized linear mixed model, one can do with R software.
- Using a custom bootstrapping approach. We thank Reviewer 1 for suggesting these two options. We carefully considered both approaches and consulted with the in-house statistician at our institution (Dr Pawel Skuza, Flinders University) for expert advice to guide our decision. In summary:
- Generalised linear mixed models: Generalised linear mixed models (GLMMs) are generally most appropriate for nested/hierarchal data. However, our chemotaxis assay data does not exhibit such nesting. Each biological replicate (N) consists of three technical replicates, which are averaged to yield a single chemotaxis index per N. Our statistical comparisons are based solely on these averaged values across experimental groups, making GLMMs less applicable in this context.
- __Bootstrapping: __Based on advice from our statistician, while bootstrapping can be a powerful tool, its effectiveness is limited when applied to datasets with a low number of biological replicates (N). Bootstrapping relies on resampling existing data to simulate additional observations, which may artificially inflate statistical power and potentially suggest significance where the biological effect size is minimal or not meaningful. Increasing the number of biological replicates to accommodate bootstrapping could introduce additional variability and compromise the interpretability of the results. The total number of assays, especially controls, varies quite a bit between the tested mutants. For example compare the acc-1 experiment in Figure 4.A., and gap-1 or rho-1 in Figure S4.A and D. It is hard to know the exact N of the controls, but I assume that for example, lowering the wild type control of acc-1 to equivalent to gap-1 would have made it non significant. Perhaps the best approach would be to conduct a power analysis, to know what N should be acquired for all samples.
We thoroughly evaluated performing the power analysis: however, this is typically performed with the assumption that an N = 1 represents a singular individual/person. An N =1 in this study is one biological replicate that includes hundreds of worms, which is why it is not typically employed in our field for this type of behavioural test.
Considering these factors, we have opted to continue using a two-way ANOVA for our statistical analysis. This choice aligns with recent publications that employ similar experimental designs and data structures. Crucially, we have verified that our data meet the assumptions of normality, addressing key concerns regarding the suitability of parametric testing. We believe this approach is sufficiently rigorous to support our main conclusions. This rationale is now outlined on page 51.
To be fully transparent, our aim is to present differences between wild-type and mutant strains that are clearly visible in the graphical data, such that the choice of statistical test does not become a limiting factor in interpreting biological relevance. We hope this rationale is understandable, and we sincerely appreciate the reviewer’s comment and the opportunity to clarify our analytical approach.
We hope that Reviewer 1 will appreciate these considerations as sufficient justification to retain the statistical tests used in the original manuscript. Nevertheless, to constructively address this comment, we have performed the following revisions:
- __Consistent number of biological replicates: __We performed additional biological replicates of the learning assay to confirm the behavioural phenotypes for the key candidates described (KIN-2 , F46H5.3, ACC-1, ACC-3, LGC-46). We chose N = 5 since most studies cited in this paper that perform similar behavioural tests do the same (see the table below). Table 3 | A summary for sample sizes generated by similar studies for chemotaxis assay data. References (listed in the leftmost column) were observed to the sample sizes (N) below corresponding to biological replicates of chemotaxis assay data. N values are in bold when the study uses N ≤ 5.
Reference
N used in the study for chemotaxis assay data
Beets et al., 2020
8
Hiroki & Iino 2022
5-8
Hiroki et al., 2022
6-7
Hukema et al., 2006
≥ 4
Hukema et al., Learn. Mem. 2008
≥ 4
Jang et al., 2019
≥ 4
Kitazono et al., 2017
≥ 4
Kauffman et al., 2010
≥ 3
Kauffman et al., J. Vis. Exp. 2011
≥ 3
Lans et al., 2004
2
Lim et al., 2018
2-4
Lin et al., 2010
≥ 4
Nagashima et al., 2019
≥ 7
Ohno et al., 2014
≥ 11
Sakai et al., 2017
≥ 4
Stein & Murphy 2014
3-5
Tang et al., 2023
≥ 9
Watteyne et al., 2020
≥ 10
__Grouped presentation of behavioural data: __We now present all behavioural data by grouping genotypes tested within the same biological replicate, including wild-type controls, rather than combining genotypes tested separately. This ensures that each graph displays data from genotypes sharing the same N, also an important consideration for performing parametric tests. Accordingly, we re-performed statistical analyses using this reduced Nfor relevant graphs. As anticipated, this rendered some comparisons non-significant. All statistical comparisons are clearly indicated on each graph. __Improved clarity of figure legends: __We revised figure legends for Figures 5, 6, S7, S8, & S9 to make clear how many biological replicates have been performed for each genotype by adding N numbers for each genotype in all figures.
The authors use the phrasing "a non-significant trend", I find such claims uninterpretable and should be avoided. Examples: Page 16. Line 7 and Page 18, line 16.
This is an important point. While we were not able to find the specific phrasing "a non-significant trend" from this comment in the original manuscript, we acknowledge that referring to a phenotype as both a trend and non-significant may confuse readers, which was originally stated in the manuscript in two locations.
The main text has been revised on pages 27 & 28 when describing comparisons between trained groups between two C. elegans lines, by removing mentions of trends and retaining descriptions of non-significance.
Neuron-specific analysis and rescue of mutants:
Throughout the study the authors avoid focusing on specific neurons. This is understandable as the authors aim at a systems biology approach, however, in my view this limits the impact of the study. I am aware that the proteome changes analyzed in this study were extracted from a pan neuronally expressed TurboID. Yet, neuron-specific changes may nevertheless be found. For example, running the protein lists from Table S2, in the Gene enrichment tool of wormbase, I found, across several biological replicates, enrichment for the NSM, CAN and RIG neurons. A more careful analysis may uncover specific neurons that take part in this associative memory paradigm. In addition, analysis of the overlap in expression of the final gene list in different neurons, comparing them, looking for overlap and connectivity, would also help to direct towards specific circuits.
This is an important and useful suggestion. We appreciate the benefit in exploring the data from this study from a neuron class-specific lens, in addition to the systems-level analyses already presented.
The WormBase gene enrichment tool is indeed valuable for broad transcriptomic analyses (the findings from utilising this tool are now on page 16); however, its use of Anatomy Ontology (AO) terms also contains annotations from more abundant non-neuronal tissues in the worm. To strengthen our analysis and complement the Wormbase tool, we also used the CeNGEN database as suggested by Reviewer 3 Major Comment 1 (Taylor et al., 2021), which uses single cell RNA-Seq data to profile gene expression across the C. elegans nervous system. We input our learning proteome data into CeNGEN as a systemic analysis, identifying neurons highly represented by the learning proteome (on pages 16-20). To do this, we specifically compared genes/proteins from high-salt control worms and trained worms to identify potential neurons that may be involved in this learning paradigm. Briefly, we found:
- WormBase gene enrichment tool: Enrichment for anatomy terms corresponding to specific interneurons (ADA, RIS, RIG), ventral nerve cord neurons, pharyngeal neurons (M1, M2, M5, I4), PVD sensory neurons, DD motor neurons, serotonergic NSM neurons, and CAN.
- CeNGEN analysis: Representation of neurons previously implicated in associative learning (e.g., AVK interneurons, RIS interneurons, salt-sensing neuron ASEL, CEP & ADE dopaminergic neurons, and AIB interneurons), as well as neurons not previously studied in this context (pharyngeal neurons I3 & I6, polymodal neuron IL1, motor neuron DA9, and interneuron DVC). Methods are detailed on pages 50 & 51. These data are summarised in the revised manuscript as Table S7 & Figure 4.
To further address the reviewer’s suggestion, we examined the overlap in expression patterns of the validated learning-associated genes acc-1, acc-3, lgc-46, kin-2, and F46H5.3 across the neuron classes above, using the CeNGEN database. This was done to explore potential neuron classes in which these regulators may act in to regulate learning. This analysis revealed both shared and distinct expression profiles, suggesting potential functional connectivity or co-regulation among subsets of neurons. To summarise, we found:
- All five learning regulators are expressed in RIM interneurons and DB motor neurons.
- KIN-2 and F46H5.3 share the same neuron expression profile and are present in many neurons, so they may play a general function within the nervous system to facilitate learning.
- ACC-3 is expressed in three sensory neuron classes (ASE, CEP, & IL1).
- In contrast, ACC-1 and LGC-46 are expressed in neuron classes (in brackets) implicated in gustatory or olfactory learning paradigms (AIB, AVK, NSM, RIG, & RIS) (Beets et al., 2012, Fadda et al., 2020, Wang et al., 2025, Zhou et al., 2023, Sato et al., 2021), neurons important for backward or forward locomotion (AVE, DA, DB, & VB) (Chalfie et al., 1985), and neuron classes for which their function is yet detailed in the literature (ADA, I4, M1, M2, & M5). These neurons form a potential neural circuit that may underlie this form of behavioural plasticity, which we now describe in the main text on pages 16-20 & 34-35 and summarise in Figure 4.
OPTIONAL: A rescue of the phenotype of the mutants by re-expression of the gene is missing, this makes sure to avoid false-positive results coming from background mutations. For example, a pan neuronal or endogenous promoter rescue would help the authors to substantiate their claims, this can be done for the most promising genes. The ideal experiment would be a neuron-specific rescue but this can be saved for future works.
We appreciate this suggestion and recognise its potential to strengthen our manuscript. In response, we made many attempts to generate pan-neuronal and endogenous promoter re-expression lines. However, we faced several technical issues in transgenic line generation, including poor survival following microinjection likely due to protein overexpression toxicity (e.g., C30G12.6, F46H5.3), and reduced animal viability for chemotaxis assays, potentially linked to transgene-related reproductive defects (e.g., ACC-1). As we have previously successfully generated dozens of transgenic lines in past work (e.g. Chew et al., Neuron 2018; Chew et al., Phil Trans B 2018; Gadenne/Chew et al., Life Science Alliance 2022), we believe the failure to produce most of these lines is not likely due to technical limitations. For transparency, these observations have been included in the discussion section of the manuscript on pages 39 & 40 as considerations for future troubleshooting.
Fortunately, we were able to generate a pan-neuronal promoter line for KIN-2 that has been tested and included in the revised manuscript. This new data is shown in __Figure 5B __and described on pages 23 & 24. Briefly, this shows that pan-neuronal expression of KIN-2 from the ce179 mutant allele is sufficient to reproduce the enhanced learning phenotype observed in kin-2(ce179) animals, confirming the role of KIN-2 in gustatory learning.
To address the potential involvement of background mutations (also indicated by Reviewer 4 under ‘cross-commenting’), we have also performed experiments with backcrossed versions of several mutants. These experiments aimed to confirm that salt associative learning phenotypes are due to the expected mutation. Namely, we assessed kin-2(ce179) mutants that had been backcrossed previously by another laboratory, as well as C30G12.6(-) and F46H5.3(-) animals backcrossed in this study. Although not all backcrossed mutants retained their original phenotype (i.e., C30G12.6) (Figure 6D, a newly added figure), we found that backcrossed versions of KIN-2 and F46H5.3 both robustly showed enhanced learning (Figures 5A & 6B). This is described in the text on pages 23-26.
__Minor comments: __
- Lack of clarity regarding the validation of the biotin tagging of the proteome. The authors show in Figure 1 that they validated that the combination of the transgene and biotin allows them to find more biotin-tagged proteins. However there is significant biotin background also in control samples as is common for this method. The authors mention they validated biotin tagging of all their experiments, but it was unclear in the text whether they validated it in comparison to no-biotin controls, and checked for the fold change difference.
This is an important point: We validated our biotin tagging method prior to mass spectrometry by comparing ‘no biotin’ and ‘biotin’ groups. This is shown in Figure S1 in the revised manuscript, which includes a western blot comparing untreated and biotin treated animals that are non-transgenic or expressing TurboID. As expected, by comparing biotinylated protein signal for untreated and treated lanes within each line, biotin treatment increased the signal 1.30-fold for non-transgenic and 1.70-fold for TurboID C. elegans. This is described on __page 8 __of the revised manuscript.
To clarify, for mass spectrometry experiments, we tested a no-TurboID (non-transgenic) control, but did not perform a no-biotin control. We included the following four groups: (1) No-TurboID ‘control’ (2) No-TurboID ‘trained’, (3) pan-neuronal TurboID ‘control’ and (4) pan-neuronal TurboID ‘trained’, where trained versus control refers to whether ‘no salt’ was used as the conditioned stimulus or not, respectively (illustrated in Figure 1A). Due to the complexity of the learning assay (which involves multiple washes and handling steps, including a critical step where biotin is added during the conditioning period), and the need to collect sufficient numbers of worms for protein extraction (>3,000 worms per experimental group), adding ‘no-biotin’ controls would have doubled the number of experimental groups, which we considered unfeasible for practical reasons. This is explained on __pages 8 & 9 __of the revised manuscript.
Also, it was unclear which exact samples were tested per replicate. In Page 9, Lines 17-18: "For all replicates, we determined that biotinylated proteins could be observed ...", But in Page 8, Line 24 : "We then isolated proteins from ... worms per group for both 'control' and 'trained' groups,... some of which were probed via western blotting to confirm the presence of biotinylated proteins".
- Could the authors specify which samples were verified and clarify how?
Thank you for pointing out these unclear statements: We have clarified the experimental groups used for mass spectrometry experiments as detailed in the response above on pages 8 &____ 9. In addition, western blots corresponding to each biological replicate of mass spectrometry data described in the main text on page 10 and have been added to the revised manuscript (as Figure S3). These western blots compare biotinylation signal for proteins extracted from (1) No-TurboID ‘control’ (2) No-TurboID ‘trained’, (3) pan-neuronal TurboID ‘control’ and (4) pan-neuronal TurboID ‘trained’. These blots function to confirm that there were biotinylated proteins in TurboID samples, before enrichment by streptavidin-mediated pull-down for mass spectrometry.
OPTIONAL: include the fold changes of biotinylated proteins of all the ones that were tested. Similar to Figure 1.C.
This is an excellent suggestion. As recommended by the reviewer, we have included fold-changes for biotinylated protein levels between high-salt control and trained groups (on pages 9 & 10 for replicate #1 and in __Table S2 __for replicates #2-5). This was done by measuring protein levels in whole lanes for each experimental group per biological replicate within western blots (__Figure 1C __for replicate #1 and __Figure S3 __for replicates #2-5) of protein samples generated for mass spectrometry (N = 5).
Figure 2 does not add much to the reader, it can be summarized in the text, as the fraction of proteins enriched for specific cellular compartments.
- I would suggest to remove Figure 2 (originally written as figure 3) to text, or transfer it to the supplementry material.
As noted in cross-comment response to Reviewer 4, there were typos in the original figure references, we have corrected them above. Essentially, this comment is referring to Figure 2.
We appreciate this feedback from Reviewer 1. We agree that the original __Figure 2 __functions as a visual summary from analysis of the learning proteome at the subcellular compartment level. However, it also serves to highlight the following:
- Representation for neuron-specific GO terms is relatively low, but even this small percentage represents entire protein-protein networks that are biologically meaningful, but that are difficult to adequately describe in the main text.
- TurboID was expressed in neurons so this figure supports the relevance of the identified proteome to biological learning mechanisms.
- Many of these candidates could not be assessed by learning assay using single mutants since related mutations are lethal or substantially affect locomotion. These networks therefore highlight the benefit in using strategies like TurboID to study learning. We have chosen to retain this figure, moving it to the supplementary material as Figure S4 in the revised manuscript, as suggested.
- OPTIONAL- I would suggest the authors to mark in a pathway summary figure similar to Figure 3 (originally written as Figure 4) the results from the behavior assay of the genetic screen. This would allow the reader to better get the bigger picture and to connect to the systemic approach taken in Figures 2 and 3.
We think this is a fantastic suggestion and thank Reviewer 1 for this input. In the revised manuscript, we have added Figure 7, which summarises the tested candidates that displayed an effect on learning, mapped onto potential molecular pathways derived from networks in the learning proteome. This figure provides a visual framework linking the behavioural outcomes to the network context. This is described in the main text on pages 32-33.
Typo in Figure 3: the circle of PPM1: The blue right circle half is bigger than the left one.
We thank the Reviewer for noticing this, the node size for PPM-1.A has been corrected in what is now Figure 2 in the revised work.
Unclarity in the discussions. In the discussion Page 24, Line 14, the authors raise this question: "why are the proteins we identified not general learning regulators?. The phrasing and logic of the argumentation of the possible answers was hard to follow. - Can you clarify?
We appreciate this feedback in terms of unclarity, as we strive to explain the data as clearly and transparently as possible. Our goal in this paragraph was to discuss why some candidates were seen to only affect salt associative learning, as opposed to showing effects in multiple learning paradigms (i.e., which we were defining as a ‘general learning regulator’). We have adjusted the wording in several places in this paragraph now on pages 36 & 37 to address this comment. We hope the rephrased paragraph provides sufficient rationalisation for the discussion regarding our selection strategy used to isolate our protein list of potential learning regulators, and its potential limitations.
***Cross-Commenting** *
Firstly, we would like to express our appreciation for the opportunity for reviewers to cross-comment on feedback from other reviewers. We believe this is an excellent feature of the peer review process, and we are grateful to the reviewers for their thoughtful engagement and collaborative input.
I would like to thank Reviewer #4 for the great cross comment summary, I find it accurate and helpful.
I also would like to thank Reviewer #4 for spotting the typos in my minor comments, their page and figure numbers are the correct ones.
We have corrected these typos in the relevant comments, and have responded to them accordingly.
Small comment on common point 1 - My feeling is that it is challanging to do quantitative mass spectrometry, especially with TurboID. In general, the nature of MS data is that it hints towards a direction but a followup validation work is required in order to assess it. For example, I am not surprised that the fraction of repeats a hit appeared in does not predict well whether this hit would be validated behavioraly. Given these limitations, I find the authors' approach reasonable.
We thank Reviewer 1 for this positive and thoughtful feedback. We also appreciate Reviewer 4’s comment regarding quantitative mass spectrometry and have addressed this in detail below (see response to Reviewer 4). However, we agree with Reviewer 1 that there are practical challenges to performing quantitative mass spectrometry with TurboID, primarily due to the enrichment for biotinylated proteins that is a key feature of the sample preparation process.
Importantly, we whole-heartedly agree with Reviewer 1’s statement that “In general, the nature of MS data is that it hints towards a direction but a follow-up validation work is required in order to assess it”. This is the core of our approach: however, we appreciate that there are limitations to a qualitative ‘absent/present’ approach. We have addressed some of these limitations by clarifying the criteria used for selecting candidate genes, based additionally on the presence of the candidate in multiple biological replicates (categorised as ‘strong’ hits). Based on this method, we were able to validate the role of several novel learning regulators (Figures 5, 6, & S7). We sincerely hope that this manuscript can function as a direction for future research, as suggested by this Reviewer.
I also would like to highlight this major comment from reviewer 4:
"In Experimental Procedures, authors state that they excluded data in which naive or control groups showed average CI 0.5499 for N2 (page 36, lines 5-7). "
This threshold seems arbitrary to me too, and it requires the clarifications requested by reviewer 4.
As detailed in our response to Reviewer 4, Major Comment 2, data were excluded only in rare cases, specifically when N2 worms failed to show strong salt attraction prior to training, or when trained N2 worms did not exhibit the expected behavioural difference compared to untrained controls – this can largely be attributed to clear contamination or over-population issues, which are visible prior to assessing CTX plates and counting chemotaxis indices.
These criteria were initially established to provide an objective threshold for excluding biological replicates, particularly when planning to assay a large number of genetic mutants. However, after extensive testing across many replicates, we found that N2 worms (that were not starved, or not contaminated) consistently displayed the expected phenotype, rendering these thresholds unnecessary. We acknowledge that emphasizing these criteria may have been misleading, and have therefore removed them from page 50 in the revised manuscript to avoid confusion and ensure clarity.
*Reviewer #1 (Significance (Required)): *
This study does a great job to effectively utilize the TurboID technique to identify new pathways implicated in salt-associative learning in C. elegans. This technique was used in C. elegans before, but not in this context. The salt-associative memory induced proteome list is a valuable resource that will help future studies on associative memory in worms. Some of the implicated molecular pathways were found before to be involved in memory in worms like cAMP, as correctly referenced in the manuscript. The implication of the acetylcholine pathway is novel for C. elgeans, to the best of my knowledge. The finding that the uncovered genes are specifically required for salt associative memory and not for other memory assays is also interesting.
However overall I find the impact of this study limited. The premise of this work is to use the Turbo-ID method to conduct a systems analysis of the proteomic changes. The work starts by conducting network analysis and gene enrichment which fit a systemic approach. However, since the authors find that ~30% of the tested hits affect the phenotype, and since only 17/706 proteins were assessed, it is challenging to draw conclusive broad systemic claims. Alternatively, the authors could have focused on the positive hits, and understand them better, find the specific circuits where these genes act. This could have increased the impact of the work. Since neither of these two options are satisfied, I view this work as solid, but not wide in its impact and therefore estimate the audience of this study would be more specialized.
My expertise is in C. elegans behavior, genetics, and neuronal activity, programming and machine learning.
We thank the Reviewer for these comments and appreciate the recognition of the value of the proteomic dataset and the identification of novel molecular pathways, including the acetylcholine pathway, as well as the specificity of the uncovered genes to salt-associative memory.
Regarding the reviewer’s concern about the overall impact and scope of the study, we respectfully offer the following clarification. Our aim was to establish a systems-level approach for investigating learning-related proteomic changes using TurboID, and we acknowledge that only a subset of the identified proteins was experimentally tested (now 26/706 proteins in the revised manuscript). Although only five of the tested single gene mutants showed a robust learning phenotype in the revised work (after backcrossing, more stringent candidate selection, improved statistical analysis in addressing reviewer comments), our proteomic data provides us a unique opportunity to define these candidates within protein-protein networks (as illustrated in Figure 7). Importantly, our functional testing focused on single-gene mutants, which may not reveal phenotypes for genes that act redundantly (now mentioned on pages 28-30). This limitation is inherent to many genetic screens and highlights the value of our proteomic dataset, which enables the identification of broader protein-protein interaction networks and molecular pathways potentially involved in learning.
To support this systems-level perspective, we have added Figure 7, which visually integrates the tested candidates into molecular pathways derived from the learning proteome for learning regulators KIN-2 and F46H5.3. We also emphasise more explicitly in the text (on pages 32-33) the value of our approach by highlighting the functional protein networks that can be derived from our proteomics dataset.
We fully acknowledge that the use of TurboID across all neurons limits the resolution needed to pinpoint individual neuron contributions, and understand the benefit in further experiments to explore specific circuits. Many circuits required for salt sensing and salt-based learning are highly explored in the literature and defined explicitly (see Rahmani & Chew, 2021), so our intention was to complement the existing literature by exploring the protein-protein networks involved in learning, rather than on neuron-neuron connectivity. However, we recognise the benefit in integrating circuit-level analyses, given that our proteomic data suggests hundreds of candidates potentially involved in learning. While validating each of these candidates is beyond the scope of the current study, we have taken steps to suggest candidate neurons/circuits by incorporating tissue enrichment analyses and single-cell transcriptomic data (Table S7 & Figure 4). These additions highlight neuron classes of interest and suggest possible circuits relevant to learning.
We hope this clarification helps convey the intended scope and contribution of our study. We also believe that the revisions made in response to Reviewer 1’s feedback have strengthened the manuscript and enhanced its significance within the field.
*Reviewer #2 (Evidence, reproducibility and clarity (Required)): *
__Summary: __
In this study by Rahmani in colleagues, the authors sought to define the "learning proteome" for a gustatory associative learning paradigm in C. elegans. Using a cytoplasmic TurboID expressed under the control of a pan-neuronal promoter, the authors labeled proteins during the training portion of the paradigm, followed by proteomics analysis. This approach revealed hundreds of proteins potentially involved in learning, which the authors describe using gene ontology and pathways analysis. The authors performed functional characterization of some of these genes for their requirement in learning using the same paradigm. They also compared the requirement for these genes across various learning paradigms, and found that most hits they characterized appear to be specifically required for the training paradigm used for generating the "learning proteome".
Major Comments:
- The definition of a "hit" from the TurboID approach is does not appear stringent enough. According to the manuscript, a hit was defined as one unique peptide detected in a single biological replicate (out of 5), which could give rise to false positives. In figure S2, it is clear that there relatively little overlap between samples with regards to proteins detected between replicates, and while perhaps unintentional, presenting a single unique peptide appears to be an attempt to inflate the number of hits. Defining hits as present in more than one sample would be more rigorous. Changing the definition of hits would only require the time to re-list genes and change data presented in the manuscript accordingly. We thank Reviewer 2 for this valuable comment, and the following related suggestion. We agree with the statement that “Defining hits as present in more than one sample would be more rigorous”. Therefore, to address this comment, we have now separated candidates into two categories in __Table 2 __in the revised manuscript: ‘strong’ (present in 3 or more biological replicates) and ‘weak’ candidates (present in 2 or fewer biological replicates). However, we think these weaker candidates should still be included in the manuscript, considering we did observe relationships between these proteins and learning. For example, ACC-1, which influences salt associative learning in C. elegans, was detected in one replicate of mass spectrometry as a potential learning regulator (Figure S8A). We describe this classification in the main text on pages 21-22.
We also agree with Reviewer 2 that the overlap between individual candidate hits is low between biological replicates; the inclusion of __Figure S2 __in the original manuscript serves to highlight this limitation. However, it is also important to consider that there is notable overlap for whole molecular pathways between biological replicates of mass spectrometry data as shown in __Figure 2 __in the revised manuscript (this consideration is now mentioned on pages 13-14). We have included Figure 3 to illustrate representation for two metabolic processes across several biological replicates normally indispensable to animal health, as an example to provide additional visual aid for the overlap between replicates of mass spectrometry. We provide this figure (described on pages 13 & 15) to demonstrate the strength of our approach in that it can detect candidates not easily assessable by conventional forward or reverse genetic screens.
We also appreciate the opportunity to explain our approach. The criteria of “at least one unique peptide” was chosen based on a previous work for which we adapted for this manuscript (Prikas et al., 2020). It was not intended to inflate the number of hits but rather to ensure sensitivity in detecting low-abundance neuronal proteins. We have clarified this in our Methods (page 46).
The "hits" that the authors chose to functionally characterize do not seem like strong candidate hits based on the proteomics data that they generated. Indeed, most of the hits are present in a single, or at most 2, biological replicate. It is unclear as to why the strongest hits were not characterized, which if mutant strains are publicly available, would not be a difficult experiment to perform.
We thank the reviewer for this important suggestion. To address this, we have described two molecular pathways with multiple components that appear in more than one biological replicate of mass spectrometry data in __Figure 3 __(main text on page 13). In addition, we have included __Figures 6 & S7 __where 9 additional single mutants corresponding to candidates in three or more biological replicates of mass spectrometry were tested for salt associative learning. Briefly, we found the following (number of replicates that a protein was unique to TurboID trained animals is in brackets):
- Novel arginine kinase F46H5.3 (4 replicates) displays an effect in both salt associative learning and salt aversive learning in the same direction (Figures 6A, 6B, & S9A, pages 31-32 & 37-38).
- Worms with a mutation for armadillo-domain protein C30G12.6 (3 replicates) only displayed an enhanced learning phenotype when non-backcrossed, not backcrossed. This suggests the enhanced learning phenotype was caused by a background mutation (Figure 6, pages 24-25).
- We did not observe an effect on salt associative learning when assessing mutations for the ciliogenesis protein IFT-139 (5 replicates), guanyl nucleotide factors AEX-3 or TAG-52 (3 replicates), p38/MAPK pathway interactor FSN-1 (3 replicates), IGCAM/RIG-4 (3 replicates), and acetylcholine components ACR-2 (4 replicates) and ELP-1 (3 replicates) (Figure S7, on pages 27-30). However, we note throughout the section for which these candidates are described that only single gene mutants were tested, meaning that genes that function in redundant or compensatory pathways may not exhibit a detectable phenotype. Because of the lack of strong evidence that these are indeed proteins regulated in the context of learning based on proteomics, including evidence of changes in the proteins (by imaging expression changes of fluorescent reporters or a biochemical approach), would increase confidence that these hits are genuine.
We thank Reviewer 2 for this suggestion – we agree that it would have been ideal to have additional evidence suggesting that changes in candidate protein levels are associated directly with learning. Ideally, we would have explored this aspect further; however, as outlined in response to Reviewer 1 Major Comment 2 (OPTIONAL), this was not feasible within the scope of the current study due to several practical challenges. Specifically, we attempted to generate pan-neuronal and endogenous promoter rescue lines for several candidates, but encountered significant challenges, including poor survival post-microinjection (likely due to protein overexpression toxicity) and reduced viability for behavioural assays, potentially linked to transgene-related reproductive defects. This information is now described on pages 39 & 40 of the revised work.
To address these limitations, we performed additional behavioural experiments where possible. We successfully generated a pan-neuronal promoter line for kin-2, which was tested and included in the revised manuscript (Figure 5B, pages 30 & 31). In addition, to confirm that observed learning phenotypes were due to the expected mutations and not background effects, we conducted experiments using backcrossed versions of several mutant lines as suggested by Reviewer 4 Cross Comment 3 (Figure 6, pages 23-24 & 24-26). Briefly, this shows that pan-neuronal expression of KIN-2 from the ce179 mutant allele is sufficient to repeat the enhanced learning phenotype observed in backcrossed kin-2(ce179) animals, providing additional evidence that the identified hits are required for learning. We also confirmed that F46H5.3 modulates salt associative learning, given both non-backcrossed and backcrossed F46H5.3(-) mutants display a learning enhancement phenotype. The revised text now describes this data on the page numbers mentioned above.
Minor Comments:
- The authors highlight that the proteins they discover seem to function uniquely in their gustatory associative paradigm, but this is not completely accurate. kin-2, which they characterize in figure 4, is required for positive butanone association (the authors even say as much in the manuscript) in Stein and Murphy, 2014. We appreciate this correction and thank the Reviewer for pointing this out. We have amended the wording appropriately on page 31 to clarify our meaning.
- “Although kin-2(ce179) mutants were not shown to impact salt aversive learning, they have been reported previously to display impaired intermediate-term memory (but intact learning and short-term memory) for butanone appetitive learning (Stein and Murphy, 2014).”*
*Reviewer #2 (Significance (Required)): *
- General Assessment: The approach used in this study is interesting and has the potential to further our knowledge about the molecular mechanisms of associative behaviors. Strengths of the study include the design with carefully thought out controls, and the premise of combining their proteomics with behavioral analysis to better understand the biological significance of their proteomics findings. However, the criteria for defining hits and prioritization of hits for behavioral characterizations were major wweaknesses of the paper.
- Advance: There have been multiple transcriptomic studies in the worm looking at gene expression changes in the context of behavioral training (Lakhina et al., 2015, Freytag 2017). This study compliments and extends those studies, by examining how the proteome changes in a different training paradigm. This approach here could be employed for multiple different training paradigms, presenting a new technical advance for the field.
- Audience: This paper would be of interest to the broader field of behavioral and molecular neuroscience. Though it uses an invertebrate system, many findings in the worm regarding learning and memory translate to higher organisms.
- I am an expert in molecular and behavioral neuroscience in both vertebrate and invertebrate models, with experience in genetics and genomics approaches. We appreciate Reviewer 2’s thoughtful assessment and constructive feedback. In response to concerns regarding definition and prioritisation of hits, we have revised our approach as detailed above to place more consideration on ‘strong’ hits present in multiple biological replicates. We have also added new behavioural data for additional mutants that fall into this category (Figures 6 & S7). We hope these revisions strengthen our study and enhance its relevance to the behavioural/molecular neuroscience community.
*Reviewer #3 (Evidence, reproducibility and clarity (Required)): *
__Summary: __
In the manuscript titled "Identifying regulators of associative learning using a protein-labelling approach in C. elegans" the authors attempted to generate a snapshot of the proteomic changes that happen in the C. elegans nervous system during learning and memory formation. They employed the TurboID-based protein labeling method to identify the proteins that are uniquely found in samples that underwent training to associate no-salt with food, and consequently exhibited lower attraction to high salt in a chemotaxis assay. Using this system they obtained a list of target proteins that included proteins represented in molecular pathways previously implicated in associative learning. The authors then further validated some of the hits from the assay by testing single gene mutants for effects on learning and memory formation.
Major Comments:
In the discussion section, the authors comment on the sources of "background noise" in their data and ways to improve the specificity. They provide some analysis on this aspect in Supplementary figure S2. However, a better visualization of non-specificity in the sample could be a GO analysis of tissue-specificity, and presented as a pie chart as in Figure 2A. Non-neuronal proteins such as MYO-2 or MYO-3 repeatedly show up on the "TurboID trained" lists in several biological replicates (Tables S2 and S3). If a major fraction of the proteins after subtraction of control lists are non-specific, that increases the likelihood that the "hits" observed are by chance. This analysis should be presented in one of the main figures as it is essential for the reader to gauge the reliability of the experiment.
We agree with this assessment and thank Reviewer 3 for this constructive suggestion. In response, we have now incorporated a comprehensive tissue-specific analysis of the learning proteome in the revised manuscript. Using the single neuron RNA-Seq database CeNGEN, we identified the proportion of neuronal vs non-neuronal proteins from each biological replicate of mass spectrometry data. Specifically, we present __Table 1 on page 17 __(which we originally intended to include in the manuscript, but inadvertently left out), which shows that 87-95% (i.e. a large majority) of proteins identified across replicates corresponded to genes detected in neurons, supporting that the TurboID enzyme was able to target the neuronal proteome as expected. Table 1 is now described in the main text of the revised work on page 16.
In addition, we performed neuron-specific analyses using both the WormBase gene enrichment tool and the CeNGEN single-cell transcriptomic database, which we describe in detail on our response to Reviewer 1 Major Comment 2. To summarise, these analyses revealed enrichment of several neuron classes, including those previously implicated in associative learning (e.g., ASEL, AIB, RIS, AVK) as well as neurons not previously studied in this context (e.g., IL1, DA9, DVC) (summarised in Table S7). By examining expression overlap across neuron types, we identified shared and distinct profiles that suggest potential functional connectivity and candidate circuits underlying behavioural plasticity (Figure 4). Taken together, these data show that the proteins identified in our dataset are (1) neuronal and (2) expressed in neurons that are known to be required for learning. Methods are detailed on pages 50-51.
Other than the above, the authors have provided sufficient details in their experimental and analysis procedures. They have performed appropriate controls, and their data has sufficient biological and technical replaictes for statistical analysis.
We appreciate this positive feedback and thank the Reviewer for acknowledging the clarity of our experimental and analysis procedures.
Minor Comments:
There is an error in the first paragraph of the discussion, in the sentences discussing the learning effects in gar-1 mutant worms. The sentences in lines 12-16 on page 22 says that gar-1 mutants have improved salt-associative learning and defective salt-aversive learning, while in fact the data and figures state the opposite.
We appreciate the Reviewer noting this discrepancy. As clarified in our response to Reviewer 1, Major Comment 1 above, we reanalysed the behavioural data to ensure consistency across genotypes by comparing only those tested within the same biological replicates (thus having the same N for all genotypes). Upon this reanalysis, we found that the previously reported phenotype for gar-1 mutants in salt-associative learning was not statistically different from wild-type controls. Therefore, we have removed references to GAR-1 from the manuscript.
__*Reviewer #3 (Significance (Required)): *__Strengths and limitations: This study used neuron-specific TurboID expression with transient biotin exposure to capture a temporally restricted snapshot of the C. elegans nervous system proteome during salt-associative learning. This is an elegant method to identify proteins temporally specific to a certain condition. However, there are several limitations in the way the experiments and analyses were performed which affect the reliability of the data. As the authors themselves have noted in the discussion, background noise is a major issue and several steps could be taken to improve the noise at the experimental or analysis steps (use of integrated C. elegans lines to ensure uniformity of samples, flow cytometry to isolate neurons, quantitative mass spec to detect fold change vs. strict presence/absence). Advance: Several studies have demonstrated the use of proximity labeling to map the interactome by using a bait protein fusion. In fact, expressing TurboID not fused to a bait protein is often used as a negative control in proximity labeling experiments. However, this study demonstrates the use of free TurboID molecules to acquire a global snapshot of the proteome under a given condition. Audience: Even with the significant limitations, this study is specifically of interest to researchers interested in understanding learning and memory formation. Broadly, the methods used in this study could be modified to gain insights into the proteomic profiles at other transient developmental stages. The reviewer's field of expertise: Cell biology of C. elegans neurons.
We thank the reviewer for their thoughtful evaluation of our work. We appreciate the recognition of the novelty and potential of using neuron-specific TurboID to capture a temporally restricted snapshot of the C. elegans nervous system proteome during learning. We agree that this approach offers a unique opportunity to identify proteins associated with specific behavioural states in future studies.
We also appreciate the reviewer’s comments regarding limitations in experimental and analytical design. In revising the manuscript, we have taken several steps to address these concerns and improve the clarity, rigour, and interpretability of our data. Specifically:
- We now provide a frequency-based representation of proteomic hits (Table 2), which helps clarify how candidate proteins were selected and highlights differences between trained and control groups.
- We have added neuron-specific enrichment analyses using both WormBase and CenGEN databases (Table S7 & Figure 4), which help identify candidate neurons and potential circuits involved in learning (methods on pages 50-51).
- We have clarified the rationale for using qualitative proteomics in the context of TurboID, in addition to acknowledging the challenges of integrating quantitative mass spectrometry with biotin-based enrichment (page 39). Additional methods for improving sample purity, such as using integrated lines or FACS-enrichment of neurons, could further refine this approach in future studies. For transparency, we did attempt to integrate the TurboID transgenic line to improve the strength and consistency of biotinylation signals. However, despite four rounds of backcrossing, this line exhibited unexpected phenotypes, including a failure to respond reliably to the established training protocol. As a result, we were unable to include it in the current study. Nonetheless, we believe our current approach provides a valuable proof-of-concept and lays the groundwork for future refinement. By addressing the major concerns of peer reviewers, we believe our study makes a significant and impactful contribution by demonstrating the feasibility of using TurboID to capture learning-induced proteomic changes in the nervous system. The identification of novel learning-related mutants, including those involved in acetylcholine signalling and cAMP pathways, provides new directions for future research into the molecular and circuit-level mechanisms of behavioural plasticity.
*Reviewer #4 (Evidence, reproducibility and clarity (Required)): *
Summary:
In this manuscript, authors used a learning paradigm in C. elegans; when worms were fed in a saltless plate, its chemotaxis to salt is greatly reduced. To identify learning-related proteins, authors employed nervous system-specific transcriptome analysis to compare whole proteins in neurons between high-salt-fed animals and saltless-fed animals. Authors identified "learning-specific genes" which are observed only after saltless feeding. They categorized these proteins by GO analyses and pathway analyses, and further stepped forward to test mutants in selected genes identified by the proteome analysis. They find several mutants that are defective or hyper-proficient for learning, including acc-1/3 and lgc-46 acetylcholine receptors, gar-1 acetylcholine receptor GPCR, glna-3 glutaminase involved in glutamate biosynthesis, and kin-2, a cAMP pathway gene. These mutants were not previously reported to have abnormality in the learning paradigm.
Major comments:
- There are problems in the data processing and presentation of the proteomics data in the current manuscript which deteriorates the utility of the data. First, as the authors discuss (page 24, lines 5-12), the current approach does not consider amount of the peptides. Authors state that their current approach is "conservative", because some of the proteins may be present in both control and learned samples but in different amounts. This reviewer has a concern in the opposite way: some of the identified proteins may be pseudo-positive artifacts caused by the analytical noise. The problem is that authors included peptides that are "present" in "TurboID, trained" sample but "absent" in the "Non-Tg, trained" and "TurboID, control" samples in any one of the biological replicates, to identify "learning proteome" (706 proteins, page 8, last line - page 9, line 8; page 32, line 21-22). The word "present" implies that they included even peptides whose amounts are just above the detection threshold, which is subject to random noise caused by the detector or during sample collection and preparation processes. This consideration is partly supported by the fact that only a small fraction of the proteins are common between biological replicates (honestly and respectably shown in Figure S2). Because of this problem, there is no statistical estimate of the identity in "learning proteome" in the current manuscript. Therefore, the presentation style in Tables S2 and S3 are not very useful for readers, especially because authors already subtracted proteins identified in Non-Tg samples, which must also suffer from stochastic noise. I suggest either quantifying the MS/MS signal, or if authors need to stick to the "present"/"absent" description of the MS/MS data, use the number of appearances in biological replicates of each protein as estimate of the quantity of each protein. For example, found in 2 replicates in "TurboID, learned" and in 0 replicates in "Non-Tg, trained". One can apply statistics to these counts. This said, I would like to stress that proteins related to acquisition of memory may be very rare, especially because learning-related changes likely occur in a small subset of neurons. Therefore, 1 time vs 0 time may be still important, as well as something like 5 times vs 1 time. In summary, quantitative description of the proteomics results is desired.
We thank the reviewer for these valuable comments and suggestions.
We acknowledge that quantitative proteomics would provide beneficial information; however, as also indicated by Reviewer 1 (in cross-comment), it is practically challenging to perform with TurboID. We have included discussion of potential future experiments involving quantitative mass spectrometry, as well as a comprehensive discussion of some of the limitations of our approach as summarised by this Reviewer, in the Discussion section (page 39). However, we note that our qualitative approach also provides beneficial knowledge, such as the identification of functional protein networks acting within biological pathways previously implicated in learning (Figure 2), and novel learning regulators ACC-1/3, LGC-46, and F46H5.3.
We agree with the assessment that the frequency of occurrence for each candidate we test per biological replicate is useful to disclose in the manuscript as a proxy for quantification. This was also highlighted by Reviewer 2 (Major Comment 1). As detailed above in response to R2, we have now separated candidates into two categories: ‘strong’ (present in 3 or more biological replicates) and ‘weak’ candidates (present in 2 or fewer biological replicates). We have also added behavioural data after testing 9 of these strong candidates in Figures 6 & S7.
We have also added Table 2 to the revised manuscript, which summarises the frequency-based representation of the proteomics results, as suggested. This is described on pages 22-23. Briefly, this shows the range of candidates further explored using single mutant testing. Specifically, this data showed that many of the tested candidates were more frequently detected in trained worms compared to high-salt controls. This includes both strong and weak candidates, providing a clearer view of how proteomic frequency informed our selection for functional testing.
- There is another problem in the treatment of the behavioural data. In Experimental Procedures, authors state that they excluded data in which naive or control groups showed average CI 0.5499 for N2 (page 36, lines 5-7). How were these values determined? One common example for judging a data point as an outlier is > mean + 1.5, 2 or 3 SD, or Thank you for pointing this out. As mentioned by both Reviewer 1 and Reviewer 4, the original manuscript states the following: “Data was excluded for salt associative learning experiments when wild-type N2 displayed (1) an average CI ≤ 0.6499 for naïve or control groups and/or (2) an average CI either 0.5499 for trained groups.”
To clarify, we only excluded experiments in rare cases where N2 worms did not display robust high salt attraction before training, or where trained N2 did not display the expected behavioural difference compared to untrained or high-salt control N2. These anomalies were typically attributable to clear contamination or starvation issues that could clearly be observed prior to counting chemotaxis indices on CTX plates.
We established these exclusion criteria in advance of conducting multiple learning assays to ensure an objective threshold for identifying and excluding assays affected by these rare but observable issues. However, these criteria were later found to be unnecessary, as N2 worms robustly displayed the expected untrained and trained phenotypes for salt associative learning when not compromised by starvation or contamination.
We understand that the original criteria may have appeared to introduce arbitrary bias in data selection. To address this concern, we have removed these criteria from the revised manuscript from page 50.
Minor comments:
- Related to Major comments 1), the successful effect of neuron-specific TurboID procedure was not evaluated. Authors obtained both TurboID and Non-Tg proteome data. Do they see enrichment of neuron-specific proteins? This can be easily tested, for example by using the list of neuron-specific genes by Kaletsky et al. (http://dx.doi.org/10.1038/nature16483 or http://dx.doi.org/10.1371/journal.pgen.1007559), or referring to the CenGEN data.
We thank this Reviewer for this helpful suggestion, which was echoed by Reviewer 3 (Major Comment 1). As indicated in the response to R3 above, the revised manuscript now includes Table 1 as a tissue-specific analysis of the learning proteome, using the single neuron RNA-Seq database CeNGEN to identify the proportion of neuronal proteins from each biological replicate of mass spectrometry data. Generally, we observed a range of 87-95% of proteins corresponded to genes from the CeNGEN database that had been detected in neurons, providing evidence that the TurboID enzyme was able to target the neuronal proteome as expected. Table 1 is now described in the main text of the revised work on pages 16 & 17.
- The behavioural paradigm needs to be described accurately. Page 5, line 16-17, "C. elegans normally have a mild attraction towards higher salt concentration": in fact, C. elegans raised on NGM plates, which include approximately 50mM of NaCl, is attracted to around 50mM of NaCl (Kunitomo et al., Luo et al.) but not 100-200 mM.
We thank the Reviewer for pointing this out. We agree that clarification is necessary. The revised text reads as follows on page 5: “C. elegans are typically grown in the presence of salt (usually ~ 50 mM) and display an attraction toward this concentration when assayed for chemotaxis behaviour on a salt gradient (Kunitomo et al., 2013, Luo et al., 2014). Training/conditioning with ‘no salt + food’ partially attenuates this attraction (group referred to ‘trained’).”
Authors call this assay "salt associative learning", which refers to the fact that worms associate salt concentration (CS) and either presence or absence of food (appetitive or aversive US) during conditioning (Kunitomo et al., Luo et al., Nagashima et al.) but they are looking at only association with presence of food, and for proteome analysis they only change the CS (NaCl concentration, as discussed in Discussion, p24, lines 4-5). It is better to attempt to avoid confusion to the readers in general.
Thank you Reviewer 4 for highlighting this clarity issue. We clarify our definition of “salt associative learning” for the purpose of this study in the revised manuscript on page 6 with the following text:
“Similar behavioural paradigms involving pairings between salt/no salt and food/no food have been previously described in the literature (Nagashima et al. 2019). Here, learning experiments were performed by conditioning worms with either ‘no salt + food’ (referred to as ‘salt associative learning’) or ‘salt + no food’ (called ‘salt aversive learning’).”
- page 32, line 23: the wording "excluding" is obscure and misleading because the elo-6 gene was included in the analysis.
We appreciate this Reviewer for pointing out this misleading comment, which was unintentional. We have now removed it from the text (on page 21).
- Typo at page 24, line 18: "that ACC-1" -> "than ACC-1".
This has been corrected (on page 37).
- Reference. In "LEO, T. H. T. et al.", given and sir names are flipped for all authors. Also, the paper has been formally published (http://dx.doi.org/10.1016/j.cub.2023.07.041).
We appreciate the Reviewer drawing our attention to this – the reference has been corrected and updated.
I would like to express my modest cross comments on the reviews:
- Many of the reviewers comment on the shortage in the quantitative nature of the proteome analysis, so it seems to be a consensus.
Thank you Reviewer 4 for this feedback. We appreciate the benefit in performing quantitative mass spectrometry, in that it provides an additional way to parse molecular mechanisms in a biological process (e.g., fold-changes in protein expression induced by learning). However, we note that quantitative mass spectrometry is challenging to integrate with TurboID due to the requirement to enrich for biotinylated peptides during sample processing (we now mention this on page 39). Nevertheless, it would be exciting to see this approach performed in a future study.
To address the limitations of our original qualitative approach and enhance the clarity and utility of our dataset, we have made the following revisions in the manuscript:
- Candidate selection criteria: We now clearly define how candidates were selected for functional testing, based on their frequency across biological replicates. Specifically, “strong candidates” were detected in three or more replicates, while “weak candidates” appeared in two or fewer.
- __Frequency-based representation (____Table 2____):__We appreciate the suggestion by Reviewer 4 (Major Comment 1) to quantify differences between high-salt control and trained groups. We now provide the frequency-based representation of the candidates tested in this study within our proteomics data in Table 2. This data showed that many of the tested candidates were more frequently detected in trained worms compared to high-salt controls. This includes both strong and weak candidates We hope these additions help clarify our approach and demonstrate the value of the dataset, even within the constraints of qualitative proteomics.
- Also, tissue- or cell-specificity of the identified proteins were commonly discussed. In reviewer #3's first Major comment, appearance of non-neuronal protein in the list was pointed out, which collaborate with my (#4 reviewer's) question on successful identification of neuronal proteins by this method. On the other hand, reviewer #1 pointed out subset neuron-specific proteins in the list. Obviously, these issues need to be systematically described by the authors.
We agree with Reviewer 4 that these analyses provide a critical angle of analysis that is not explored in the original manuscript.
Tissue analysis (Reviewer 3 Major Comment 1): We have used the single neuron RNA-Seq database CeNGEN, to identify that 87-95% (i.e. a large majority) of proteins identified across replicates corresponded to genes detected in neurons. These findings support that the TurboID enzyme was able to target the neuronal proteome as expected. Table 1 provides this information as is now described in the main text of the revised work on page 16.
__Neuron class analyses (Reviewer 1 Major Comment 2): __In response, we have used the suggested Wormbase gene enrichment tool and CeNGEN. We specifically input proteins from the learning proteome into Wormbase, after filtering for proteins unique to TurboID trained animals. For CeNGEN, we compared genes/proteins from control worms and trained worms to identify potential neurons that may be involved in this learning paradigm.
Briefly, we found highlight a range of neuron classes known in learning (e.g., RIS interneurons), cells that affect behaviour but have not been explored in learning (e.g., IL1 polymodal neurons), and neurons for which their function/s are unknown (e.g., pharyngeal neuron I3). Corresponding text for this new analysis has been added on pages 16-20, with a new table and figure added to illustrate these findings (Table S7 & Figure 4). Methods are detailed on pages 50-51.
- Given reviewer #1's OPTIONAL Major comment, as an expert of behavioral assays in C. elegans, I would like to comment based on my experience that mutants received from Caenorhabditis Genetics Center or other labs often lose the phenotype after outcrossing by the wild type, indicating that a side mutation was responsible for the observed behavioral phenotype. Therefore, outcrossing may be helpful and easier than rescue experiments, though the latter are of course more accurate.
Thank you for this suggestion. To address the potential involvement of background mutations, we have done experiments with backcrossed versions of mutants tested where possible, as shown in Figure 6. We found that F46H5.3(-) mutants maintained enhanced learning capacity after backcrossing with wild type, compared to their non-backcrossed mutant line. This was in contrast to C30G12.6(-) animals which lost their enhanced learning phenotype following backcrossing using wild type worms. This is described in the text on pages 24-26.
- Just let me clarify the first Minor comment by reviewer #2. Authors described that the kin-2 mutant has abnormality in "salt associative learning" and "salt aversive learning", according to authors' terminology. In this comment by reviewer #2, "gustatory associative learning" probably refers to both of these assays.
Reviewer 4 is correct. We have amended the wording appropriately on page 31 to clarify our meaning to address Reviewer 2’s comment.
- “Although kin-2(ce179) mutants were not shown to impact salt aversive learning, they have been reported previously to display impaired intermediate-term memory (but intact learning and short-term memory) for butanone appetitive learning (Stein and Murphy, 2014).”*
- There seem to be several typos in reviewer #1's Minor comments.
"In Page 9, Lines 17-18" -> "Page 8, Lines 17-18".
"Page 8, Line 24" -> "Page 7, Line 24".
"I would suggest to remove figure 3" -> "I would suggest to remove figure 2"
"summary figure similar to Figure 4" -> "summary figure similar to Figure 3"
"In the discussion Page 24, Line 14" -> "In the discussion Page 23, Line 14"
(I note that because a top page was inserted in the "merged" file but not in art file for review, there is a shift between authors' page numbers and pdf page numbers in the former.)
It would be nice if reviewer #1 can confirm on these because I might be wrong.
We appreciate Reviewer 4 noting this, and can confirm that these are the correct references (as indicated by Reviewer 1 in their cross-comments)
*Reviewer #4 (Significance (Required)): *
- Total neural proteome analysis has not been conducted before for learning-induced changes, though transcriptome analysis has been performed for odor learning (Lakhina et al., http://dx.doi.org/10.1016/j.neuron.2014.12.029). This guarantees the novelty of this manuscript, because for some genes, protein levels may change even though mRNA levels remain the same. We note an example in which a proteome analysis utilizing TurboID, though not the comparison between trained/control, has led to finding of learning related proteins (Hiroki et al., http://dx.doi.org/10.1038/s41467-022-30279-7). As described in the Major comments 1) in the previous section, improvement of data presentation will be necessary to substantiate this novelty.
We appreciate this thoughtful feedback. We agree that while the neuronal transcriptome has been explored in Lakhina et al., 2015 for C. elegans in the context of memory, our study represents the first to examine learning-induced changes in the total neuronal proteome. We particularly agree with the statement that “for some genes, protein levels may change even though mRNA levels remain the same”. This is essential rationale that we now discuss on page 42.
Additionally, we acknowledge the relevance of the study by Hiroki et al., 2022, which used TurboID to identify learning-related proteins, though not in a trained versus control comparison. Our work builds on this by directly comparing trained and control conditions, thereby offering new insights into the proteomic landscape of learning. This is now clarified on page 36.
To substantiate the novelty and significance of our approach, we have revised the data presentation throughout the manuscript, including clearer candidate selection criteria, frequency-based representation of proteomic hits (Table 2), and neuron-specific enrichment analyses (Table S7 & Figure 4). We hope these improvements help convey the unique contribution of our study to the field.
- Authors found six mutants that have abnormality in the salt learning (Fig. 4). These genes have not been described to have the abnormality, providing novel knowledge to the readers, especially those who work on C. elegans behavioural plasticity. Especially, involvement of acetylcholine neurotransmission has not been addressed. Although site of action (neurons involved) has not been tested in this manuscript, it will open the venue to further determine the way in which acetylcholine receptors, cAMP pathway etc. influences the learning process.
Thank you Reviewer 4, for this encouraging feedback. To further strengthen the study and expand its relevance, we have tested additional mutants in response to Reviewer 3’s comments, as shown in Figures 6 & S7. These results provide even more candidate genes and pathways for future exploration, enhancing the significance and impact of our study.
-
Note: This preprint has been reviewed by subject experts for Review Commons. Content has not been altered except for formatting.
Learn more at Review Commons
Referee #4
Evidence, reproducibility and clarity
Summary:
In this manuscript, authors used a learning paradigm in C. elegans; when worms were fed in a saltless plate, its chemotaxis to salt is greatly reduced. To identify learning-related proteins, authors employed nervous system-specific transcriptome analysis to compare whole proteins in neurons between high-salt-fed animals and saltless-fed animals. Authors identified "learning-specific genes" which are observed only after saltless feeding. They categorized these proteins by GO analyses and pathway analyses, and further stepped forward to test mutants in selected genes identified by the proteome analysis. They find several …
Note: This preprint has been reviewed by subject experts for Review Commons. Content has not been altered except for formatting.
Learn more at Review Commons
Referee #4
Evidence, reproducibility and clarity
Summary:
In this manuscript, authors used a learning paradigm in C. elegans; when worms were fed in a saltless plate, its chemotaxis to salt is greatly reduced. To identify learning-related proteins, authors employed nervous system-specific transcriptome analysis to compare whole proteins in neurons between high-salt-fed animals and saltless-fed animals. Authors identified "learning-specific genes" which are observed only after saltless feeding. They categorized these proteins by GO analyses and pathway analyses, and further stepped forward to test mutants in selected genes identified by the proteome analysis. They find several mutants that are defective or hyper-proficient for learning, including acc-1/3 and lgc-46 acetylcholine receptors, gar-1 acetylcholine receptor GPCR, glna-3 glutaminase involved in glutamate biosynthesis, and kin-2, a cAMP pathway gene. These mutants were not previously reported to have abnormality in the learning paradigm.
Major comments:
- There are problems in the data processing and presentation of the proteomics data in the current manuscript which deteriorates the utility of the data. First, as the authors discuss (page 24, lines 5-12), the current approach does not consider amount of the peptides. Authors state that their current approach is "conservative", because some of the proteins may be present in both control and learned samples but in different amounts. This reviewer has a concern in the opposite way: some of the identified proteins may be pseudo-positive artifacts caused by the analytical noise. The problem is that authors included peptides that are "present" in "TurboID, trained" sample but "absent" in the "Non-Tg, trained" and "TurboID, control" samples in any one of the biological replicates, to identify "learning proteome" (706 proteins, page 8, last line - page 9, line 8; page 32, line 21-22). The word "present" implies that they included even peptides whose amounts are just above the detection threshold, which is subject to random noise caused by the detector or during sample collection and preparation processes. This consideration is partly supported by the fact that only a small fraction of the proteins are common between biological replicates (honestly and respectably shown in Figure S2). Because of this problem, there is no statistical estimate of the identity in "learning proteome" in the current manuscript. Therefore, the presentation style in Tables S2 and S3 are not very useful for readers, especially because authors already subtracted proteins identified in Non-Tg samples, which must also suffer from stochastic noise. I suggest either quantifying the MS/MS signal, or if authors need to stick to the "present"/"absent" description of the MS/MS data, use the number of appearances in biological replicates of each protein as estimate of the quantity of each protein. For example, found in 2 replicates in "TurboID, learned" and in 0 replicates in "Non-Tg, trained". One can apply statistics to these counts. This said, I would like to stress that proteins related to acquisition of memory may be very rare, especially because learning-related changes likely occur in a small subset of neurons. Therefore, 1 time vs 0 time may be still important, as well as something like 5 times vs 1 time. In summary, quantitative description of the proteomics results is desired.
- There is another problem in the treatment of the behavioural data. In Experimental Procedures, authors state that they excluded data in which naive or control groups showed average CI < 0.6499, and/or trained groups showed average CI < -0.0499 or > 0.5499 for N2 (page 36, lines 5-7). How were these values determined? One common example for judging a data point as an outlier is > mean + 1.5, 2 or 3 SD, or < mean - 1.5, 2 or 3 SD. Are these values any of these standards, or determined through other methods? If these values were determined simply by authors' decision, it could potentially introduce a bias and in the worst cases lead to incorrect conclusions. A related question is: authors state "trained animals showed a lower CI (~0.3)" where in the referred Figure 1B, the corresponding data shows averages close to 0. Why is the inconsistency? The assay that authors use is close to those described in the previous literature (Kunitomo et al., http://dx.doi.org/10.1038/ncomms3210). In this previous paper, it was described that animals conditioned under no salt with food show negative CI and are attracted to the low salt concentration area. Quantitative analysis of behavioural patterns showed migration bias towards lower salt concentrations (negative chemotaxis). Essentially the same concept was reported by Luo et al. (http://dx.doi.org/10.1016/j.neuron.2014.05.010). The experimental procedure employed in the current work is very similar with those by the Japanese group, with a notable difference: the chemotaxis assay plate included 50mM NaCl in Kunitomo et al, while authors used chemotaxis plate without added NaCl (p35, line 18). The latter is expected to cause shallow gradient towards the low-salt area, which may be the reason for the weak negative CI in the trained animals. In any case, the value of CI itself is not a problem, and authors' current assay is valid. The only concern of mine is the potential of author-introduced cognitive bias, possibly affecting, for example, whether a certain mutant has a significant defect or not. What happens if the cut-offs of -0.0499 and 0.5499 are omitted and all data were included in the analyses? What are the average CIs of N2 in all performed experiments for each of naive, control and trained groups?
Minor comments:
- Related to Major comments 1), the successful effect of neuron-specific TurboID procedure was not evaluated. Authors obtained both TurboID and Non-Tg proteome data. Do they see enrichment of neuron-specific proteins? This can be easily tested, for example by using the list of neuron-specific genes by Kaletsky et al. (http://dx.doi.org/10.1038/nature16483 or http://dx.doi.org/10.1371/journal.pgen.1007559), or referring to the CenGEN data.
- The behavioural paradigm needs to be described accurately. Page 5, line 16-17, "C. elegans normally have a mild attraction towards higher salt concentration": in fact, C. elegans raised on NGM plates, which include approximately 50mM of NaCl, is attracted to around 50mM of NaCl (Kunitomo et al., Luo et al.) but not 100-200 mM. Authors call this assay "salt associative learning", which refers to the fact that worms associate salt concentration (CS) and either presence or absence of food (appetitive or aversive US) during conditioning (Kunitomo et al., Luo et al., Nagashima et al.) but they are looking at only association with presence of food, and for proteome analysis they only change the CS (NaCl concentration, as discussed in Discussion, p24, lines 4-5). It is better to attempt to avoid confusion to the readers in general.
- page 32, line 23: the wording "excluding" is obscure and misleading because the elo-6 gene was included in the analysis.
- Typo at page 24, line 18: "that ACC-1" -> "than ACC-1".
- Reference. In "LEO, T. H. T. et al.", given and sir names are flipped for all authors. Also, the paper has been formally published (http://dx.doi.org/10.1016/j.cub.2023.07.041).
Cross-Commenting
I would like to express my modest cross comments on the reviews:
- Many of the reviewers comment on the shortage in the quantitative nature of the proteome analysis, so it seems to be a consensus.
- Also, tissue- or cell-specificity of the identified proteins were commonly discussed. In reviewer #3's first Major comment, appearance of non-neuronal protein in the list was pointed out, which collaborate with my (#4 reviewer's) question on successful identification of neuronal proteins by this method. On the other hand, reviewer #1 pointed out subset neuron-specific proteins in the list. Obviously, these issues need to be systematically described by the authors.
- Given reviewer #1's OPTIONAL Major comment, as an expert of behavioral assays in C. elegans, I would like to comment based on my experience that mutants received from Caenorhabditis Genetics Center or other labs often lose the phenotype after outcrossing by the wild type, indicating that a side mutation was responsible for the observed behavioral phenotype. Therefore, outcrossing may be helpful and easier than rescue experiments, though the latter are of course more accurate.
- Just let me clarify the first Minor comment by reviewer #2. Authors described that the kin-2 mutant has abnormality in "salt associative learning" and "salt aversive learning", according to authors' terminology. In this comment by reviewer #2, "gustatory associative learning" probably refers to both of these assays.
- There seem to be several typos in reviewer #1's Minor comments. "In Page 9, Lines 17-18" -> "Page 8, Lines 17-18". "Page 8, Line 24" -> "Page 7, Line 24". "I would suggest to remove figure 3" -> "I would suggest to remove figure 2" "summary figure similar to Figure 4" -> "summary figure similar to Figure 3" "In the discussion Page 24, Line 14" -> "In the discussion Page 23, Line 14" (I note that because a top page was inserted in the "merged" file but not in art file for review, there is a shift between authors' page numbers and pdf page numbers in the former.) It would be nice if reviewer #1 can confirm on these because I might be wrong.
Significance
- Total neural proteome analysis has not been conducted before for learning-induced changes, though transcriptome analysis has been performed for odor learning (Lakhina et al., http://dx.doi.org/10.1016/j.neuron.2014.12.029). This guarantees the novelty of this manuscript, because for some genes, protein levels may change even though mRNA levels remain the same. We note an example in which a proteome analysis utilizing TurboID, though not the comparison between trained/control, has led to finding of learning related proteins (Hiroki et al., http://dx.doi.org/10.1038/s41467-022-30279-7). As described in the Major comments 1) in the previous section, improvement of data presentation will be necessary to substantiate this novelty.
- Authors found six mutants that have abnormality in the salt learning (Fig. 4). These genes have not been described to have the abnormality, providing novel knowledge to the readers, especially those who work on C. elegans behavioural plasticity. Especially, involvement of acetylcholine neurotransmission has not been addressed. Although site of action (neurons involved) has not been tested in this manuscript, it will open the venue to further determine the way in which acetylcholine receptors, cAMP pathway etc. influences the learning process.
-
Note: This preprint has been reviewed by subject experts for Review Commons. Content has not been altered except for formatting.
Learn more at Review Commons
Referee #3
Evidence, reproducibility and clarity
Summary:
In the manuscript titled "Identifying regulators of associative learning using a protein-labelling approach in C. elegans" the authors attempted to generate a snapshot of the proteomic changes that happen in the C. elegans nervous system during learning and memory formation. They employed the TurboID-based protein labeling method to identify the proteins that are uniquely found in samples that underwent training to associate no-salt with food, and consequently exhibited lower attraction to high salt in a chemotaxis assay. Using this system they obtained a list of target proteins that included proteins represented in …
Note: This preprint has been reviewed by subject experts for Review Commons. Content has not been altered except for formatting.
Learn more at Review Commons
Referee #3
Evidence, reproducibility and clarity
Summary:
In the manuscript titled "Identifying regulators of associative learning using a protein-labelling approach in C. elegans" the authors attempted to generate a snapshot of the proteomic changes that happen in the C. elegans nervous system during learning and memory formation. They employed the TurboID-based protein labeling method to identify the proteins that are uniquely found in samples that underwent training to associate no-salt with food, and consequently exhibited lower attraction to high salt in a chemotaxis assay. Using this system they obtained a list of target proteins that included proteins represented in molecular pathways previously implicated in associative learning. The authors then further validated some of the hits from the assay by testing single gene mutants for effects on learning and memory formation.
Major comments:
In the discussion section, the authors comment on the sources of "background noise" in their data and ways to improve the specificity. They provide some analysis on this aspect in Supplementary figure S2. However, a better visualization of non-specificity in the sample could be a GO analysis of tissue-specificity, and presented as a pie chart as in Figure 2A. Non-neuronal proteins such as MYO-2 or MYO-3 repeatedly show up on the "TurboID trained" lists in several biological replicates (Tables S2 and S3). If a major fraction of the proteins after subtraction of control lists are non-specific, that increases the likelihood that the "hits" observed are by chance. This analysis should be presented in one of the main figures as it is essential for the reader to gauge the reliability of the experiment.
Other than the above, the authors have provided sufficient details in their experimental and analysis procedures. They have performed appropriate controls, and their data has sufficient biological and technical replaictes for statistical analysis.
Minor comments:
There is an error in the first paragraph of the discussion, in the sentences discussing the learning effects in gar-1 mutant worms. The sentences in lines 12-16 on page 22 says that gar-1 mutants have improved salt-associative learning and defective salt-aversive learning, while in fact the data and figures state the opposite.
Significance
Strengths and limitations:
This study used neuron-specific TurboID expression with transient biotin exposure to capture a temporally restricted snapshot of the C. elegans nervous system proteome during salt-associative learning. This is an elegant method to identify proteins temporally specific to a certain condition. However, there are several limitations in the way the experiments and analyses were performed which affect the reliability of the data. As the authors themselves have noted in the discussion, background noise is a major issue and several steps could be taken to improve the noise at the experimental or analysis steps (use of integrated C. elegans lines to ensure uniformity of samples, flow cytometry to isolate neurons, quantitative mass spec to detect fold change vs. strict presence/absence).
Advance:
Several studies have demonstrated the use of proximity labeling to map the interactome by using a bait protein fusion. In fact, expressing TurboID not fused to a bait protein is often used as a negative control in proximity labeling experiments. However, this study demonstrates the use of free TurboID molecules to acquire a global snapshot of the proteome under a given condition.
Audience:
Even with the significant limitations, this study is specifically of interest to researchers interested in understanding learning and memory formation. Broadly, the methods used in this study could be modified to gain insights into the proteomic profiles at other transient developmental stages.
The reviewer's field of expertise: Cell biology of C. elegans neurons.
-
Note: This preprint has been reviewed by subject experts for Review Commons. Content has not been altered except for formatting.
Learn more at Review Commons
Referee #2
Evidence, reproducibility and clarity
Summary:
In this study by Rahmani in colleagues, the authors sought to define the "learning proteome" for a gustatory associative learning paradigm in C. elegans. Using a cytoplasmic TurboID expressed under the control of a pan-neuronal promoter, the authors labeled proteins during the training portion of the paradigm, followed by proteomics analysis. This approach revealed hundreds of proteins potentially involved in learning, which the authors describe using gene ontology and pathways analysis. The authors performed functional characterization of some of these genes for their requirement in learning using the same paradigm. They …
Note: This preprint has been reviewed by subject experts for Review Commons. Content has not been altered except for formatting.
Learn more at Review Commons
Referee #2
Evidence, reproducibility and clarity
Summary:
In this study by Rahmani in colleagues, the authors sought to define the "learning proteome" for a gustatory associative learning paradigm in C. elegans. Using a cytoplasmic TurboID expressed under the control of a pan-neuronal promoter, the authors labeled proteins during the training portion of the paradigm, followed by proteomics analysis. This approach revealed hundreds of proteins potentially involved in learning, which the authors describe using gene ontology and pathways analysis. The authors performed functional characterization of some of these genes for their requirement in learning using the same paradigm. They also compared the requirement for these genes across various learning paradigms, and found that most hits they characterized appear to be specifically required for the training paradigm used for generating the "learning proteome".
Major Comments:
- The definition of a "hit" from the TurboID approach is does not appear stringent enough. According to the manuscript, a hit was defined as one unique peptide detected in a single biological replicate (out of 5), which could give rise to false positives. In figure S2, it is clear that there relatively little overlap between samples with regards to proteins detected between replicates, and while perhaps unintentional, presenting a single unique peptide appears to be an attempt to inflate the number of hits. Defining hits as present in more than one sample would be more rigorous. Changing the definition of hits would only require the time to re-list genes and change data presented in the manuscript accordingly.
- The "hits" that the authors chose to functionally characterize do not seem like strong candidate hits based on the proteomics data that they generated. Indeed, most of the hits are present in a single, or at most 2, biological replicate. It is unclear as to why the strongest hits were not characterized, which if mutant strains are publicly available, would not be a difficult experiment to perform. Because of the lack of strong evidence that these are indeed proteins regulated in the context of learning based on proteomics, including evidence of changes in the proteins (by imaging expression changes of fluorescent reporters or a biochemical approach), would increase confidence that these hits are genuine.
Minor Comments:
- The authors highlight that the proteins they discover seem to function uniquely in their gustatory associative paradigm, but this is not completely accurate. kin-2, which they characterize in figure 4, is required for positive butanone association (the authors even say as much in the manuscript) in Stein and Murphy, 2014.
Significance
- General Assessment: The approach used in this study is interesting and has the potential to further our knowledge about the molecular mechanisms of associative behaviors. Strengths of the study include the design with carefully thought out controls, and the premise of combining their proteomics with behavioral analysis to better understand the biological significance of their proteomics findings. However, the criteria for defining hits and prioritization of hits for behavioral characterizations were major wweaknesses of the paper.
- Advance: There have been multiple transcriptomic studies in the worm looking at gene expression changes in the context of behavioral training (Lakhina et al., 2015, Freytag 2017). This study compliments and extends those studies, by examining how the proteome changes in a different training paradigm. This approach here could be employed for multiple different training paradigms, presenting a new technical advance for the field.
- Audience: This paper would be of interest to the broader field of behavioral and molecular neuroscience. Though it uses an invertebrate system, many findings in the worm regarding learning and memory translate to higher organisms.
- I am an expert in molecular and behavioral neuroscience in both vertebrate and invertebrate models, with experience in genetics and genomics approaches.
-
Note: This preprint has been reviewed by subject experts for Review Commons. Content has not been altered except for formatting.
Learn more at Review Commons
Referee #1
Evidence, reproducibility and clarity
Summary:
Rahmani et al., utilize the TurboID method to characterize the global proteome changes in the worm's nervous system induced by a salt-based associative learning paradigm. Altogether, Rahmani et al., uncover 706 proteins that are tagged by the TurboID method specifically in samples extracted from worms that underwent the memory inducing protocol. Next, the authors conduct a gene enrichment analysis that implicates specific molecular pathways in salt-associative learning, such as MAP-kinase and cAMP-mediated pathways. The authors then screen a representative group of the hits from the proteome analysis. The authors find that …
Note: This preprint has been reviewed by subject experts for Review Commons. Content has not been altered except for formatting.
Learn more at Review Commons
Referee #1
Evidence, reproducibility and clarity
Summary:
Rahmani et al., utilize the TurboID method to characterize the global proteome changes in the worm's nervous system induced by a salt-based associative learning paradigm. Altogether, Rahmani et al., uncover 706 proteins that are tagged by the TurboID method specifically in samples extracted from worms that underwent the memory inducing protocol. Next, the authors conduct a gene enrichment analysis that implicates specific molecular pathways in salt-associative learning, such as MAP-kinase and cAMP-mediated pathways. The authors then screen a representative group of the hits from the proteome analysis. The authors find that mutants of candidate genes from the MAP-kinase pathway, namely dlk-1 and uev-3, do not affect the performance in the learning paradigm. Instead multiple acetylcholine signaling mutants significantly affected the performance in the associative memory assay, e.g., acc-1, acc-3, gar-1, and lgc-46. Finally, the authors demonstrate that the acetylcholine signaling mutants did not exhibit a phenotype in similar but different conditioning paradigms, such as aversive salt-conditioning or appetitive odor conditioning, suggesting their effect is specific to appetitive salt conditioning.
Major comments:
- The statistical approach and analysis of the behavior assay:
- The authors use a 2-way ANOVA test which assumes normal distribution of the data. However, the chemotaxis index used in the study is bounded between -1 and 1, which prevents values near the boundaries to be normally distributed. Since most of the control data in this assay in this study is very close to 1, it strongly suggests that the CI data is not normally distributed and therefore 2-way ANOVA is expected to give skewed results. I am aware this is a common mistake and I also anticipate that most conclusions will still hold also under a more fitting statistical test. Nevertheless an appropriate statistical analysis should be performed. Since I assume the authors would wish to take into consideration both the different conditions and biological repeats, I can suggest two options:
- Using a Generalized linear mixed model, one can do with R software.
- Using a custom bootstrapping approach.
- The total number of assays, especially controls, varies quite a bit between the tested mutants. For example compare the acc-1 experiment in Figure 4.A., and gap-1 or rho-1 in Figure S4.A and D. It is hard to know the exact N of the controls, but I assume that for example, lowering the wild type control of acc-1 to equivalent to gap-1 would have made it non significant. Perhaps the best approach would be to conduct a power analysis, to know what N should be acquired for all samples.
- The authors use the phrasing "a non-significant trend", I find such claims uninterpretable and should be avoided. Examples: Page 16. Line 7 and Page 18, line 16.
- Neuron-specific analysis and rescue of mutants:
- Throughout the study the authors avoid focusing on specific neurons. This is understandable as the authors aim at a systems biology approach, however, in my view this limits the impact of the study. I am aware that the proteome changes analyzed in this study were extracted from a pan neuronally expressed TurboID. Yet, neuron-specific changes may nevertheless be found. For example, running the protein lists from Table S2, in the Gene enrichment tool of wormbase, I found, across several biological replicates, enrichment for the NSM, CAN and RIG neurons. A more careful analysis may uncover specific neurons that take part in this associative memory paradigm. In addition, analysis of the overlap in expression of the final gene list in different neurons, comparing them, looking for overlap and connectivity, would also help to direct towards specific circuits.
- OPTIONAL: A rescue of the phenotype of the mutants by re-expression of the gene is missing, this makes sure to avoid false-positive results coming from background mutations. For example, a pan neuronal or endogenous promoter rescue would help the authors to substantiate their claims, this can be done for the most promising genes. The ideal experiment would be a neuron-specific rescue but this can be saved for future works.
Minor comments:
1.Lack of clarity regarding the validation of the biotin tagging of the proteome. The authors show in Figure 1 that they validated that the combination of the transgene and biotin allows them to find more biotin-tagged proteins. However there is significant biotin background also in control samples as is common for this method. The authors mention they validated biotin tagging of all their experiments, but it was unclear in the text whether they validated it in comparison to no-biotin controls, and checked for the fold change difference. Also, it was unclear which exact samples were tested per replicate. In Page 9, Lines 17-18: "For all replicates, we determined that biotinylated proteins could be observed ...", But in Page 8, Line 24 : "We then isolated proteins from ... worms per group for both 'control' and 'trained' groups,... some of which were probed via western blotting to confirm the presence of biotinylated proteins". - Could the authors specify which samples were verified and clarify how? - OPTIONAL: include the fold changes of biotinylated proteins of all the ones that were tested. Similar to Figure 1.C. 2.Figure 2 does not add much to the reader, it can be summarized in the text, as the fraction of proteins enriched for specific cellular compartments. - I would suggest to remove figure 3 to text, or transfer it to the supplementry material. - OPTIONAL: I would suggest the authors to mark in a pathway summary figure similar to Figure 4 the results from the behavior assay of the genetic screen. This would allow the reader to better get the bigger picture and to connect to the systemic approach taken in Figures 2 and 3.
- Typo in Figure 3: the circle of PPM1: The blue right circle half is bigger than the left one.
- Unclarity in the discussions. In the discussion Page 24, Line 14, the authors raise this question: "why are the proteins we identified not general learning regulators?. The phrasing and logic of the argumentation of the possible answers was hard to follow. - Can you clarify?
Cross-Commenting
I would like to thank Reviewer #4 for the great cross comment summary, I find it accurate and helpful. I also would like to thank Reviewer #4 for spotting the typos in my minor comments, their page and figure numbers are the correct ones.
Small comment on common point 1 - My feeling is that it is challanging to do quantitative mass spectrometry, especially with TurboID. In general, the nature of MS data is that it hints towards a direction but a followup validation work is required in order to assess it. For example, I am not surprised that the fraction of repeats a hit appeared in does not predict well whether this hit would be validated behavioraly. Given these limitations, I find the authors' approach reasonable.
I also would like to highlight this major comment from reviewer 4: "In Experimental Procedures, authors state that they excluded data in which naive or control groups showed average CI < 0.6499, and/or trained groups showed average CI < -0.0499 or > 0.5499 for N2 (page 36, lines 5-7). " This threshold seems arbitrary to me too, and it requires the clarifications requested by reviewer 4.
Significance
This study does a great job to effectively utilize the TurboID technique to identify new pathways implicated in salt-associative learning in C. elegans. This technique was used in C. elegans before, but not in this context. The salt-associative memory induced proteome list is a valuable resource that will help future studies on associative memory in worms. Some of the implicated molecular pathways were found before to be involved in memory in worms like cAMP, as correctly referenced in the manuscript. The implication of the acetylcholine pathway is novel for C. elgeans, to the best of my knowledge. The finding that the uncovered genes are specifically required for salt associative memory and not for other memory assays is also interesting.
However overall I find the impact of this study limited. The premise of this work is to use the Turbo-ID method to conduct a systems analysis of the proteomic changes. The work starts by conducting network analysis and gene enrichment which fit a systemic approach. However, since the authors find that ~30% of the tested hits affect the phenotype, and since only 17/706 proteins were assessed, it is challenging to draw conclusive broad systemic claims. Alternatively, the authors could have focused on the positive hits, and understand them better, find the specific circuits where these genes act. This could have increased the impact of the work. Since neither of these two options are satisfied, I view this work as solid, but not wide in its impact and therefore estimate the audience of this study would be more specialized.
My expertise is in C. elegans behavior, genetics, and neuronal activity, programming and machine learning.
- The statistical approach and analysis of the behavior assay:
-
